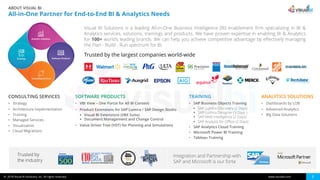
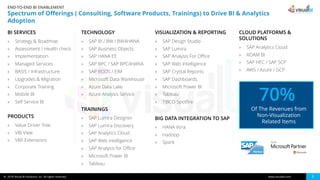
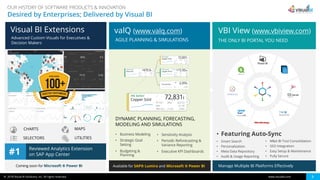
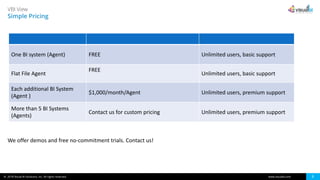
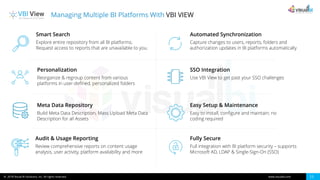
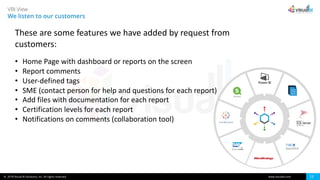
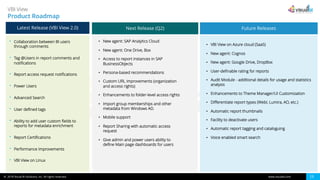
In this webinar recording, we explore why the latest version of VBI View is the only enterprise BI portal you need to manage multiple BI platforms like Tableau, Microsoft Power BI, SSRS, SAP BusinessObjects, Qlik, TIBCO Spotfire, MicroStrategy and more.
Data Analytics Strategies & Solutions for SAP customersVisual_BI
SAP customers are challenged in multiple fronts today, where we have rapidly evolved tools and technologies with smaller internal IT teams to evaluate them. In this webinar replay, Visual BI will offer strategies and solutions for some of the most common challenges faced by SAP BI & Analytics Leaders, Managers and Architects.
Landing Self Service Analytics using Microsoft Azure & Power BIVisual_BI
This webinar recording is designed to provide guidance for implementing self-service analytics utilizing Microsoft’s cloud data platform (Azure & Power BI) for broad consumption across the organization.
Expanding the capabilities of SAC with App DesignVisual_BI
SAC Application Design provides the ability to build more powerful applications on the cloud through advanced scripting capabilities. In this webinar replay, we will be focusing on the major features of Application Design and how it would add value to SAP Analytics Cloud.
In this webinar replay, we dwell deep into the latest updates in BI and Analytics, technology, and process trends that will shape data and analytics strategy in 2019 and beyond.
VBI View Your one stop solution to manage multiple BI PlatformsVisual_BI
In this webinar recording, we explore why Visual BI’s VBI View is the only enterprise BI portal you need to manage multiple BI platforms like Tableau, Microsoft Power BI, SSRS, SAP BusinessObjects, Qlik, TIBCO Spotfire, MicroStrategy and more.
ValQ allows business users across industries to visualize and optimize profitability & growth across various modules in a flick of a second with top-notch User Experience and latest features like the Simulation-Enabled Table View and KPI search option within complex models.
Value driver planning for mining using microsoft power bi webinarVisual_BI
In this webinar, we will showcase how some of the best mining firms have realized tremendous value by modeling business outcomes based on 1400+ financial and operational drivers. The live demo session would help you understand how you can leverage – ValQ for Microsoft Power BI – to achieve it all.
ValQ Data Acquisition Transformation TechniquesVisual_BI
ValQ allows business users across industries to visualize and optimize profitability & growth across various modules. This webinar showcases how you can connect ValQ to your Enterprise Data Warehouses like SSAS Cubes, Azure SQL DW, SAP BW Queries & SAP HANA Views.
In this webinar recording, we evaluate Traditional BI tools like SAP Business Objects (Web Intelligence and SAP Lumira Designer) and compare them against Self-Service BI and Data Discovery capabilities of the top players in the market, namely SAP Analytics Cloud, Microsoft Power BI, Tableau, Qlik Sense & TIBCO Spotfire.
In this webinar recording, we will be introducing the core concepts of Data Science and the resources in Azure to deliver a complete Data Science solution. We will also walk through a demonstration on how best to use Azure Databricks as a data scientist to process enterprise data and build a machine learning model to deploy.
Impactful Financial Reporting using Microsoft Power BI - WebinarVisual_BI
Financial reporting has traditionally had two options: the boring but very effective tabular reporting (preferred by many), and highly appealing but functionally limiting basic charts & graphs (preferred by a few).In this webinar, we will be showcasing how Finance users & analysts can have the best of both worlds!
Why Customers need to upgrade to SAP Lumira 2.2?Visual_BI
This webinar recording aims at portraying to customers the latest updates in the strategy for SAP Lumira. We will also be throwing focus on the latest features offered by SAP Lumira 2.2 and explaining the reasons behind this version of Lumira being the essential upgrade for customers on the lookout to address their data discovery and application building needs.
In this webinar replay, we explore the various options available in SAP Lumira Designer and Visual BI Extensions for SAP Lumira Designer – (VBX) to help migrate existing SAP Dashboards/Xcelsius and BusinessObjects Explorer applications to SAP Lumira Designer/ SAP Analytics Cloud (SAC).
we provide Visual BI insights and perspectives in the area of data governance and special considerations to take into account when approaching cloud-based solutions.
Webinar - ValQ for Production Planning and ControlVisual_BI
In this webinar, the presenter showcases with the help of a live demo on how a manufacturing firm can leverage Microsoft Power BI to drive and manage Production Planning in a visual and intuitive way. The demo also covers how resources and capacities can be managed effectively by leveraging scenario modeling and what-if simulation capabilities delivered by ValQ for Microsoft Power BI.
xViz Advanced Custom Visuals for Microsoft Power BI - What's New?Visual_BI
Get an overview of the latest Custom Visuals added to the xViz Suite. Understand how xViz Suite is geared towards helping Power BI Users and Enterprises to visualize data in a whole different way and enables effective business insights and decisions.
“What is special about QlikView? How is it different from other software?”
Some who ask these questions have experience with traditional BI (business
intelligence) reporting solutions and want to understand QlikView in that
context. Others have been exposed to standalone data visualization tools
and want to know how QlikView is different. Still others are on a mission to
put high-speed analytics in the hands of business users throughout their
organizations and are curious about how Business Discovery can help. This ppt showcases the benefits of an information workforce being empowered to
ask and answer the next question on their own, without having to ask a BI or IT
specialist for help. Empowering information workers to derive insights from data
helps organizations to streamline, simplify, and optimize decision making.
QlikView Tutorial For Beginners | What Is QlikView | Qlikview Tutorial | Qlik...Edureka!
This tutorial gives you an introduction to QlikView & how is it used for data discovery and data visualization. You will also learn briefly about Business Intelligence and understand Qlikview with a demonstration.
QlikView is considered to be the most flexible business intelligence platforms for data visualization that business analysts and business intelligence (BI) developers can use to create advanced BI apps. It is not only fast to deploy and easy to learn, but also improves data vizualization practices. Several companies across the globe today like banking conglomerate, e-commerce, consulting or manufacturing companies have been using Qlikview and benefiting from it. It is a single application platform for all BI needs which is helping companies across the globe with unprecedented business insights.
This webinar we will focus on products of Tableau, it’s data preparation and analytics capabilities and evaluate its features with that of other leading BI tools.
Decoding SAP's BI Analytics SAP Statement of Direction Visual_BI
In Sep 2019, SAP announced its new BI & Analytics strategy and Statement of Direction. This webinar, from Visual BI, will dwell deep into this Statement of Direction, what this announcement means to you, it’s the potential impact to your landscape and existing investments, and how to plan your BI and Analytics Initiatives for 2020.
Snowflake: The most cost-effective agile and scalable data warehouse ever!Visual_BI
In this webinar, the presenter will take you through the most revolutionary data warehouse, Snowflake with a live demo and technical and functional discussions with a customer. Ryan Goltz from Chesapeake Energy and Tristan Handy, creator of DBT Cloud and owner of Fishtown Analytics will also be joining the webinar.
Slides for the Usergroup meeting for the Manchester Power BI User Group on June 27th, 2019.
Subject: Power BI for Developers about Power BI Embedded and Power BI Custom Visuals
This presentation gives an update on the new release of Design Studio Extensions provided by Visual BI Solutions. These Design Studio extensions include charts, maps, filters and selectors, as well as a set of utilities. You will learn various types of advanced functionalities you could leverage as part of your dashboard and data visualization projects.
Advanced Dashboards using Design Studio Extensions - WebinarVisualBISolutions
This presentation gives an update on the new release of Design Studio Extensions provided by Visual BI Solutions. These Design Studio extensions include charts, maps, filters and selectors, as well as a set of utilities. You will learn various types of advanced functionalities you could leverage as part of your dashboard and data visualization projects.
Kyubit BI tools are a web based, collaborative business intelligence platform, aimed to quickly utilize your existing OLAP and SQL data, to transform it to meaningful analytics, data visualizations and metrics, presented on the dashboards.
If your business data is stored in SQL and OLAP databases, Kyubit BI tools will bring user friendly, web based environment to create and organize interactive dashboards, KPIs, attractive analysis reports to share it with your team using desktop and mobile devices.
South Florida SQL Saturday - Power BI Report Server Enterprise Architecture, ...Vishal Pawar
SSSF-Power BI Report Server Enterprise Architecture, Tools to publish reports and Best Practice.
•Chief Architect in Aptude Inc
•Microsoft MVP
•Microsoft Certified Trainer
•PASS BA VC Group Admin
•Global Power BI Group 20K+
•Udemy Free Power BI Course 30K
•VPawar@Aptude.com
Cognos Offering Manager Rachel Su demos the cool new functionality and improvements of Cognos Analytics 11.1.4 including custom visualizations, crosstabs and KPI widget improvements, compact legends, Exploration, Jupyter Notebooks and Smarts. View the video recording and download this deck at: https://senturus.com/resources/what-new-in-cognos-analytics-11-1-4/
Senturus offers a full spectrum of services for business analytics. Our resource library has hundreds of free live and recorded webinars, blog posts, demos and unbiased product reviews available on our website at: http://www.senturus.com/senturus-resources/
Introduction to Power BI to make smart decisionsVIVEK GURURANI
Power BI: Business intelligence like never before!
Power BI is a tool that allows accounting and finance managers and professionals to have relevant information at the right time to make strategic decisions in a flexible, centralized, and secure way. Transform your business with predictive analytics, data visualization, and information in real-time, thanks to Power BI.
Presentation Agenda:
1. Introduction to Power BI
2. Why would your business need Power BI?
3. Power BI Architecture
4. Data Sanitization & Cleansing Capabilities
5. Analytical Insights
6. Generating Department Wise Reports & Visualizations
7. Latest & Upcoming Power BI features
8. Live Q&A
Power BI Overview, Deployment and GovernanceJames Serra
Deploying Power BI in a large enterprise is a complex task, and one that requires a lot of thought and planning. The purpose of this presentation is to help you make your Power BI deployment a success. After a quick Power BI overview, I’ll discuss deployment strategies, common usage scenarios, how to store and refresh data, prototyping options, how to share externally, and then finish with how to administer and secure Power BI. I’ll outline considerations and best practices for achieving an optimal, well-performing, enterprise level Power BI deployment.
Embed SQL Reporting into Any Web ApplicationBob Report
Learn how JReport can seamlessly embed interactive Web reports, dashboards and data analysis directly into your application. Connect and access data from any SQL database. Customize rich visual report elements, as well as integrate JReport Server into your backend application server, security, and admin systems. Empower your business users with powerful dashboards, geo analysis, ad hoc reporting and data analysis capabilities.
Sql Saturday Jacksonville- Power BI Report Server Enterprise Architecture, to...Vishal Pawar
Sql Saturday Jacksonville- Power BI Report Server Enterprise Architecture, tools to publish reports and best practice
Power BI Ecosystem
Architecture of Power BI Report Server
Best Practices for PBI Report Server
General Best Practices Power BI Ecosystem
Q&A
Power BI: The Straight Talk on Microsoft’s Data Visualization Tool for BISenturus
Learn about Power BI, its components, how it fits into the larger Microsoft BI stack and its limitations. View the video recording and download this deck at: https://senturus.com/resources/power_bi_beyond_the_buzz/
Senturus offers a full spectrum of services for business analytics. Our resource library has hundreds of free live and recorded webinars, blog posts, demos and unbiased product reviews available on our website at: http://www.senturus.com/senturus-resources/.
Explore our comprehensive data analysis project presentation on predicting product ad campaign performance. Learn how data-driven insights can optimize your marketing strategies and enhance campaign effectiveness. Perfect for professionals and students looking to understand the power of data analysis in advertising. for more details visit: https://bostoninstituteofanalytics.org/data-science-and-artificial-intelligence/
Opendatabay - Open Data Marketplace.pptxOpendatabay
Opendatabay.com unlocks the power of data for everyone. Open Data Marketplace fosters a collaborative hub for data enthusiasts to explore, share, and contribute to a vast collection of datasets.
First ever open hub for data enthusiasts to collaborate and innovate. A platform to explore, share, and contribute to a vast collection of datasets. Through robust quality control and innovative technologies like blockchain verification, opendatabay ensures the authenticity and reliability of datasets, empowering users to make data-driven decisions with confidence. Leverage cutting-edge AI technologies to enhance the data exploration, analysis, and discovery experience.
From intelligent search and recommendations to automated data productisation and quotation, Opendatabay AI-driven features streamline the data workflow. Finding the data you need shouldn't be a complex. Opendatabay simplifies the data acquisition process with an intuitive interface and robust search tools. Effortlessly explore, discover, and access the data you need, allowing you to focus on extracting valuable insights. Opendatabay breaks new ground with a dedicated, AI-generated, synthetic datasets.
Leverage these privacy-preserving datasets for training and testing AI models without compromising sensitive information. Opendatabay prioritizes transparency by providing detailed metadata, provenance information, and usage guidelines for each dataset, ensuring users have a comprehensive understanding of the data they're working with. By leveraging a powerful combination of distributed ledger technology and rigorous third-party audits Opendatabay ensures the authenticity and reliability of every dataset. Security is at the core of Opendatabay. Marketplace implements stringent security measures, including encryption, access controls, and regular vulnerability assessments, to safeguard your data and protect your privacy.
Chatty Kathy - UNC Bootcamp Final Project Presentation - Final Version - 5.23...John Andrews
SlideShare Description for "Chatty Kathy - UNC Bootcamp Final Project Presentation"
Title: Chatty Kathy: Enhancing Physical Activity Among Older Adults
Description:
Discover how Chatty Kathy, an innovative project developed at the UNC Bootcamp, aims to tackle the challenge of low physical activity among older adults. Our AI-driven solution uses peer interaction to boost and sustain exercise levels, significantly improving health outcomes. This presentation covers our problem statement, the rationale behind Chatty Kathy, synthetic data and persona creation, model performance metrics, a visual demonstration of the project, and potential future developments. Join us for an insightful Q&A session to explore the potential of this groundbreaking project.
Project Team: Jay Requarth, Jana Avery, John Andrews, Dr. Dick Davis II, Nee Buntoum, Nam Yeongjin & Mat Nicholas
Adjusting primitives for graph : SHORT REPORT / NOTESSubhajit Sahu
Graph algorithms, like PageRank Compressed Sparse Row (CSR) is an adjacency-list based graph representation that is
Multiply with different modes (map)
1. Performance of sequential execution based vs OpenMP based vector multiply.
2. Comparing various launch configs for CUDA based vector multiply.
Sum with different storage types (reduce)
1. Performance of vector element sum using float vs bfloat16 as the storage type.
Sum with different modes (reduce)
1. Performance of sequential execution based vs OpenMP based vector element sum.
2. Performance of memcpy vs in-place based CUDA based vector element sum.
3. Comparing various launch configs for CUDA based vector element sum (memcpy).
4. Comparing various launch configs for CUDA based vector element sum (in-place).
Sum with in-place strategies of CUDA mode (reduce)
1. Comparing various launch configs for CUDA based vector element sum (in-place).