Download as PDF, PPTX
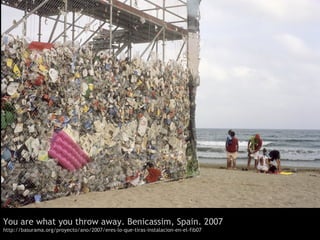
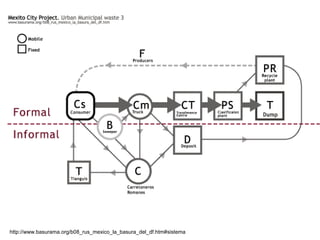
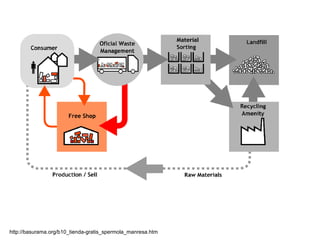
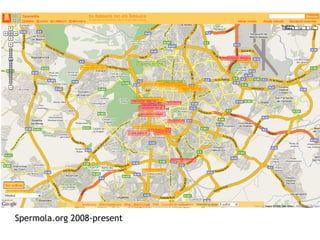
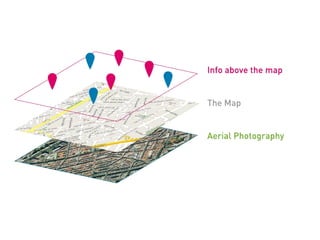
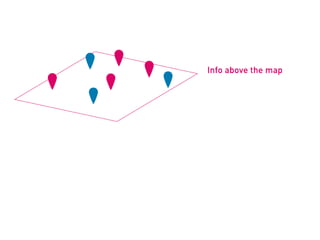
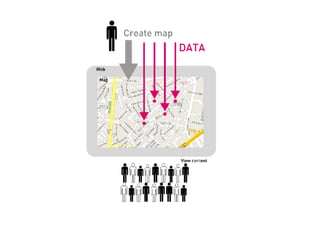
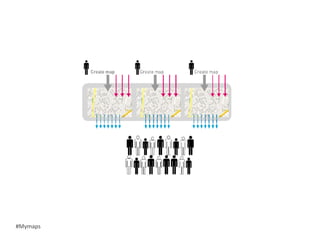
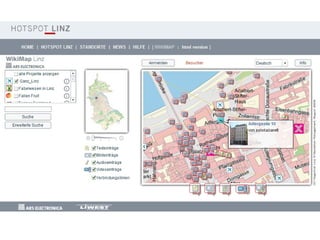
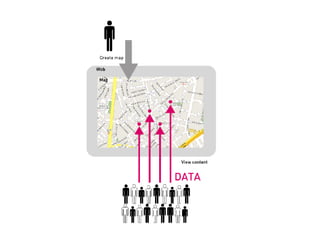
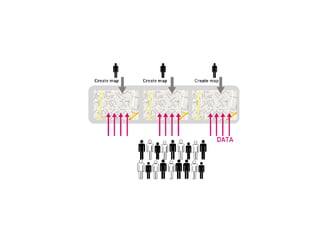
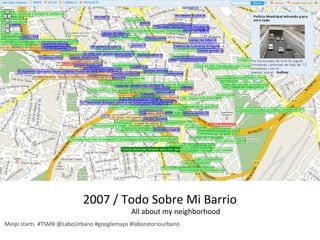
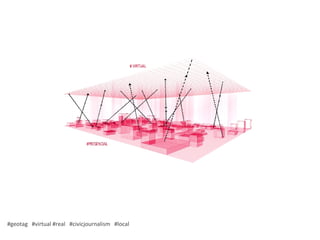
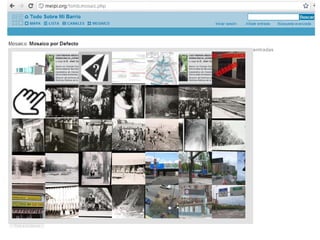
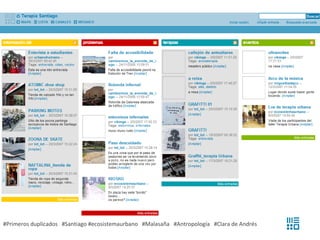
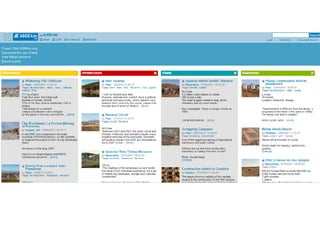
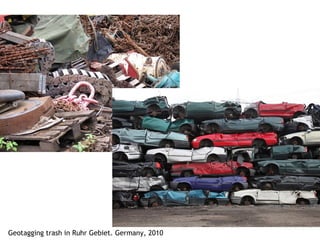
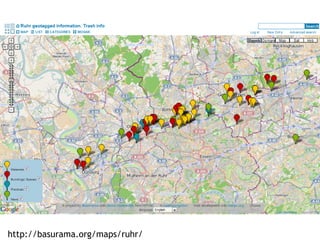
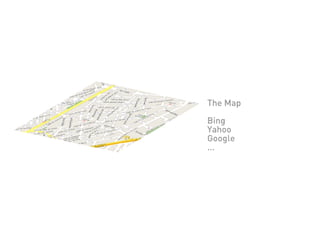
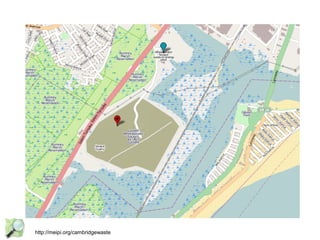
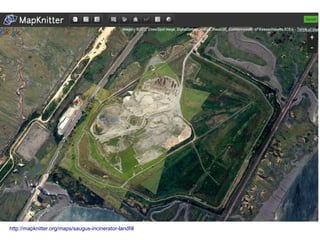
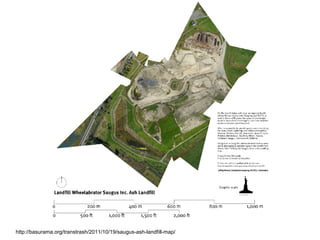
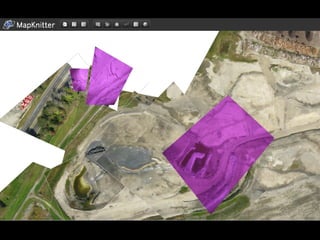
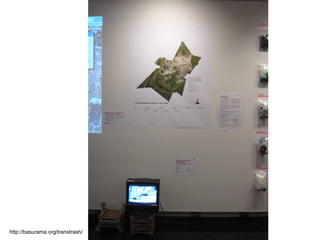

The document outlines various mapping projects and tools related to art and architecture, particularly focusing on waste and civic engagement. It features the work of Pablo Rey Mazón, including initiatives such as 'You are what you throw away' and geotagging efforts in various locations. Additionally, it contains links to related websites and resources from 2006 to 2016.


