Download as PDF, PPTX
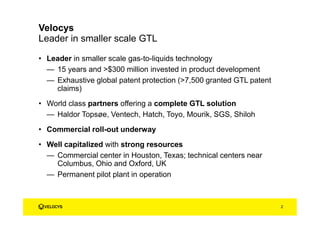
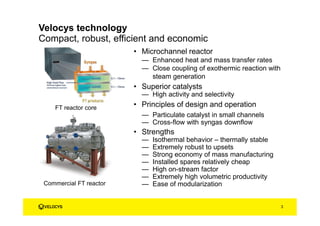
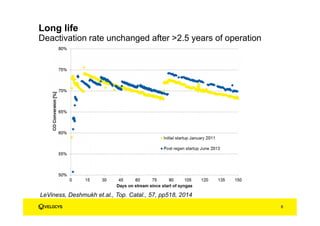
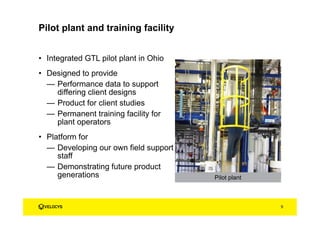
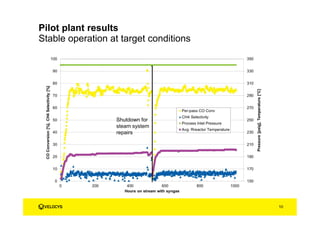
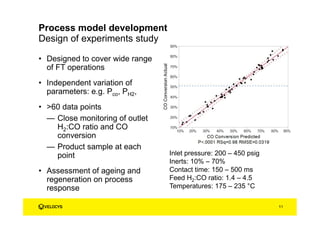


This document summarizes the commercialization of Velocys' advanced Fischer-Tropsch synthesis technology. Key points include: Velocys has 15+ years of experience and over $300 million invested in developing their microchannel reactor technology. Their pilot plant demonstrates stable long-term operation with excellent catalyst regenerability and lifetime. Their process is designed for modular scalability. Velocys works with world-class partners and has commercial rollout underway, with resources including technical centers and a permanent pilot plant. Their technology offers advantages including isothermal behavior, robustness, economy, and high productivity. Experimental design and validation ensure the catalyst and process meet commercial requirements for stability, performance, and tolerance to variations