The document summarizes the optimization of a TEG dehydration unit using recent advances in technology. Three technologies were selected to decrease the capital and operating costs and weight of the unit: liquid turbochargers, pervaporation membranes, and injection of semi-lean TEG. Simulation showed liquid turbochargers reduced energy consumption by 70%. Membranes decreased reboiling energy but were very costly. Semi-lean injection reduced equipment size but required design changes. The hybrid process doubled capital costs from the conventional design due to high membrane costs. Further research is needed to lower membrane prices and make them economically viable.


![2 1. Introduction and Project Charter
Natural gas that comes out of a well is saturated water. It often also contains other compounds
such as Hydrogen Sulfide, souring the gas. These components must be removed following the scheme
of figure 1.1. Moreover, several crucial reasons why water need to be taken out are presented below:
• It can trigger the production of hydrates and of crystals. When transport of the natural gas is
lead through long pipes, the chance of clogging becomes high and the removal of these plugs is
expensive.
• Water can cause corrosion to the pipelines.
• It can cause slugging flow conditions which increases the pressure drop over the pipeline.
• In presence of water, the heating value of gas decreases radically. [1] [2] [3]
One of the most used dehydration processes is Glycol dehydration, with about 30,000 units in
operation in the USA alone. This method can be performed with any Glycol solvent, but the mostly
tri-ethylene glycol (TEG) is used. This process started to be used in the 1970’s and has not changed
much since. In a contactor column of perforated trays or a packing, the wet gas stream and the TEG
stream will meet in counter current. After absorption the TEG rich in water goes to a regenerator,
where the water is taken out in a still column. The pressure difference between these two processes
is usually very high, going from 160-170 bar to atmospheric.
As mentioned before, the dehydration of Natural Gas using TEG has been used for over 40 years.
Not much has changed to the way this process works over all the years. However, with a growing
interest in process intensification and many developments in this field, it could be possible to decrease
the size of the TEG unit while maintaining or even increasing the effectiveness.
Parts of the system in which a potential weight loss can be significant are the TEG inventory and
the size of the regeneration system. Examples of techniques that will be looked into are pervaporation
membranes and microwave heating, among others, having the potential to reduce the size and price
of the unit significantly.
1.2. Objectives
The assignment, provided by Frames group, is to find and design a new dehydration unit by introducing
new innovations in order to lower the CAPEX, OPEX and weight of the conventional TEG dehydration
unit for an offshore platform using recent advances in science.
Therefore, the first task that needs to be done is the definition of the conventional process.Then,
the CAPEX, OPEX and weight of it will be set as benchmark. In the next stage, improvements will be
proposed and their impact will be estimated especially in terms of CAPEX, OPEX and weight. Finally,
conclusions and remarks will be posed about the proposed design of the unit.](https://image.slidesharecdn.com/10db86e5-b3a1-4553-b5bc-7c80961ebcd4-150915141925-lva1-app6892/85/CDP-FINAL-REPORT-10-320.jpg)
![4 1. Introduction and Project Charter
1.3.3. Plant capacity and location
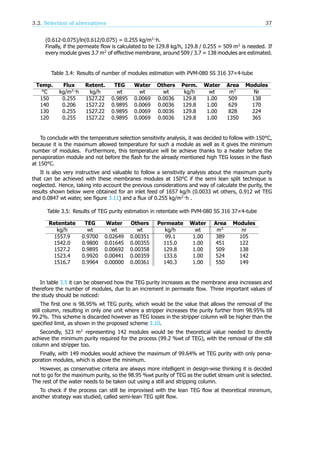
The capacity of the plant will be 380617 kg/h of wet natural gas which comes as feed stream to the
unit. Once the mass balance and streams study is completed, it results that the plant will produce
around 340000 kg/h of dry gas which includes small amount of water (24 mg/Sm3) coming out of the
unit. This means that 2594 kg/h (purity wt 99.4%) of lean TEG are needed to absorb the 131 kg/h of
water which needs to be removed. Given that the expected results are subject to 10% of turn down,
the capacity of the plant must hold these fluctuations too.
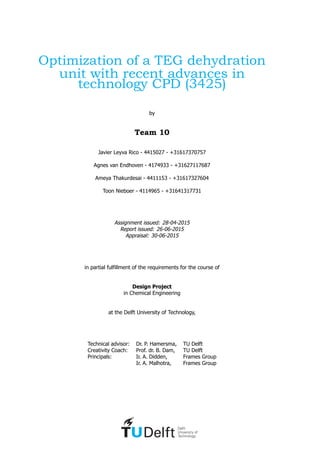
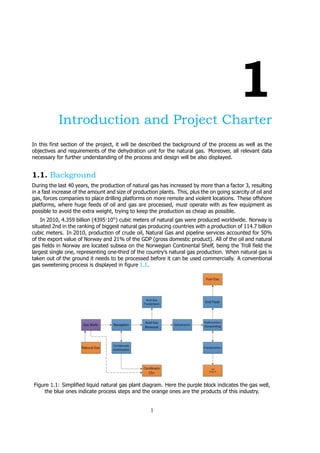
Figure 1.3: Norwegian geographical map,
green areas are open for petroleum and gas
platforms, red and orange are considered to
be opened for industrial uses [4]
The TEG dehydration unit will be located in the
European country Norway, specifically in an offshore
platform of its coasts situated in the North Sea. As
shown in figure 1.3 the whole western part of the Nor-
wegian coast in the North Sea is open for petroleum
and gas industry.
Norway is the world’s second biggest exporter of
natural gas and the fifth biggest exporter of oil, at
the same trying to become one of the world’s most
environmentally friendly industries in this field. This
country has high pollution standards and there is con-
tinued work on reducing emissions and avoiding ac-
cidents or spills. This sector is vital for the country’s
economy, representing about 25% of the gross do-
mestic product, 30% of the state income, more than
50% of export earnings and providing approximately
250,000 jobs, directly and indirectly. In addition, this
industry not only helps to its own wealth fare, but also
is a very important contributor for the innovation and
technological development in other related sectors.[5]
Norway has been producing gas for about 40 years,
but at this moment its production has lowered till 20%
of its highest peak. The development in natural gas
exports from facilities on the Norwegian Continental
Shelf (NCS) has drastically decreased as reported by
the Norwegian Petroleum Directorate (NPD) from 2006 to 2013. [6] The natural gas extraction has
reduced total sales gas volumes with around 4% relative to what was exported from the production
installations. In spite of this trend, optimism is present because of the discovery of new reserves, even
in mature areas. Together, these will amount to 400-600 million barrels of oil equivalents allowing new
projects in Norwegian waters in the next 10-15 years.
Although the production costs are relatively high in the North sea, the quality of the oil and gas,
the political stability of the region, and the close proximity to important markets in western Europe has
made it an important oil and gas producing region. The largest natural gas field in the North Sea, the
Troll gas field, lies in the Norwegian trench dropping over 300 metres. This required the construction
of the enormous Troll A platform to access it. Besides it, in the Ekofisk oil field, the Statfjord platform
is also notable as it was the cause of the first pipeline to span the Norwegian trench.
The average air temperature in summer is 17°C while it is 6°C during the winter. The average
temperatures have been trending higher since 1988, which has been attributed to climate change. Air
temperatures in January range on average between 0 to 4°C and in July between 13 to 18°C. The
salinity averages between 34 to 35 grams of salt per litre of water, having its highest variability where
there is fresh water inflow, such as at the Rhine and Elbe estuaries, the Baltic Sea exit and along the
coast of Norway.
With growing demand for improved gas technology, this field is suitable to process intensification.
As stated in the Petroleum White Paper, the Government has confirmed the strategy for developing the
petroleum and gas with a proactive, parallel commitment to increased recovery from production fields,
developing commercial/profitable discoveries, exploring in open acreage and opening up new areas.](https://image.slidesharecdn.com/10db86e5-b3a1-4553-b5bc-7c80961ebcd4-150915141925-lva1-app6892/85/CDP-FINAL-REPORT-12-320.jpg)
![1.4. Database 5
1.4. Database
In this section of the project, all relevant data of the compounds involved is tabulated. This is also the
data that is used in the simulations.
1.4.1. Component list
In this project only three different species are observed. TEG, natural gas and water. The natural gas
coming out of the well consist of the components shown in table 1.2. The properties of the different
species are discussed later in this section.
Table 1.2: List of components in Natural gas provided by Frames
Component name Mol. %
H O @saturation
N 0.18
CO 3.58
Methane (CH ) 86.49
Ethane (C H ) 5.33
Propane (C H ) 2.18
i-Butane (C H ) 0.49
n-Butane (C H ) 0.89
i-Pentane (C H ) 0.25
n-Pentane (C H ) 0.24
C + 0.33
1.4.2. Component and thermodynamic properties
Table 1.3: Component and thermodynamic properties of Triethylene Glycol and water
Property Value TEG Value water
Molecular Formula C H O H O
Molecular Weight 150.17kg/kmol [7] 18 kg/kmol
Boiling Point 285 °C[8] @ 1 atm 100 °C @1 atm
Melting Point -7 °C [8] 0 °C @ 1 atm
Density 1127.4 m @ 15 °C [8] 998.3 kg/m @ 200 °C[9]
Viscosity 0.00478 Pa.s @ 200 °C[8] 0.001003 Pa.s @ 200 °C [9]
Vapour Pressure <0.001 kPa [7] 2337 Pa @ 200 °C [9]
Heat of Vaporisation 61.04 kJ/mol @ 1 atm [8] 2257 kJ/kg @ 1 atm[10]
Triethylene Glycol (TEG)
TEG is the water absorbing species in this system. It is a colorless, viscous liquid, well known for
its hygroscopic properties and its ability for dehumidifying fluids. It is used especially as a desiccant
for dehydration of Natural gas. It will however degrade when the temperature rises above 204 °C,
this makes good temperature control important and hotspots should be avoided. It’s thermodynamic
properties can be found in table 1.3.
Water
Water is the universal solvent. Industrially, water has been used for many purposes, especially for
cooling. The natural gas obtained from wells is saturated with water which needs to be removed due](https://image.slidesharecdn.com/10db86e5-b3a1-4553-b5bc-7c80961ebcd4-150915141925-lva1-app6892/85/CDP-FINAL-REPORT-13-320.jpg)
![6 1. Introduction and Project Charter
to the reasons mentioned in section 1. The thermodynamic properties of water are also listed in table
1.3
Natural gas
Table 1.4: Component and thermodynamic properties of natural gas
Property Value natural gas
Molecular Formula 86.49% CH
Molecular Weight 19.5 kg/kmol (Frames specified)
Density [11] 0.79-0.9 kg/m @ STP
Net Heating Value [11] 46054800 J/kg (11000 kcal/kg)
Natural gas, consisting of predominantly Methane, is a hydrocarbon gas formed due to fossilization
of buried plants and animals. For these species to become natural gas they were below the earths
surface for over a thousand years. It is a non-renewable source of energy and is typically used for
heating (industrial) and cooking (domestic). Some of the properties of Natural gas are given in table
1.4. The specification of the natural gas that comes from the specific well in Norway are given in table
1.2.](https://image.slidesharecdn.com/10db86e5-b3a1-4553-b5bc-7c80961ebcd4-150915141925-lva1-app6892/85/CDP-FINAL-REPORT-14-320.jpg)
![8 2. Conventional Process
2.1.1. Contactor (C101)
Streams in: Wet gas <102>, Lean TEG <103>. Streams out: Dry gas, Rich TEG <104>.
The absorption column, also called the contactor in this process, is the main piece of equipment of
a TEG dehydration process. In the absorption process, a liquid is used to contact wet gas and remove
the water vapor. With absorption, the water content in the gas stream is dissolved in a relatively pure
liquid solvent stream. To achieve this it is necessary to create a surface area as large as possible
between the two phases. This can be achieved using several pieces of internal equipment, such as:
• Division into trays.
• Random packing.
• Structured packing.
Trays
Figure 2.2: Typical
bubble cap plate
column for TEG
dehydration
contractor[12]
One way to achieve a high surface area between the two phases is to divide
the column into trays as displayed in figure 2.2. Gas flows from below each tray
through bubble caps, which ensures the formation of small bubbles of gas. Each
tray is filled with liquid glycol which accumulates due to an overflow wall at the
tray. The small gas bubbles provide a large surface area which is needed for
the mass transfer. Because the bubbles rise relatively fast the contacting time is
short. Hence equilibrium is not reached. Therefore several trays are needed to
reach the dehydration specifications for gas transport, usually 6 to 20 trays are
used, spaced approximately 61 cm apart.[13]
Random packing
Various types of random packing are also used in glycol contactors to achieve a
high surface area for mass transfer. The total height of the packing in the vessel
can be calculated from the number of theoretical stages used in the design.
Typically suppliers of the packings have correlations for packing height needed
per theoretical stage.
Structured Packing
Structured packing is to load the column with arrangements of steel internals
over which the glycol flows downward. The gas flows upward through the pack-
ing and has a large contact area with the glycol. This provides a very efficient way for mass transfer to
occur and is therefore used the most throughout offshore dehydration[13]. Just as in random packing,
suppliers have developed a relationship between the packing height needed and the number of theo-
retical stages. When designing the column it is essential that the glycol is distributed evenly over the
top of the packing, to ensure a good mass transfer area. A typical structured packing is displayed in
figure 2.3.
Usually a structured packing is used as it provides the best mass transfer surface area compared to
random packing and tray columns. A larger surface area provides a better mass transfer and therefore
a smaller column. The wet gas is fed at the bottom of the column and dry gas leaves the top. At the
top the lean glycol is fed and the rich glycol will be returned below the wet gas feed.](https://image.slidesharecdn.com/10db86e5-b3a1-4553-b5bc-7c80961ebcd4-150915141925-lva1-app6892/85/CDP-FINAL-REPORT-16-320.jpg)
![2.1. Process description 9
Figure 2.3: Typical structured packing used in the industry[14]
2.1.2. Flash (V201)
Streams in: From HX (E201) <203>, Streams out: Drain, OVHD & to filters (S201) <205>.
(The stream numbers depicted refer to Figure C.1 in Appendix C)
Due to the high pressure used in the contactor some gas is physically dissolved in the liquid glycol. The
higher the pressure in the contactor, the more gas dissolves in the liquid. A flash tank is needed to take
that portion of gas out of the liquid. The liquid first gets heated in the still column and afterwards it is
depressurised in the flash tank. With these changes the gases evolve from the glycol in the gas tank.
It is designed as a three-phase separator to help remove any condensate in the liquid and therefore
increase the lifetime of the downstream filters.
2.1.3. Filters (S201)
Streams in: From flash (V201) <205>, Streams out: to HX (E202) <206>.
To prevent clogging and optimal conditions for glycol it is very important to keep the glycol as clean
as possible. Impurities might also cause foaming in the still or contactor. Therefore filters are installed
to take out impurities. Particle filter are usually in operation all the time to take out any condensate in
the liquid. Carbon filters can be bypassed most of the time and will be installed on stream, if there are
no hydrocarbons in the stream.
2.1.4. Reboiler (V202) & Still column (C201)
Streams in: From HX (E202) <207> & OVHD, Streams out: to OVHD & to Surge <208>.
The rich glycol is preheated through heat exchange with the lean glycol leaving the reboiler and
enters the top of the still column. By taking the temperature near the boiling point of glycol the glycol
release the absorbed water and any other compounds until a purity of 99.4% is reached. The reboiler
is heated through a fire tube in which natural gas, sometimes from the flash, is burned. The reboiler
and the still run at near atmospheric pressures.
2.1.5. Stripping column (C202)
Streams in: From reboiler (V202), Streams out: To Surge (V203).
A stripping column is inserted between the reboiler and surge to achieve the highest purity possible.
As stripping gas the gas phase from the flash vessel is used. A part of the water will dissolve in the
gas phase and be taken out to overhead treatment. The opposite happens from what is happening in
the contactor.](https://image.slidesharecdn.com/10db86e5-b3a1-4553-b5bc-7c80961ebcd4-150915141925-lva1-app6892/85/CDP-FINAL-REPORT-17-320.jpg)
![10 2. Conventional Process
2.1.6. Surge (V203)
Streams in: From Stripping (C202), Streams out: To booster pump (P201) <210>.
Due to the fluctuations in the gas feed, the circulation might not always be even. A surge drum is
installed to allow for these fluctuations and to achieve a constant recirculation of TEG. An additional
benefit is the fact that it can be used as a check to see if everything is still working correctly. When
the level is significant lower then the needed of the vessel either a leak or holdup is present in the
system.
2.2. Mass and energy balance
The inlet wet Natural gas flow for the design case is given to be 380617 kg/hr at 156.5 bar(a) and 35 °C
, the outlet dry gas water fraction and the glycol loses must be lower then 24 mg/Sm , as described in
Table 1.1. From the above information, the quantity of water required to be removed in the design case
and in the turndown case were calculated. For systematic design of the Dehydration unit,a step-wise
method given by Campbell [15] was used. It consists of following steps:
• Calculation of TEG concentration: The minimum concentration of lean TEG required for dehy-
dration of natural gas was calculated by first estimating the dew point of the outlet dry gas at
given conditions from the water content in natural gas v/s water dew point graph available in
[15] and figure B.2. From the calculated dew point, the concentration of lean TEG required was
calculated from the equilibrium dew point v/s inlet gas temperature graph available in [15] and
figure B.1.From this procedure, we find that the minimum concentration of the lean TEG required
for our case is 99.2% wt.
• Calculation of lean TEG circulation rate: From the knowledge of the water content in and targeted
water content out of the contactor, the TEG circulation rate was calculated by considering a ratio
20 kg TEG/ kg water removed for a number of theoretical stages of N=1.5. This ratio was agreed
upon during the BOD meeting with Frames. The number of stages were chosen taking into
account that most TEG contactors work with 6 actual trays (tray efficiency is considered to be
0.25). The circulation rate for TEG was calculated to be around 2594 kg/hr for the design case
using this method.
In the regeneration section, the stripper column was assumed to have 3 stages.This was assumed
taking into consideration that normally the stripper column(or still column) has a lower number
of stages than the contactor.
The exhaust gas from the flash is also diverted to the stripping column so as to aid in removing water
from rich TEG.It enters the stripping column via the reboiler. Before it enters the reboiler, it is contacted
with outgoing hot TEG. For determining the pressure of the flash drum,the still top was assumed to
be at 1 bar and subsequently heat exchanger pressure drops(0.5 bar each) were added. This gave
around 4 bar operating pressure for the flash drum including some margin.
2.2.1. Simulation on Aspen Hysys
Using the background calculations as basis, the process was simulated for design and turndown case
in Aspen Hysys platform using the Glycol Package for thermodynamic calculations. This package was
chosen as it is highly recommended for systems involving dehydration of gas with TEG. The following
observations were made during simulation:
• The concentration of TEG from the regeneration increased to 99.4% on simulation and so to be
consistent, the lean TEG concentration of 99.4% was used for the complete simulation. The total
stream summary can be found in appendix C.
• It was argued that by decreasing the TEG flow proportionately for a 10% turndown would cause
cavitation in pumps and may even lead to weeping in the regeneration column. Therefore, the
lean TEG flow for the turndown case was maintained at 33% (which corresponds to 877 kg/hr).
The total stream summary can be found in appendix E.](https://image.slidesharecdn.com/10db86e5-b3a1-4553-b5bc-7c80961ebcd4-150915141925-lva1-app6892/85/CDP-FINAL-REPORT-18-320.jpg)
![2.3. Equipment sizing 11
Energy demands
From the Aspen Hysys simulations the energy demands in pumping and heating can be found.
Table 2.1: Energy demands per type
Location Type Energy duty [kW]
P101 Electrical energy 13.4
P202 Electrical energy 0.155
Reboiler Gas heating 191.5
Total 205.055
Cooling
E203 Sea water cooler -103.5
C201 TEG Condenser -49.85
Total -153.35
Heat exchanger
E201 HX 88.5
E202 HX 168.5
2.3. Equipment sizing
All sizing presented in this section has been done following the methods described in appendix A. Every
size is reported tabulated and with equipment name. Vessel weight estimation have been preformed
using the method described in Sieder et al[16]. There it is estimated that vessel weight depends on
wall thickness of the shell, assuming the shell to be evenly thick throughout the vessel.
𝑊 = 𝜋(𝐷 + 𝑡 )(𝐿 + 0.8𝐷 )𝑡 𝜌 (2.1)
With:
L = length of vessel [m]
𝐷 = Diameter of the vessel [m]
𝜌 = Density [kg/m ]
𝑡 = Wall thickness [m]
Heat exchanger weights are estimated using Aspen Hysys. Only motor weights have been used to
estimate weight of pumps[17].
Contactor
Table 2.2: Size and weight comparison of the conventional contactor column
Name Type Diameter [m] Height [m] Wall Thickness [mm] Weight [kg]
C-101 Column 2.04 12.2 190 143135](https://image.slidesharecdn.com/10db86e5-b3a1-4553-b5bc-7c80961ebcd4-150915141925-lva1-app6892/85/CDP-FINAL-REPORT-19-320.jpg)
![12 2. Conventional Process
Vessels
Table 2.3: Vessel volumes
Name Type Volume Diameter Length Wall Thickness Weight
[m ] [m] [m] [mm] [kg]
V-201 Flash 0.535 0.554 2.217 6 221
V-202 Reboiler 0.465 0.529 2.117 6 202
V-203 Surge 1.16 0.719 2.875 6 371
Heat exchangers
Table 2.4: Total surface area needed per heat exchanger
Heat exchanger Surface area [m ] Weight [kg]
E-201 28.45 1253
E-202 147.0 3390
E-203 17.3 800
Basis and method of calculation of the area of heat exchanger is given in Appendix A Section
Still column
Table 2.5: Size of the conventional still column
Name Type Diameter [m] Height [m] Wall Thickness [mm] Weight [kg]
C-201 Still column 0.28 6.5 10 476
Stripping Column
Table 2.6: Size of the conventional stripping column between the reboiler and the surge
Name Type Diameter [m] Height [m] Wall Thickness [mm] Weight [kg]
C-202 Stripping column 0.25 0.5 6 32
Pumps
Table 2.7: Power requirement per pump
Pump Head [mlc] Power [kW] Weight [kg]
P-101A/B 1370 13.4 564
P-202A/B 20 0.155 22
2.4. Total weight
Adding all the weights of the separate pieces of equipment together, a total weight for the whole unit
can be estimated. In the case of the conventional process, this weight is estimated to be 150466 kg.
This is the dead weight of the unit without the weight of piping and the weight of the framework where
the unit is build.](https://image.slidesharecdn.com/10db86e5-b3a1-4553-b5bc-7c80961ebcd4-150915141925-lva1-app6892/85/CDP-FINAL-REPORT-20-320.jpg)
![2.5. Health, Safety & Environment 13
2.5. Health, Safety & Environment
2.5.1. Preliminary study of risks
One of the major points of the project is the analysis of risks and dangers arising from the unit. In
order to reduce them from a process design point of view the Dow’s Fire and Explosion Index (FEI)
has been performed on the absorber unit in the process. In addition, an analysis of the hazards of the
compounds present in the system as well as the possible waste generated was also carried.
The two major two flows present in the system are triethylene glycol and natural gas, described
below.
Triethylene Glycol
Figure 2.4: Safety of TEG
Some of the most important properties of triethylene glycol
(TEG) regarding safety are stated in table 2.8, where one
can appreciate that the boiling point is really high as well
as the auto-ignition temperature, reducing its risk.
Furthermore, there will be no explosion danger and
there is little toxicity danger, as shown in figure 2.4. Re-
lease of TEG into in the environment should be avoided as
much as possible, because the products of its biodegrada-
tion are more toxic than TEG itself. Moreover, in the case
of leak, the TEG should be diluted with water and absorbed into an inert material, whereas in the case
of fire, the fire should be extinguished with powder, water spray or foam. No water jet should be used.
Contact with heat sources should be avoided. Finally, direct contact with TEG should be avoided. When
in contact with eyes or digested a doctor should be contacted.
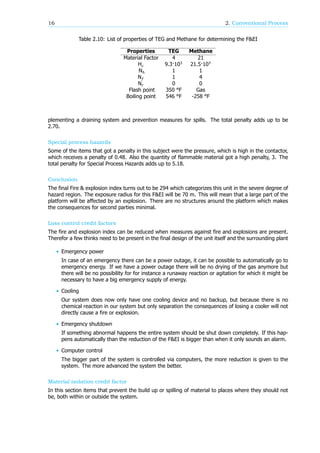
Table 2.8: List of properties for TEG [18]
Properties of TEG Value
Boiling point 285 C
Auto-ignition temperature 371 C
Flash point Closed cup 177 C
Open cup 165 C
Flammable limit Upper limit 0.9 %
Lower limit 9.2 %
LD (oral) 4700 mg/kg
TLV 10 ml/m
Natural gas
Figure 2.5: Safety of natural gas
Natural gas is highly flammable, creating the risk of explo-
sions, as can be seen in figure 2.5. Table 2.9 shows the
explosion limits of methane, which is a key component of
natural gas. A fire can not be extinguished unless the source
of the gas has been closed. So, it is advisable to let all the
gas burn up and then extinguish the fire with dry chemicals,
foam or CO .
In addition, when the gas is kept under pressure it can lead to the risk of frostbite, which occurs
when high-pressure gas is released, expanding and cooling down. This is however more dangerous
when handling liquefied gas, but in this system the natural gas remains in the gas phase. The gas is
not toxic but when released can be highly dangerous because it can cause asphyxiation by drawing
out all the oxygen. It has been found that up to concentrations of 10 000 ppm no physical changes
occur when a human is exposed. Studies have shown that there are some physical complications in
test animals who are exposed to high concentrations of methane (up to 70%) while having enough](https://image.slidesharecdn.com/10db86e5-b3a1-4553-b5bc-7c80961ebcd4-150915141925-lva1-app6892/85/CDP-FINAL-REPORT-21-320.jpg)
![14 2. Conventional Process
oxygen, but not much has been documented on these phenomenon and it seems unlikely that these
circumstances will occur on the plant.[19]
Table 2.9: Explosion limits of methane (key component in natural gas)[20]
Properties of methane Value
Explosion limits Lower 5%
Upper 15%
Health, Safety and Environment assessment
In conclusion, both components in the system are not extremely toxic. Good ventilation is important
to prevent a build up of natural gas in closed spaces because this can lead to asphyxiation.
Then, natural gas should not end up in the environment, hence if natural gas needs to be disposed
of, it should be burned, leading to mostly H O and CO . A danger of high concentrations of CO is that
it is heavier than oxygen and can therefor accumulate at the surface. This can cause asphyxiation.
Also, although TEG is not very toxic, the products of the degradation are. The liquid TEG needs to get
diluted with water and then absorbed into an inert and collected. When this is done, what remains can
be diluted again and disposed of through the waste water system.
Finally, the conditions at which the system operates are relatively mild. The highest temperature
reached will be around 200 °C. Only one recorded incident has been found. In may 2013 in Spain a
fire occurred after TEG was added via the TEG inlet. The TEG inlet was aimed at a hot spot and the
TEG vapor caught fire. It was only reported as a level 1 emergency shut down. [21]
If TEG or natural gas leak from the system, the chance of it reaching a hot surface or an ignition
spot should be decreased as much as possible. Another big risk comes with the high pressure in the
absorption tower. When the vessel or piping at high pressure breaks, it can result in an explosion
and both TEG and Natural gas can be released. The sudden expansion of the natural gas can cause
frostbite. Also the chance of an explosion of natural gas will increase in these conditions, resulting in
big amount of natural gas released in a very short time.
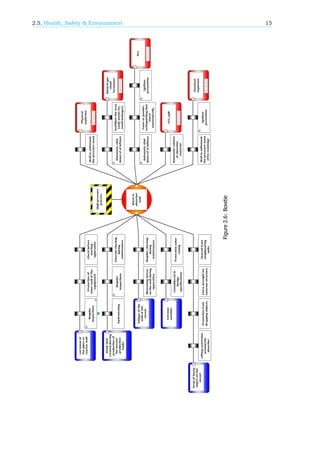
In addition to the HSE assessment, a bow tie diagram has been made, shown in figure 2.6. For this,
it was selected that the high pressure of 156.5 bar in the contactor is the most hazardous condition
present in the process and the selected top event is a rupture in the wall of the contactor. The bow tie
can be used to identify threats that increase the chance of the top event happening. It also contains
the consequences of that top event. Also barriers to decrease the treats and the consequences of the
top event are added.
2.5.2. Dow’s Fire and Explosion Index (F&EI)
In order to classify the risk of the dehydration process, a fire and explosion index has been made. The
tabel with assigned values and the final F&EI can be found in appendix L
The two species in the system that are capable of creating a fire or explosion are TEG and natural
gas. Because natural gas exists of multiple species, the properties of methane have been used, since
the largest part of natural gas consists of this. The information needed for the F&EI is in table L.1.
For the F&EI the material with the highest Material Factor(MF) needs to be used for the calculations.
In this case this will be the natural gas because the methane has an MF of 21. Also the unit which
will be looked at needs to be specified, in this case the contactor. The species present in this unit are
natural gas, TEG and water.
Base factors
This subject is cut into multiple items. The only items which get a penalty are: Material Handling
and Transfer, Access and Drainage and Spill Control. These items get penalties because of the highly
flammable nature of natural gas, the inaccessibility of an offshore platform and the difficulty in im-](https://image.slidesharecdn.com/10db86e5-b3a1-4553-b5bc-7c80961ebcd4-150915141925-lva1-app6892/85/CDP-FINAL-REPORT-22-320.jpg)
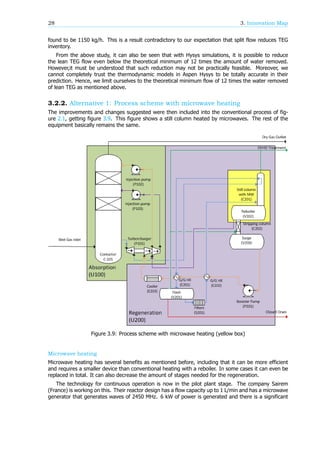
![20 3. Innovation Map
Advantages of this technique are that there is no heat transfer zone so the heating occurs in the entire
volume that is being irradiated. The waves are selectively being absorbed and a rapid heating can
occur.
The dielectric component in the TEG regenerator is water, this is the species that needs to evaporate
out of the TEG. This will also be the target specie of the microwaves generating the heat, which means
that the water in the mixture can become warmer than the TEG, which will lead to faster evaporation.
TEG however has an interaction with water molecules as it contains alcohol groups. This can lead to
the TEG heating up as well. No test regarding this specific process to check if only the water heats has
been done as of now. The molar fraction of water molecules of the feed stream is 32 mol%. Regarding
this high molar concentration it can be expected that there is a lot of contact between water and glcyol
and therefor energy transfer. A different benefit is however, while there is no heat transfer area, the
total volume of TEG and water can be heated at once and uniformly.
Figure 3.1: Microwave heating[22]
Experiments showed that only heating up the liquid will not benefit the separation of the binary
mixture[22] and the stirring will also create a uniform temperature in the liquid phase which takes
away the advantages of the selective heating. However, when also the surface is irradiated with
microwaves the separation of the more volatile species is more effective than in a separation without
microwave heating. One explanation of this is that very locally high temperatures will occur, resulting
in a smaller column with fewer trays. These so called ”hot-spots” can lead to a fouling in TEG, as TEG
thermally degrades at temperatures above 210 C.[7] Discussion with professor Stankiewicz and Dr.
Guido Sturm however provided a different outlook as they mentioned new ways of heating which was
very controllable an predictable and therefor those hot-spots can be avoided.
The uniformity of microwave heating however is debatable. In literature it is described that by
absorption in the medium the intensity of the field will drop quickly. This leads to a large part of the
volume not heated and parts of the volume overly heated [23]. Dr. Guido Sturm mentioned however
that this effect can be reduced a lot, because the behaviour of microwaves can be described quite
good. By altering the field and radiation techniques these hot spots can be minimized. This is not done
on a larger scale then lab, but shows good promise.
The currents hurdles in the use of microwaves in industry are the yet unreliable scale up of the
process, which can be helped by modeling the field and design it that way. Another hurdle is the
implementation of microwave equipment into conventional chemical equipment.
3.1.3. Super-X packing
The Super X-pack packing is an innovation which is fabricated to mimic fractal structures. These fractal
structures, shown in figure 3.2, are known to enhance transfer rates, leading to a decrease in TEG
inventory. This packing could be beneficial in both the regenerator as well as in the absorber.](https://image.slidesharecdn.com/10db86e5-b3a1-4553-b5bc-7c80961ebcd4-150915141925-lva1-app6892/85/CDP-FINAL-REPORT-28-320.jpg)
![3.1. Description of alternatives 21
Figure 3.2: Nagaoka Corp. Super-X packing
The Nagaoka International Corporation, which
developed the Super X-pack packing, made very
interesting claims with the development of this
technology. The company claimed a reduction of
the pressure drop by a factor of 3, while the pack-
ing reduced the height of the column by a factor
of 5 compared to conventional column, achieving
up to 80% energy saving [24].
However, despite these advantages, severe
operational problems were encountered, mostly
due to the packing getting clogged and fouled,
which eventually lead to the stopping of the com-
mercialisation of the packing.
3.1.4. Liquid turbochargers
A turbocharger, is an induction device used to al-
low more power to be produced by an engine of
any given size. A engine with a turbocharger can
be more efficient than a naturally aspirated en-
gine, because the turbine forces more air, and proportionately more fuel, into the combustion chamber
than atmospheric pressure alone. [25]
Applied to process engineering it can be used to transfer pressure using kinetic energy. A high-
pressure fluid or gas is used to drive a turbine which pressurises a low pressure liquid. Within TEG
dehydration it can be used to pressurise the lean glycol heading for the contactor, by transferring the
energy available in the rich Glycol.
Figure 3.3: Liquid Turbocharger [26]
As 50% of the total cost of gas refining is represented by energy costs, the addition of a turbocharger
can provide a significant cut down in operational costs. By using a liquid charger less investments
need to be done regarding pressurising the glycol, therefore a cut down in capital expenditure is also
expected. The company Energy Recovery claims an energy efficiency of up to 80%. On the other
hand, this technology reduces the degrees of freedom of the system, as it combines different streams
of the process. These Glycol powered pumps are currently sold skid mounted by companies such as
Kimray and Rotor-Tech.
3.1.5. Pervaporation membranes
This technology is itself a combination of two others. On the one hand it there is a permeation,
transport through a membrane, on the other there is evaporation, changing its phase from the liquid](https://image.slidesharecdn.com/10db86e5-b3a1-4553-b5bc-7c80961ebcd4-150915141925-lva1-app6892/85/CDP-FINAL-REPORT-29-320.jpg)
![22 3. Innovation Map
to the vapour phase (see figure 3.4). Therefore, the water of TEG-water mixture in our regeneration
system might be taken out using a hydrophilic membrane as a selective barrier between the liquid
phase feed and the vapour phase permeate allowing the desired molecules to diffuse through it by
vaporization.
Figure 3.4: Pervaporation membrane for dehydration
One of its main benefits is not being a pressure driven process. Instead, the driving force is due
to a higher chemical potential on the feed side than on the permeate side. The gradient in chemical
potential is then maximized by using high feed temperatures and low pressures on the permeate side
as well as combining polymer properties for membrane. [27].
By replacing distillation by the pervaporation membranes for the Glycol regeneration subsystem,
according to Pervatech company savings up to 75% on regeneration equipment and 30 to 50% reduc-
tion on energy usage can be achieved. However, membrane units, including the need for vacuum, are
currently relatively expensive. Also, if the supply contains suspended matter or dissolved salts mem-
brane pollution may be encountered. In this case, an effective pretreatment must be implemented.
e.g. filtration.[28]
3.1.6. Molecular sieves + TEG unit
Molecular sieves are usually installed in applications in which very low residual water content is required,
such as ahead of a low temperature hydrocarbon extraction process. They are suitable for drying very
sour natural gas that also contains aromatic compounds. However, heavier hydrocarbons might be
difficult to remove from the silica gel during the regeneration step. These solid compounds (silica gel
or zeolites) used as molecular sieves are prepared as round or slightly elliptical beads having a diameter
of about 4 to 6 mm. Each of these compounds has its own characteristic affinity and adsorptive capacity
for water, so a good selection is crucial in the process.[29]
While dehydration with Glycol is the most common process used to meet the water dew point
specification for sale the gas, under certain conditions solid adsorbents are also used for this purpose.
i.e. Molecular sieves are used for many offshore applications such as floaters (FPSO’s). The positive
side of molecular sieves is that they can handle wave-motions very well. The downside is the scale
and weight of the units.
A molecular sieve dehydration unit after a TEG dehydration unit, will be used for polishing and
increasing water removal efficiency. It will be able to achieve very low dew points which are required
for cryogenic plants. Additionally, molecular sieve units can also handle large flow variations as well as
higher inlet gas temperatures. However, they have higher initial capital investments, are way bigger
and heavier than comparable Glycol units.](https://image.slidesharecdn.com/10db86e5-b3a1-4553-b5bc-7c80961ebcd4-150915141925-lva1-app6892/85/CDP-FINAL-REPORT-30-320.jpg)
![3.1. Description of alternatives 23
Figure 3.5: Molecular sieve for water adsorption
3.1.7. Addition of entrainer
Heterogeneous azeotropic distillation is a widely used technique to separate non-ideal mixtures. The
procedure is incorporating a new component (entrainer) in the system such as toluene or octane. The
entrainer will form a heterogeneous azeotrope with water of the initial mixture. Then, the azeotrope
having minimum boiling point goes to a decanter and splits in two liquid phases. The stream rich in
the entrainer is recycled back to the azeotropic column and the other water rich goes to treatment.
This azeotropic distillation has various advantages such as a high efficiency of separation, low reflux
ratio and a reduced heat energy and it can be a suitable solution for the regeneration part. However,
adding a third component always increases the complexity of the separation. The gas-liquid composition
distribution in the column is much more complicated than that in the usual one, and a stable operation
of a distillation column is very difficult. It is also necessary to add more pieces of equipment for the
entrainer recovery, resulting in a bigger and heavier unit.[30] [31]
3.1.8. Vacuum operation in still column
At vacuum conditions the concentration of TEG obtained in the still column will be higher for the
same reboiler temperature used for atmospheric operation, as the boiling point decreases for the same
rich solvent. Another possibility of vacuum operation, if not so pure TEG is required, is reducing the
temperature in the reboiler. In addition, it helps extend the useful life of the system Glycol.
However, reboilers are operated under vacuum conditions in rare cases due to its complexity, vacuum
generation equipment and the fact that any air in the process may result in degradation of the TEG.
Hence, it is usually cheaper to use stripping gas. [32]
3.1.9. Rotating packed beds (HiGee)
Firstly described by Ramshaw and Mallinson[33], rotating bed reactors or HiGee (short for high gravity)
distillation, have taken a large role in offshore oil dehydration. It is used widely in China and the benefits
were readily recognized by the American market and is currently being introduced there. The European
industry however lacks behind regarding HiGee distillation.
By rotating the reactor the gravitational field increases 100-1000 times and therefore the shear flow
is enhanced. The high centrifugal speeds allows for packing with relatively higher specific surface area
and achieves order(s) of magnitude higher gas liquid throughput and possible mass-transfer rates.[34]
These factors lead to a significant reduction in size of conventional mass-transfer equipment such as
absorption and distillation towers. Ramshaw and Mallinson [33] claim achieving an up to 100-fold
reduction in equipment size. Later experimental studies however tempered these claims and found an
5-10 fold reduction in HETP [35] which is still an significant decrease in size.
The main downsides however are that moving parts are introduced which are more maintenance
sensitive than conventional techniques. The inside rotating bed has a dynamic seal, which prevents
the gas from bypassing the rotor, but compromises the reliability and longevity due to its contact with](https://image.slidesharecdn.com/10db86e5-b3a1-4553-b5bc-7c80961ebcd4-150915141925-lva1-app6892/85/CDP-FINAL-REPORT-31-320.jpg)
![24 3. Innovation Map
working fluid. Also, one unit can not be competent for continuous distillation owing to incapability of
feeding the rotor at radial position, equivalent to middle plate of traditional distillation column. Thus two
units of rotating bed are required for continuous distillation; one as rectifying and the other stripping.
HiGee technology can both be used in the contactor part of the process as well as the TEG regener-
ation. By using rotating bed reactors the size and weight of the contactor and still column and therefor
the total unit can decrease significantly.
Figure 3.6: HiGee distillation: (a) RPB integrated with reboiler and condenser; (b) RPB with off center
feed and integrated with reboiler [34]
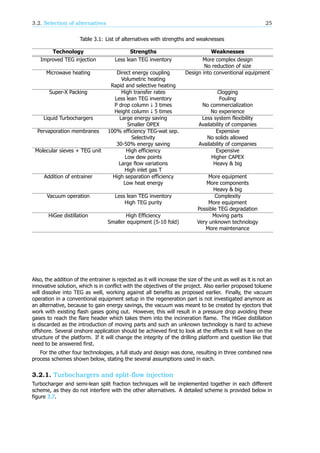
3.2. Selection of alternatives
In this case, from stated above it is decided to gather the information in a way such that it can be
compiled and presented in a consistent, high visualization chart, showing the strengths and weaknesses
of each application for each criteria, accompanied by focused comments from the team, resulting in
the selection table 3.1.
There is no such thing as one solution which fits all requirements when it comes to chemical solvent
recycling or dehydration. Solutions are therefore necessarily hybrid in nature where a combination
of traditional and improved technologies is used. Each technology provides a part of the separation
required within a customized sequence and overall methodology and further research must be carried
out in terms of OPEX, CAPEX and weight to determine the improvement of the alternative.
However, there are already five possible technologies that will be rejected directly. The first one will
be Super-X packing, because it is not being commercialized anymore, avoiding any possibility of its real
implementation. Secondly, the hybrid molecular sieve plus TEG unit is not going to be implemented
due to its weight and scale makes it not suitable for platform location, which is one of the requisites.](https://image.slidesharecdn.com/10db86e5-b3a1-4553-b5bc-7c80961ebcd4-150915141925-lva1-app6892/85/CDP-FINAL-REPORT-32-320.jpg)
![26 3. Innovation Map
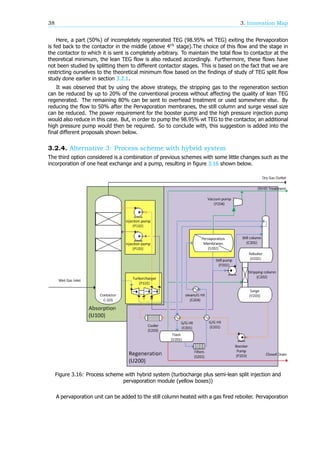
Figure 3.7: Process scheme with turbocharger and semi-lean TEG split flow injection, shown in yellow
boxes
Turbochargers
The size, and therefore weight, of the injection pump system can be lowered by using a turbocharger,
because as mentioned, this device interchanges the energy of a high pressure stream with a low
pressure one. This can also decrease the total energy needed for the pumps as well as the number of
them.
The total operational costs for pumping, assuming a total cost of 10 ct €per kWh[36], is 1.34 €per
hour [37]. Assuming 24/7 operation the total costs per year of this pump will be € 11.738. Using
calculation tools provided by Energy Recovery©a recovery of 70 % of energy can be achieved. This
will result in a evenly large reduction of operational costs. So a reduction of € 8.216 on a yearly basis
can be achieved. Not only that, also a reduction of 9.38 kW is achieved at the pumping section. This
leads to a reduction of approximately 79.866 kg CO which is released on a yearly basis[38]. The
total energy requirement for the plant is 205 kW. By adding a liquid turbocharger into the conventional
process a reduction of 4,6 % can be achieved without increasing the capital expenses which will be a
real benefit.
Split Flow injection
This alternative is studied with an intention of reducing the TEG inventory in the recirculation system.
Following is the discussion of the study.
The incoming lean TEG is fed to the top-most stage of the contactor. As per the design of the
conventional process in section 2.2, the contactor has 6 theoretical stages, therefore, it is possible to
study injection of TEG ranging from 2 to 6 splits, simultaneously varying the percentage of flow flowing
through each split branch. However, it should be noted that while injections with 2 and 3 splits can
be studied extensively for symmetric arrangements between theoretical plates, for higher number of
splits(eg:4-6) there would be too many combinations possible.](https://image.slidesharecdn.com/10db86e5-b3a1-4553-b5bc-7c80961ebcd4-150915141925-lva1-app6892/85/CDP-FINAL-REPORT-34-320.jpg)
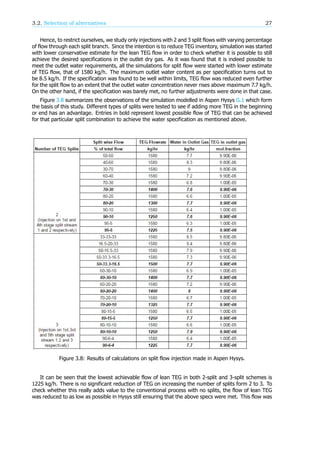
![3.2. Selection of alternatives 29
part of the design devoted to cooling. The unit is a metallic vessel which assures pressure containment
and allows for fast thermal transfer.[39]
However, heating volatile, often flammable organic solvents, under well-controlled conditions is
not trivial on the large scale, but it can be done. Lastly, another Sairem 915 MHz batch reactor
was changed in the strategy to microwave scale-up through the use of a different wavelength, since
penetration depths, dielectric constants and loss factors vary with wave length as well as solvent nature
and temperature. In this case, the energy savings were due to a decrease in heating time and not in
energy efficiency, because normal household microwaves (central component of any microwave device)
has an efficiency of 50-65% transforming electricity into electromagnetic irradiation[40]. However dr.
Guido Sturm of TU Delft, a expert in microwave heating, mentioned an efficiency off up to 80 %.
Overall, there are reasons to think that together with the use of the stripping technique for glycol
regeneration, with a gas normally flowing upward counter currently to the descending liquid TEG, the
unit can achieve the requirements and reductions proposed. Depending on the stripping agent used,
i.e. outlet gas from the flash (V201), water, hydrocarbons, or both are absorbed from the glycol into
the stripping gas, thus regenerating the glycol for reuse in dehydrating the natural gas. But the reality
is that these processes produce an additional gaseous or aqueous waste stream that requires off-site
attention such as incineration, disposal, or further treatment.
An attempt has been made to model microwave in Aspen Hysys, but a working model is has not yet
been achieved. The column is split into three stages, modeled as flashes and a condenser and reboiler
part. At each stage a specific temperature is set, as is used with microwave distillation. These are all
separately heated. The feed enters the column at the middle stage, this because it gave the lowest
energy use. This model however leads to very high and fluctuating energy demands per stage. Three
different settings were used. Firstly the natural gradient occurring in the still column has been taken.
Secondly a linear decrease between the top and bottom stage has been tested and lastly the inverse
of the natural gradient is tested. This is displayed in table 3.2 and the model used is added in appendix
F.1.
Table 3.2: Energy demands from the different setting of the model described in appendix F.1
Setting 1 Setting 2
Stage
Set
Temperature (C)
Energy
Demand (kW)
Set
Temperature (C)
Energy
Demand (kW)
Condenser 97 -17.05 97 -6004
3 99.26 -162.6 125 5999
2 101.9 -16230 150 -30.85
1 150.7 16370 175 92.66
Reboiler 204 192.8 204 87.83
Setting 3 Conventional
Stage
Set
Temperature (C)
Energy
Demand (kW)
Set
Temperature (C)
Energy
Demand (kW)
Condenser 97 -7139 97 -49.85
3 145 7136 - -
2 165 32.69 - -
1 185 63.91 - -
Reboiler 204 55.17 204 191.5
As this model did not achieve realistic values different professionals in the field of modeling mi-
crowave heated column were contacted. From these conversations, it became apparent that, as this
is a very young field of research no real simulation models are achieved as for now.
The main fields in which microwave heated columns are used are pharmaceutical and food process-
ing technologies. Outside of these fields the benefits have not been sufficient enough to take the risk
of entering a new technology. To estimate the costs, the energy needed by a conventional still column
is used.
When designing the new column a few constraints should be kept in mind however. No magnetic](https://image.slidesharecdn.com/10db86e5-b3a1-4553-b5bc-7c80961ebcd4-150915141925-lva1-app6892/85/CDP-FINAL-REPORT-37-320.jpg)
![3.2. Selection of alternatives 31
Figure 3.10: Process scheme with pervaporation membranes (yellow box)
For a specific organic mixture (in this case TEG with water) one has to test to determine selectivity
and fluxes during the process of dehydration, because the binding force of TEG to water is high, so
fluxes will be lower compared to some other organics e.g. ethanol or IPA. In addition, it is more
difficult to dehydrate to such low water concentrations. Then a preliminary study of different types of
membranes was carried out to find out these fluxes on basis of the conventional process outlet vapour
stream from the flash.
First of all, apart from company claims, a paper was found which states that with commercial silica
membrane modules of the company Pervatech, if a feed of 0.054 wt water, 0.936 wt TEG and 0.005
wt Toluene and 0.005 wt Hexane at 150 °C, a 99.99+% wt of water purity in the permeate can be
achieved, at an average flux of 0.255 kg/m ·h [41].
In addition, an experiment performed to determine the water flux of a zeolite membrane module
from Mitsui USA was tested at 100 °C with a TEG mixture containing 5% wt water resulting in 0.13
kg/m ·h as permeate.
Other sources say that 95% wt water purity can be achieved with NaA zeolite membranes exhibiting
high separation performance and fluxes of 0.5 kg/m ·h for 5% wt feed water content at 120 °C. [42]
Also, a realistic research with improved membranes such as Sulfonated Poly-ether-ether Ketone
(SPEEK) was carried, resulting in only 98% of water purity the permeate side with 5% wt water content
in the feed at 32 °C and flux of 0.2 kg/m ·h as depicted in Huang et al (2002) [43].
In other words, in order to estimate the area required for a complete separation we carried this
analysis. It means roughly, avoiding pressure drops, no TEG losses in permeate, constant flux, 100%
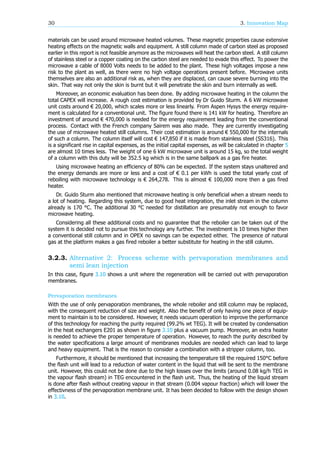
water permeation and no membrane size limitation, that if our stream of 1657 kg/h (0.0033 wt others,](https://image.slidesharecdn.com/10db86e5-b3a1-4553-b5bc-7c80961ebcd4-150915141925-lva1-app6892/85/CDP-FINAL-REPORT-39-320.jpg)
![3.2. Selection of alternatives 33
more than the minimum required in the design case.
Table 3.3: Results of membrane area estimation
Membrane Temperature TEG in retentate water in permeate Area
type °C wt wt m
Silica 130-150 0.996 0.999 562
Zeolite 92-100 0.996 0.999 1080
NaA Zeolite 120 1.00 0.950 295
SPEEK 30-70 0.998 0.980 716
It is observed that nowadays there is a lot of research on new membranes and that most of them
fulfill the requirements for our dehydration purpose. However, there are not many supplier companies.
Examples are Sulzer Chemtech Membrane Systems, based in Heinitz, Germany; and Pervatech BV of
Enter, The Netherlands, allowing a wide range of different temperatures, modules and flows.
Furthermore, although the major component in the over head vent is water stream, as shown, this
stream may contain organic compounds, including aromatic and non-aromatic organic vapours, such
as BTEX. The emissions of them are now classified as Hazardous Air Pollutants (HAPs), and are subject
to regulations which can be better handled by these membranes.
This is, therefore, a simple and reliable method to reduce or eliminate the release of these compo-
nents, basically caused by the hydrophilic membranes which in one step both regenerate the solvent
and capture any hazardous components. Despite efforts, a cost-effective regeneration technology that
truly minimizes or eliminates HAP emissions has not yet been developed.
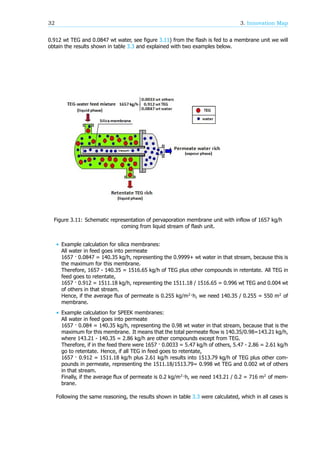
To finish, also a comparison of the energy consumption based on the heat requirement for evap-
oration for the removal of 1 kg water from feed mixtures can be seen in the following figure 3.12,
extracted from Huang et al (2002) [43].
It is clear in figure 3.12 that the advantage of applying pervaporation for dehydration of Glycol
becomes significant when the water content in the feed is significantly low. It should also be pointed
out that this simple comparison was based only on the theoretical energy consumption at a constant
pressure. Many other factors such as cooling of distillation, thermodynamic heat effectiveness, and
capital cost are not considered, all of which are important for the economic evaluation of these two
separation technologies.
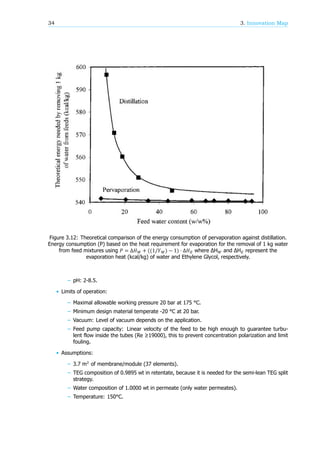
To maintain more realism in the design, Pervatech membranes were selected for further consider-
ations. In the following study, a commercial Pervatech module PVM-080 SS 316 37×4-tube (120cm)
with 3,7 m² membrane surface was used with these assumptions and characteristics[44] [45] [46].
In the following images 3.13 and 3.14, a commercial Pervatech module is presented to get an overall
impression of the module we are using. In our case, instead of 7 elements of 4 channels each, we will
used 37 elements of 4 channels each.
• Membrane element characteristics:
– Size: 1200 x 25 mm (LxD), effective area 0,10 m² (standard). Each element has 4 channels
with 7 mm inside diameter.
– Membrane type: Hybrid silica hydrophilic membrane.
– Substrate material: α-Al2O3.
– Intermediate layer: Gamma alumina.
– Top layer: Hybrid Silica coated on inside of the support tube.
– Pore Size: 0.3–0.5 nm.
• Limits of membrane:
– Temperature: limit max. 150 °C.
– Pressure: limit max. 50 bar.](https://image.slidesharecdn.com/10db86e5-b3a1-4553-b5bc-7c80961ebcd4-150915141925-lva1-app6892/85/CDP-FINAL-REPORT-41-320.jpg)
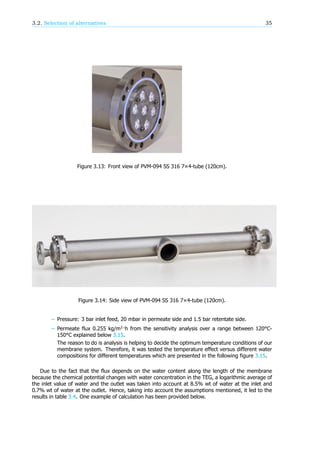
![36 3. Innovation Map
Figure 3.15: Feed water concentration against water flux in permeate for Ethylene Glycol- water
mixtures [41]. In red is represented extrapolated data.
• Example of calculation of number of modules estimation:
At 150 °C, the inflow for the membrane module is 1657 kg/h (0.0033 wt others, 0.912 wt TEG
and 0.0847 wt water), this is take from Aspen Hysys. For achieving the purity required after
membrane module (98.95% wt TEG) we follow:
All TEG goes to the retentate 1657 · 0.912 = 1511.18 kg/h of TEG, representing 0.9895 wt of
that stream. Therefore, the total flow of retentate is 1511.18 / 0.9895 = 1527.22 kg/h.
Hence, 1527.22 - 1511.18 = 16.04 kg of water plus other compounds. All other compounds go
to the retentate too, due to high water selectivity of the membrane, 1657·0.0033 = 5.47 kg/h
of other compounds(BTEX etc.). 16.04 - 5.47 = 10.57 kg/h of water goes into the retentate,
representing 10.57/1527.22 = 0.0069 wt water purity in that stream.
If 1657·0.0847 = 140.35 kg/h of water is fed, 140.35 - 10.57 = 129.8 kg/h is in the permeate
with 1.00 wt water purity.
At the entrance of the module, the water content in TEG is 0.085 wt, which represents a flux
of 0.612 kg/m ·h, while at the exit of the module the water content is the required 0.007 wt
of water in TEG, which gives a flux of 0.075 kg/m ·h. Therefore, doing an logarithmic average](https://image.slidesharecdn.com/10db86e5-b3a1-4553-b5bc-7c80961ebcd4-150915141925-lva1-app6892/85/CDP-FINAL-REPORT-44-320.jpg)

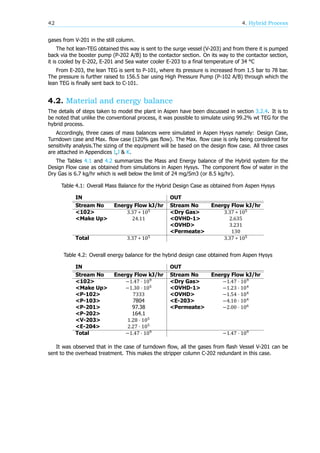
![4.3. Equipment sizing 43
4.2.1. Energy demands
All calculations are from Aspen Hysys. For the liquid turbocharger an energy recovery of 50 % is
assumed as explained earlier.
Pumping
Table 4.3: Pump duties for the hybrid system
Type Head [mLc] Power [kW]
P-102 A/B 692.9 2.04
P-103 A/B 758.2 2.17
P-201 A/B 7.9 0.027
P-202 A/B 15.5 0.045
P-203 A/B - 49
Heating
Table 4.4: Heating duties for the hybrid system
Name Type Power [kW]
E204 Steam 61.31
V202 Gas fired 35.56
Cooling
Table 4.5: Cooling duties for the hybrid system
Name Type Power [kW]
E203 Sea water 11.37
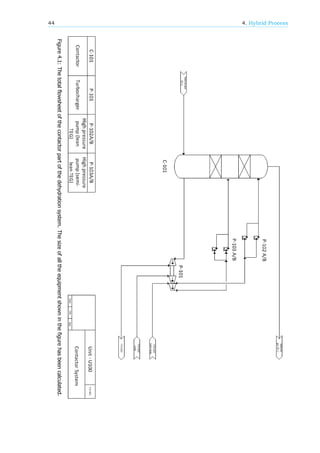
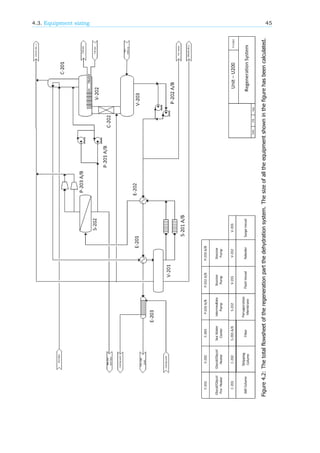
4.3. Equipment sizing
Equipment sizing has been done for all the pieces of equipment mentioned in figure 4.1 and 4.2.
Also, as requested in the assignment for this course, a total equipment summary is added in the last
appendix, Appendix M.
All sizing has been done following the methods described in appendix A. All determined sizes are
reported and tabulated. Sizes of similar kinds of equipment related the conventional process, if present,
are also reported.
Furthermore, in this case also weight of each equipment is included in order to get a good compar-
ison between conventional and hybryd units.
Vessel weight estimation have been preformed using the method described in Sieder et al[16].
There, it is estimated that vessel weight depends on wall thickness of the shell, assuming the shell to
be evenly thick throughout the vessel with equation 2.1. It was decided also to take the pervaporation
membrane unit as a set of vessel modules.
Finally, heat exchanger weights are estimated using Aspen Hysys, whereas only motor weights have
been used to estimate weight of pumps.](https://image.slidesharecdn.com/10db86e5-b3a1-4553-b5bc-7c80961ebcd4-150915141925-lva1-app6892/85/CDP-FINAL-REPORT-51-320.jpg)
![46 4. Hybrid Process
Contactor (C-101)
The height of the column in the hybrid system is assumed to be the same as the conventional. This
is because the estimation has been done with trays which later on will be packed. There is significant
space between packing levels for an additional sparger so here there is no gain nor a loss in size.
Table 4.6: Size and weight comparison of both conventional and hybrid contactor column
Type Diameter [m] Height [m] Thickness [mm] Weight [kg]
Conventional 2.04 12.19 190 143135
Hybrid 2.04 12.19 190 143135
Vessel sizing (V201, V202 & V203)
Table 4.7: Vessel volumes
Vessel Type Volume Diameter Length Thickness Weight
[m ] [m] [m] [mm] [kg]
Flash (V-201) Conventional 0.535 0.554 2.217 6 220
Hybrid 0.313 0.46 1.85 6 154
Reboiler (V-202) Conventional 0.465 0.529 2.117 6 201
Hybrid 0.132 0.347 1.392 6 87.6
Surge (V-203) Conventional 1.16 0.719 2.875 6 370
Hybrid 0.342 0.476 1.906 6 164
Still column (C-201)
Table 4.8: Size and weight comparison of both conventional and hybrid still column
Type Diameter [m] Height [m] Thickness [mm] Weight [kg]
Conventional 0.28 6.5 10 476
Hybrid 0.145 6 13 310
Pervaporation membranes (S-202)
For complete detailed calculations see appendix A. In this case, due to the uncertainty of size and
weight, all the results have a 50% of security factor with following assumptions:
• The width and height of the unit were calculated, then multiplied by 1.5 to include space for
maintenance and pipes and finally normalized into round dimensions.
• The length was taken equal as commercial Pervatech PVM-094 SS 316 7×4-tube module with 0,7
m², because the membranes used inside for both are the same.
• The total size of the unit was calculated as rectangular set of 14x10 modules (WxH) of 1.402 m
length each, supposing there is no space limitation.
• For the weight, each module was considered a cylindrical vessel. Then a factor of 1.5 was included
for accounting the weight of internal and membranes inside it.
The results for the pervaporation unit are displayed in the following tables 4.9 and 4.10
Pumps (P-101, P-102 A/B, P-103 A/B, P-201 A/B, P-202 A/B)
In the hybrid system two new pumps are added and also a liquid turbocharger, or Glycol pump (P-
101), is considered to be a pump. The first pump P-103 is added to injection the TEG straight from](https://image.slidesharecdn.com/10db86e5-b3a1-4553-b5bc-7c80961ebcd4-150915141925-lva1-app6892/85/CDP-FINAL-REPORT-54-320.jpg)
![4.4. Total weight 47
Table 4.9: Pervaporation membrane module size and weight
Module Type Flange Diameter Length Thickness Weight
[m] [m] [m] [mm] [kg]
Pervap. memb. Hybrid 0.302 0.260 1.405 6 97
Table 4.10: Pervaporation membrane unit size and weight
Unit Type Modules Width Length Height Weight
[Nr] [m] [m] [m] [kg]
Pervap. (S-202) Hybrid 138 7 1.405 5 13386
the pervaporation membranes. The other added pump, P-201, is used to transport the TEG from the
pervaporation membranes to the still column. The duties of all the pumps are in table 4.11. The duties
of P-102 & P-103 can be lowered however due to the addition of a liquid turbocharger. This will be
discussed further in 5.2.1.
Table 4.11: Pump duties for the hybrid system
Type Head [mLc] Power [kW] Weight [kg]
P-102 A/B 692 2.04 88
P-103 A/B 758.2 2.17 88
P-201 A/B 7.9 0.027 22
P-202 A/B 15.5 0.045 22
P-203 A/B - 49 1666
4.4. Total weight
The total dead weight of the new hybrid system is 161,086 kg. This is calculated by adding all different
weights together. The conventional process had a total weight of 150,433 kg. This means the total
weight of the process increased with the introduction of the new innovations. The biggest differences
can be seen in the introduction of pervaporation membranes. The introduction of the membranes did
not cut down the weight of the still column enough to also cut down on the total weight of the system
even though the weight of the reboiler is reduced with more then half. The split flow injection however
helped a great deal, it sized down all equipment after the split.
4.5. Safety, Health & Environment
In the proposed hybrid system the species present are still the same as in the conventional process
and therefore safety, health and environmentally aspects can be taken as equal as in the conventional
unit.
However, the only things that did change and can have an effect on the risk and hazard of this
system are for instance the vacuum present with the pervaporation membranes unit. Also extra pumps
have been added such as injection pump or vacuum pump.
Finally, there are now two inlet points of TEG into the contactor column instead of only one, which
brings an extra risk of leaking and malfunctioning of joints.
Furthermore, in the next subsection a HAZOP analysis will be conducted in order to select and
evaluate problems that may represent future dangers to workers or pieces of equipment, or prevent
efficient operation.
4.5.1. Hazard and Operability study (HAZOP)
For the hybrid system a HAZOP has been performed. For this study three points in the flow scheme
have been chosen as mentioned below.](https://image.slidesharecdn.com/10db86e5-b3a1-4553-b5bc-7c80961ebcd4-150915141925-lva1-app6892/85/CDP-FINAL-REPORT-55-320.jpg)
![48 4. Hybrid Process
The first one is the TEG flow coming from the pervaporation membranes. The second point is the
natural gas outflow from the contactor. The last point is the TEG outflow from the surge. At these point
the consequences and solutions for problems like too much flow or no flow have been considered. The
results of the HAZOP can be found in appendix L.
Resulting the HAZOP, a few actions need to be taken. In the pipeline of point one, after the
pervaporation membranes should be a concentration and a flow meter which need to be connected to
an alarm. If there are inconsistencies in the values that these controls show then there is something
wrong with either the membranes or the pumps. Also there should be a reverse flow prevention in this
pipe. At point 2, after the contactor there should be a flow meter, for when the flow is too little big or
too little either water is not removed from the gas or gas is leaving via an other route. This controller
should also be connected to an alarm. In order to prevent flow problems at point 3, after the surge, a
level controller has been put on the surge and has been connected to the valves controlling the in and
outflow of TEG from the entire system.
The meters that are only connected to an alarm have not been added to the control scheme in
order to keep the figure clear and readable.
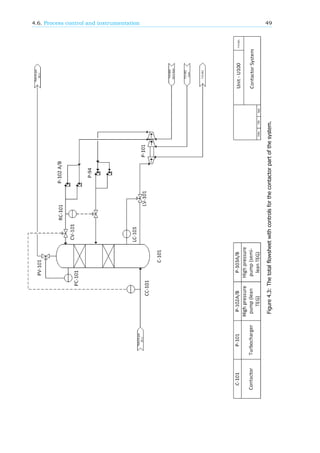
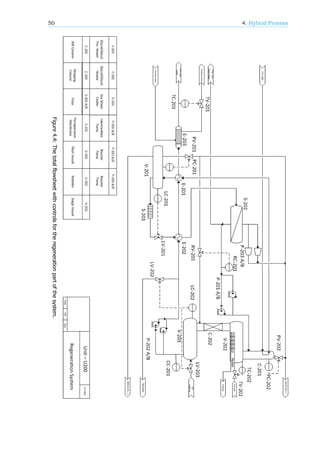
4.6. Process control and instrumentation
The choices have been made following the plan found in the book of Seider, Seader, Lewin and Widagdo
[16]. This book presents 9 steps to end up with a controlled system. The system has been split into
two separate flow schemes, one which contains the contactor, and one that contains the regeneration
steps. In this case both schemes will be dealt with simultaneously. The resulting process control
schemes are shown in figure 4.3 and 4.4.
The entire process starts with the inflow of wet natural gas. The amount of natural gas coming in
is not controlled for this unit but is set at the well head. The amount of TEG needed to dehydrate the
natural gas is dependent on the water content of the natural gas entering the system. The amount of
water present in the natural gas inflow is measured by concentration controller CC-101. This controller
is connected to the valve that controls the inflow of TEG coming from the surge(CV-101). The second
TEG inflow, coming from the pervaporation membranes, is controlled with a ration controller (RC-101)
connected to the previously mentioned stream via RV-101. The rich TEG flow from the contactor is
controlled with a level controller(LC-101) in the contactor via valve LV-101. This is because there should
be a constant level of TEG present in the bottom of the contactor. The natural gas outflow from the top
of the column is controlled with a pressure controller(PC-101) which will be set to a certain pressure
and that way control the outflow via valve PV-101.
The rich TEG first goes to the flash (V-201). Here the gas outflow is controlled with pressure
controller PC-201 with a valve on the outflow (PV-201). The liquid outflow is controlled with a level
controller (LC-201) via valve LV-201. To prevent build up of contaminants in the flash there is an extra
liquid outflow, the drain, which will be manually controlled.
The TEG will now go through the pervaporation membranes to the still column. The gas outflow
from the still column is controlled with pressure controller PC-202 via valve PV-202. The liquid TEG will
go to the reboiler and then the surge without passing another valve. The surge needs a liquid level
between certain values. Liquid controller LC-202 is in charge of this. When the level gets too low, valve
LV-203 will open end lean TEG from storage will come in. If the level gets too high, LV-202 will open
and TEG will flow to the storage tank.
The amount of water that is taken out of the TEG in the still column is primarily determined by the
energy input into the reboiler. There will be a temperature controller (TC-202) which will try to keep
the reboiler at a certain set point by increasing or decreasing the fuel gas going into the reboiler via
valve TV-202. The set point will be determined with the concentration controller CC-201. When the
concentration of water gets too high the temperature in the reboiler needs to be increased and vice
versa.
From the surge the TEG will go through two heat exchangers and then a sea water cooler. The
amount of sea water passing through the cooler is controlled with temperature controller TC-201 which
is placed behind the cooler. The water flow is controlled with valve TV-201.](https://image.slidesharecdn.com/10db86e5-b3a1-4553-b5bc-7c80961ebcd4-150915141925-lva1-app6892/85/CDP-FINAL-REPORT-56-320.jpg)
![5
Economic Analysis
In this chapter all investments for both the conventional as the hybrid system are estimated. The
sizes are taken from appendix A. First the total investment costs are estimated using Lang’s method
and secondly the OPEX is estimated. All economic reduction achieved by the new process are in this
chapter.
5.1. CAPEX
All prices are estimated using the Prijzenboekje of the Dutch Association of Cost Engineers [47]. Except
from C-101, P-101 & P-202. These are estimated using the Matche’s website [48]. All prices have been
adjusted to 2014 using CEPCI numbers. If a price was found in US dollars an exchange rate of 1.25
euros per dollar was used to convert it [49]. Finally, a factor of 1.25 is used to transform this prices
from USA to EU displacement.
5.1.1. Conventional
Vessels & columns
Table 5.1: CAPEX for all vessels and columns in the conventional process
Equipment Number Diameter (m) Length (m) Thickness (mm) Price (Euro)
C-101 1 2.04 12.2 190 €1,160,000
C-201 1 0.27 6.5 10 €68,738
C-202 1 0.25 0.5 6 €27,236
S-201 A/B 2 0.0254 - - €6,459
V-201 1 0.55 2.22 6 €23,750
V-202 1 0.53 2.12 6 €23,594
V-203 1 0.72 2.88 6 €25,781
Pumps
Prices of pumps were estimated with the Prijzenboekje [47].
Table 5.2: CAPEX for all pumps inside the conventional process
Equipment Number Capacity (m /h) Head mLc Max. Power (kW) Price (Euro)
P-101 2 2.3 1370 13.4 €19,973
P-202 A/B 2 2.7 20 0.155 €11,932
51](https://image.slidesharecdn.com/10db86e5-b3a1-4553-b5bc-7c80961ebcd4-150915141925-lva1-app6892/85/CDP-FINAL-REPORT-59-320.jpg)
![52 5. Economic Analysis
Heaters & Coolers
Prices of heaters were estimated with the Prijzenboekje [47].
Table 5.3: CAPEX for all heaters & coolers inside the conventional process
Equipment Number Area (m ) Price (Euro)
E-201 1 28.45 €35,017
E-202 1 147 €89,489
E-203 1 17.3 €33,720
Total costs
The total investment costs for equipment can be calculated now by adding all these prices. As this
is a fluid and gas plant a Lang factor for process equipment and installation of 5.93 is estimated[50].
This gives a final investment of € 9,047,332. As mentioned by frames a conventional unit has a price
between 5-10 million euros, so this estimate seems to be accurate.
5.1.2. Hybrid
Vessels & Columns
For the calculation of a membrane module price, the following assumptions were take into account:
• The module is considered as a vessel of SS 316. Therefore with 0.26 m diameter, 1.402 m of
length and 6 mm thickness.
• The price of SS 316 is calculated by its weight (97 kg obtained in unit sizing, Chapter 4) following
Matche’s web page [48]. Then a factor of 1.5 of security is added to account the price of the
membrane elements.
The results for the estimated price of one module are presented in the following table 5.4.
Table 5.4: CAPEX for a pervaporation membrane module
Equipment Number Diameter (m) Length (m) Thickness (mm) Price (Euro)
PV module 138 0.26 1.402 6 €20,156
From contact with Pervatech, it was given that a module of 4 elements on 50 cm length with a
weight of 10 kg costs about €5,000. Thus, having a module of around €20,000 is totally feasible. The
other vessels are estimated using the same methods as with the conventional process.
Table 5.5: CAPEX for all vessels and columns in the hybrid process
Equipment Number Dimension (m) Length (m) Thickness (mm) Price (Euro)
C-101 1 D=2.04 12.2 190 €1,160,000
C-201 1 D=0.145 6 13 €73,925
C-202 1 D= 0.25 0.5 6 €27,236
S-201 A/B 2 D=0.0254 - - €6,459
S-202 1 W=7 and H=5 1.402 - €2,781,000
V-201 1 D=0.46 1.85 6 €22,813
V-202 1 D=0.35 1.39 6 €21,563
V-203 1 D=0.48 1.91 6 €22,969](https://image.slidesharecdn.com/10db86e5-b3a1-4553-b5bc-7c80961ebcd4-150915141925-lva1-app6892/85/CDP-FINAL-REPORT-60-320.jpg)
![5.2. OPEX 53
Pumps
Prices of pumps were estimated with the Prijzenboekje [47].
Table 5.6: CAPEX for all pumps inside the hybrid process
Equipment Number Capacity (m /h) Head mLc Max. Power (kW) Price (Euro)
P-101 1 2.5/0.8/0.7 - - €12,813
P-102 A/B 2 0.7 692 2.04 €25,625
P-103 A/B 2 0.7 758 2.17 €25.625
P-201 A/B 2 1.2 7.9 0.027 €13,229
P-202 A/B 2 0.8 15.5 0.045 €13,229
P-203 252.3 - 49 €28.750
Heaters & Coolers
Prices of heaters were estimated with the Prijzenboekje [47].
Equipment Number Area (m ) Price (Euro)
E-201 1 4.424 €33,720
E-202 1 24.35 €35,017
E-203 1 2.64 €27,236
E-204 1 2.44 €27,236
5.1.3. Conclusions regarding CAPEX
When all the prices for hybrid are added to each other and the Lang factor has been incorporated a
price of €25,845,566 arises for total ownership. This is almost three times higher as the conventional
process, which costs € 9,047,332. While all equipment is reduced in size and price the introduction
of membranes is such a big investment that the end price is much higher. This observation is also done
with regard to the weight of the total unit.
5.2. OPEX
As this process only represents one step in a whole offshore process the OPEX is only calculated
regarding the pumping, heating, cooling and some remarks about maintenance will be done. It is
expected that only these factors are changed with the introduction of new technologies.
5.2.1. Pumping
Conventional
In the conventional process two pumps are present, P-101 and P-202. With the specification given in
table 5.7. These were taken from Aspen Hysys simulations.
Table 5.7: Specifications of both pumps in the conventional
Equipment Number Capacity (m /h) Head mLc Max. Power (kW) Price per year (€)
P-101 1 2.3 1370 13.4 € 11,738
P-202 A/B 2 2.7 20 0.155 € 135
Total 3 - - 13.555 € 11,873
Hybrid
As pump P-202 is used to compensate the pressure drop in the system it is a vital and unchangeable
part of the process. P-101 however can be powered by using the pressure which is released from](https://image.slidesharecdn.com/10db86e5-b3a1-4553-b5bc-7c80961ebcd4-150915141925-lva1-app6892/85/CDP-FINAL-REPORT-61-320.jpg)
![54 5. Economic Analysis
the rich Glycol stream. The total operational costs, assuming a total cost of 10 ct €per kWh[36], is
1.34 €per hour [37]. Assuming 24/7 operation the total costs per year of this pump will be € 11,738.
Using calculation tools provided by Energy Recovery©a recovery of 70 % of energy can be achieved.
This will result in a evenly large reduction of operational costs. So a reduction of € 8,216 on a yearly
basis can be achieved. Not only that, also a reduction of 9.38 kW is achieved at the pumping section.
This leads to a reduction of approximately 79,866 kg CO which is released on a yearly basis[38]. By
adding a split injection system however the injection pumps change. An additional pump is needed
because of the addition of an extra stream. An extra pump is also needed to transport the TEG from
the pervaporation membranes to the still column. The power duties are displayed in Table 4.11. The
second injection pump makes it harder to have the same beneficial effects of the turbocharger as in
the conventional process as not one stream with more or less the same needs to be pressurized, but
two streams with half the size. Contact has been made with Energy Recovery regarding this. They
mentioned that it is possible to use the power released and transfer it to two separate streams, but
it makes the system less efficient and harder to control. A maximum efficiency of 50% of recovery is
assumed to use in calculations.
Table 5.8: Pump duties for the hybrid system
Type Head [mLc] Power [kW] Price per year [€]
P-102 A/B 1426 2.040 € 1,787
P-103 A/B 1647 2.168 € 1,899
P-201 A/B 7.9 0.027 € 24
P-202 A/B 15.5 0.045 € 39
P-203 A/B - 49 € 42,924
Total € 46,673
5.2.2. Heating
Conventional
A large energy consumer in this process is the reboiler. From Aspen Hysys the energy requirement is
calculated. The figure found there is 241.35 kW for heating. Assuming an efficiency of 90% for a gas
fired heater and a gas price of € 0.07 per kWh a total yearly cost of € 164,439 for natural is needed[36].
This figure can drop however as the natural gas coming from the flash can be used as a ”free” source
of natural gas.
Table 5.9: Heating duties for the conventional system
Name Type Power [kW] Price per year [€]
V-202 Gas fired 241.35 €164,439
Hybrid
In the hybrid system heating is done at two places. Firstly before the pervaporation membranes and
secondly in the reboiler section. It is chosen, for weight limiting reasons, to use heat exchange with
steam before the pervaporation. The amount of steam needed is calculated via the total flux needed.
A price of €25 per ton is assumed[51] [52]. The reboiler will still be heated using a gas fired heater.
Table 5.10: Heating duties for the hybrid system
Name Type Power [kW] Price per year [€]
E-204 Steam 61.31 € 23,257
V-202 Gas fired 35.56 € 37,595](https://image.slidesharecdn.com/10db86e5-b3a1-4553-b5bc-7c80961ebcd4-150915141925-lva1-app6892/85/CDP-FINAL-REPORT-62-320.jpg)
![5.2. OPEX 55
5.2.3. Cooling
Conventional
Table 5.11: Energy duties needed for cooling in conventional
Location Type Energy duty [kW] kg/h needed
E-203 Sea water cooler -103.5 8,988 kg/h seawater
C-201 TEG condenser -49.85 -
The condenser is cooled using the rich TEG before flash. By using this heat integration the heating
duty of the reboiler is lowered and this cooling can be performed for free. For the cooling of the lean
TEG before entering the absorption column sea water is used. As the process is done off shore this
water can be gained for free as well. The water needed is calculated using the method as described in
A.
Hybrid
Table 5.12: Energy duties needed for cooling in hybrid
Location Type Energy duty [kW] kg/h needed
E203 Sea water cooler -84.5 978.3 kg/h seawater
C201 TEG condenser -40.36 -
5.2.4. Conclusion regarding OPEX
Table 5.13: Total operational expenses
Type Expenses per year [€]
Conventional € 176,312
Hybrid € 107,525
As shown in Table 5.13 the total expenses towards energy are reduced. Yearly almost € 70,000 is
saved due to better energy use. The introduction of pervaporation membranes and the use of a split
flow has decreased the energy needed for the reboiler with 85%. Furthermore the introduction of a
liquid turbocharger and the overall lower TEG inventory has decreased the total kWh per year needed for
pumping of TEG with 70%. The addition of a vacuum pump at the pervaporation membranes however
has a relatively high duty in comparison with the other pumps of 49 kW needed. The introduction
of these new innovation has a positive effect on OPEX and total energy consumption making this a
greener alternative to the conventional process.](https://image.slidesharecdn.com/10db86e5-b3a1-4553-b5bc-7c80961ebcd4-150915141925-lva1-app6892/85/CDP-FINAL-REPORT-63-320.jpg)

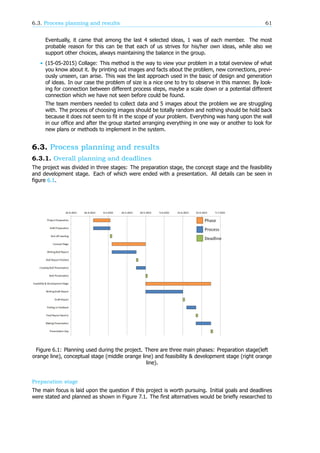

![List of Symbols
ΔP Pressure rise [kPa]
𝜌 Density of vapor [kg/m ]
𝜌 Density [kg/m ]
𝜌 Density liquid [kg/m ]
𝜏 residence time [hr]
A Surface [m ]
A Downcomer are [m ]
A Tower inside cross-sectional area [m ]
D external vessel diameter [inches]
D outside diameter [inches]
D Diameter of the tank [m]
E Fractional weld efficiency
E modulus of elasticity [psi]
F Liquid flowrate [kg/hr]
f*U Fraction of the vapor flooding velocity [m/s]
G Mass flow rate of gas [kg/s]
h Height [m]
L Length [m]
L vessel length [m]
L tangent-to-tangent height of the column[inches]
LMTD Log mean temperature difference [C]
P internal design pressure [psig]
P internal design pressure [psig]
q Heat duty [kJ/hr]
S maximum allowable stress of the shell material at design temperature [pounds/inch ]
S maximum allowable stress of the shell material at design temperature [pounds/inch ]
t Wall thickness of vessel [inches]
t Wall thickness of vessel [inches]
t Wall thickness of vessel [inches]
t Thickness to withstand seismic and wind
65](https://image.slidesharecdn.com/10db86e5-b3a1-4553-b5bc-7c80961ebcd4-150915141925-lva1-app6892/85/CDP-FINAL-REPORT-73-320.jpg)
![66 7. Conclusions & Recommendations
U Overall heat transfer coefficient [kJ/hr*m *C]
V Volume of vessel [m ]
wt% Weight percent](https://image.slidesharecdn.com/10db86e5-b3a1-4553-b5bc-7c80961ebcd4-150915141925-lva1-app6892/85/CDP-FINAL-REPORT-74-320.jpg)
![A
Unit sizing
In this appendix all different technique for size estimation are explained. To enhance readability ex-
ample calculations regarding the conventional process are included.
A.1. Contactor (C-101)
The contactor is sized using the method proposed in Seider et al[16]. Later it is checked using Aspen
Hysys simulations.
𝐷 = √
4 ∗ 𝐺
(𝑓𝑈 ) ∗ 𝜋 ∗ 𝜌
(A.1)
With:
G = Mass flow rate of gas [kg/s]
f*U = fraction of the vapor flooding velocity [m/s]
𝜌 = Density of vapor [kg/m ]
The vapor flooding velocity is calculated using the correlation proposed by Fair et al [53], which
was edited by Seider et al [16]. This results in a contactor diameter of 2.04 m. Aspen Hysys gives
an estimate of 2.3 meters. The height of packing coming from Aspen Hysys simulations is 3.5 meters.
For Mellapack ©packing from Sulzur Corp. the HETP is defined in the range of 0.5 to 0.7 meters[54].
Using 6 theoretical stages this results in a range of 2.1 to 4.2 meters of packing height. For this project
a packing height of 3 meters is used and a diameter of 2.3 meters. As the packing is assumed to be
25% of the contactor the total height is estimated to be 12 meters. The wall thickness t is calculated
to be 20 cm using the Sieder et al [16] method which uses equation A.3. In this equation the design
pressure is considered to be 1.1 times the operating pressure since the operating pressure is above
1000 psig. For vertical columns wind and seismic loads are to be taken into account,too. The thickness
of vessel required to withstand these effects have been calculated using the following equation[16]:
𝑡 =
0.22 ∗ (𝐷 + 18) ∗ 𝐿
𝑆 ∗ 𝐷
(A.2)
With:
D = external vessel diameter [inches]
t =Wall thickness of vessel [inches]
S = maximum allowable stress of the shell material at design temperature [pounds/inch ]
L = tangent-to-tangent height of the column[inches].
Where the term 18 ( in inches) accounts for the column cage ladders. This method assumes a wind
load based on the wind velocity of 140 miles/hr acting uniformly over the height of the column.
67](https://image.slidesharecdn.com/10db86e5-b3a1-4553-b5bc-7c80961ebcd4-150915141925-lva1-app6892/85/CDP-FINAL-REPORT-75-320.jpg)
![68 A. Unit sizing
The wall thickness to withstand pressure is calculated using the ASME pressure vessel code formula
[16]:
𝑡 =
𝑃 ∗ 𝐷
2 ∗ 𝑆 ∗ 𝐸 − 1.2 ∗ 𝑃
(A.3)
With:
P = internal design pressure [psig]
S = maximum allowable stress of the shell material at design temperature [pounds/inch ]
E = Fractional weld efficiency
With the following assumptions:
• For pressures between 0-5 psig, P has been taken to be 10psig.[16]
• For pressures between 10 psig to 1000 psig, the following equation has been used: P =
exp{0.60608+ 0.91615[ln(P )]+0.0015655[ln(P )] }[16]
• Maximum allowable stress of carbon steel has been taken to be 15000 pounds/inch [16]
• Minimum thickness has been assumed in all cases to be 6mm. [16]
The average vessel thickness t is calculated as the average of t and t +t as described in Seider
et al [16]. The t will be needed at the top of the vessel and t +t at the bottom. A linear gradient of
wall thickness is assumed.
A.2. Vessel sizing (V201, V202 & V203)
All vessel sizing is done via the Biegler-Grossman-Westerberg method [55]. Firstly the volume of the
drum is calculated using the following equation.
𝑉 = (
1
𝐿𝑖𝑞𝑢𝑖𝑑𝐹𝑟𝑎𝑐𝑡𝑖𝑜𝑛
) ∗ (
𝐹 ∗ 𝜏
𝜌
) (A.4)
With:
F = liquid flowrate [kg/hr] V =Volume of vessel [m ]
𝜏 = residence time [hr]
𝜌 = Density liquid [kg/m ]
With the following assumptions:
• For V-201 and V-203, the liquid fraction has been assumed to be 0.8, whereas that for V-202 the
same has been considered to be 0.5.
• The residence times for vessels V-201,202 and 203 have been taken as 10, 5 and 20 min respec-
tively.
• The flowrates and the densities for the respective streams have been taken from Aspen Hysys.
See Appendix C.
Which gives the following results for the surge, flash & reboiler.
The aspect ratio, is assumed to be 4 as described in Biegler et al [55].
Which gives the following results for the flash, reboiler & surge.](https://image.slidesharecdn.com/10db86e5-b3a1-4553-b5bc-7c80961ebcd4-150915141925-lva1-app6892/85/CDP-FINAL-REPORT-76-320.jpg)
![A.3. Heat exchangers (E-201,202 & 203) 69
Table A.1: Vessel volumes
Vessel Volume [m ] Diameter [m] Length [m]
V-201 0.535 0.554 2.217
V-202 0.465 0.529 2.117
V-203 1.16 0.719 2.875
Vessel Wall thickness [mm]
V-201 6
V-202 6
V-203 6
Table A.2: Thickness of the wall of all different Vessels
A.3. Heat exchangers (E-201,202 & 203)
Aspen Hysys simulations were used to get the total surface area needed for the heat exchangers E-201
& E-202. Calculation of area of Sea-Water Cooler E-203 was done manually as follows:
• The heat duty was taken from Hysys simulations which is 3.726·10 kJ/h.
• The water inlet and outlet were assumed to be at 10 °C and 20 °C respectively.The approach of
10°C has been been taken from a cooling tower vendor website [56]
• Accordingly, the flow if sea-water required was calculated to be 8898.9 kg/hr (Heat Capacity of
sea-water is assumed 4.187 kJ/(kg°C))[9]
• The inlet and oulet temperatures for the lean TEG solution were taken from Hysys, which are
81.85 °C and 33.85°C respectively.
• The log-mean-temperature difference for counter-current heat-exchange was thus calculated to
be 39.87 °C.
• The overall heat-transfer coefficient was conservatively assumed to be 150 W/(m .K) [57]
• Accordingly, the area required for this heat exchanger was calculated to be 17.3 m .
Which is used in the following equations:
𝑞 = 𝑈 ∗ 𝐴 ∗ 𝐿𝑀𝑇𝐷[58] (A.5)
𝐿𝑀𝑇𝐷 =
Δ𝑇 − Δ𝑇
𝑙𝑛( )
[58] (A.6)
The results are displayed in table A.3.
Heat exchanger Surface area [m ]
E-201 28.45
E-202 147.0
E-203 17.3
Table A.3: Total surface area needed per heat exchanger](https://image.slidesharecdn.com/10db86e5-b3a1-4553-b5bc-7c80961ebcd4-150915141925-lva1-app6892/85/CDP-FINAL-REPORT-77-320.jpg)
![70 A. Unit sizing
A.4. Still Column (C-201)
The still column has been sized using following the method given in [16]. The equation used is:
𝐷 = √
4 ∗ 𝐺
(𝑓𝑈 ) ∗ (1 − )𝜋 ∗ 𝜌
(A.7)
With:
A = Downcomer area,
A = Tower inside cross-sectional area,
The fraction A /A is calculated as per the following equations:
𝐴
𝐴
= 0.1 (A.8)
if F , the gas flooding velocity <= 0.1
𝐴
𝐴
= 0.1 +
𝐹 − 0.1
9
(A.9)
if 0.1<= F <= 1.0 &
𝐴
𝐴
= 2 (A.10)
if F >= 1.0. This results in Still Column Diameter of 0.277 m or 27.7 cm and height of 6.5 m (which
includes tray spacing height, height for disengagement at the top and height of holdup of 5min at the
bottom assuming it is not mounted directly on reboiler).
The wall thickness for the still column has been calculated on the same lines as that of the contactor,
but by using criteria of lower operating pressures. The average column thickness is thus estimated to
be 10 mm.
A.5. Pumps (P-101 A/B and 202 A/B)
The head requirement for individual pump was calculated by using the Hydrostatic Equation:
Δ𝑃 = ℎ ∗ 𝜌 ∗ 𝑔[59] (A.11)
With:
Δ P = Pressure rise in the pump[kPa],
h = height of liquid column [m],
𝜌 =density of the liquid [kg/m ].
The power requirement for the two- pumps was obtained as a result of Hysys simulation.
Finally, all of this has been tabulated in table A.4:
Pump Head [mlc] Power [kW]
P-101A/B 1370 13.4
P-202A/B 20 0.155
Table A.4: Power requirement per pump
A.6. Pervaporation membrane module (S-202)
The pervaporation membrane module sizing will be based on the commercial PVM-094 SS 316 7×4-tube
(120cm) from Pervatech shown in the figure A.1, which displays the dimensions of it in the image.
As mentioned in the figure A.1, the diameter of a module with 7 elements of 25 mm diame-
ter each is totally 0.1143 m (114.3 mm). Therefore, the circular area of the vessel tube is around](https://image.slidesharecdn.com/10db86e5-b3a1-4553-b5bc-7c80961ebcd4-150915141925-lva1-app6892/85/CDP-FINAL-REPORT-78-320.jpg)
![A.6. Pervaporation membrane module (S-202) 71
(pi/4)·0.1143 =0.01 m . Hence, if there are 7 elements, each element (plus the space needed sur-
rounding it for the water vapour flow) is 0.01/7=0.0014 m .
In our case, it is required a number of 37 elements per module, so 0.0014·37=0.053 m of circular
surface, which transformed into diameter is 0.260 m (260mm) of vessel tube.
Then, as stated in table 3.5, 509 m are needed. The module designed will provide 3.7 m of
effective membrane are, representing 509 / 3.7 = 138 modules. It is assumed that there is no especial
requirements for the space such as a particular length or height. Hence, it was selected a rectangular
14x10 modules disposition in parallel. As we only need 138 modules, there is space for 2 more modules.
The separation between modules is calculated as follows. The figure A.1 shows that for a PVM-094
SS 316 7×4-tube module the height is 100 mm from the center of the tube. From those 100 mm, we
subtract 114.3 / 2 = 57.15 mm of radius, leading to 42.85 mm of height taken from the outer part of
the vessel circumference until the highest point of the tube to be added to the diameter. Therefore,
260 mm + 42.85 mm = 302.85 mm, around 0.302 m of actual diameter of flange. If 14 modules are
set in parallel, the total width is 14 · 0.302 = 4.24 m. However, a security factor of 50% is taken in
order to count the pipes needed between modules for the vapour flow as well as maintenance duties,
resulting in 6.36 m, which is normalized to 7 m width.
For the height, we have 10 modules in parallel resulting in 10 · 0.302 = 3.02 m. Following the same
reasoning, the security factor of 50% is taken. The total height is 4.53 m, which is normalized to 5 m.
Furthermore, the length will be taken as equal due to the fact that the membrane length and type
is the same (silica membrane of 120 cm) as in the PVM-094 SS 316 7×4-tube module. Hence, the
length will be 1.405 m.
Figure A.1: Dimensions of PVM-094 SS 316 7×4-tube (120cm) from Pervatech.
The thickness required for each module is sized using the method proposed in Seider et al [16],
considering that each module is an empty cylindrical vessel of SS 316 of 0.260 m diameter.
Due to the fact that thickness should be sufficiently big to withstand the vacuum collapsing pressure,
Mulet et. al presented a method for computing the necessary wall thickness t , based in the vessel
length-to-outside diameter ratio.](https://image.slidesharecdn.com/10db86e5-b3a1-4553-b5bc-7c80961ebcd4-150915141925-lva1-app6892/85/CDP-FINAL-REPORT-79-320.jpg)
![72 A. Unit sizing
𝑡 = 1.3 ∗ 𝐷 (
𝑃 ∗ 𝐿
𝐸 ∗ 𝐷
) .
(A.12)
With:
D = outside diameter [inches]
E = modulus of elasticity [psi], 27.6·10 for SS 316. [60]
P = internal design pressure [psig] for operating pressures between 0 and 5, 10 psig should be taken
[16]. L = vessel length [inches]
However, to the value of t the following correction, t must be added
𝑡 = 𝐿 ∗ (0.18 ∗ 𝐷 − 2.2) ∗ 10 − 0.19 (A.13)
Therefore, the total thickness for a vacuum vessel is
𝑡 = 𝑡 + 𝑡 (A.14)
The results are displayed in table A.5.
Table A.5: Results for thickness pervaporation module vessel calculation
Type t [mm] t 𝐶 [mm] t [mm]
Vessel 1.4 4.6 6.0](https://image.slidesharecdn.com/10db86e5-b3a1-4553-b5bc-7c80961ebcd4-150915141925-lva1-app6892/85/CDP-FINAL-REPORT-80-320.jpg)

![74 B. Used graphs
The incoming lean TEG is assumed to be in equilibrium with the outgoing dry gas. This graph, there-
fore, provides the minimum concentration of lean TEG required for dehydration when the Contactor
temperature (which is inlet gas temperature assuming the contactor to be isothermal) and Equilibrium
water dew point of gas obtainable at temperature is known.
Figure B.1: Equilibrium Water Dew Point in °C versus Inlet Gas Temperature [15]](https://image.slidesharecdn.com/10db86e5-b3a1-4553-b5bc-7c80961ebcd4-150915141925-lva1-app6892/85/CDP-FINAL-REPORT-82-320.jpg)
![75
From the water content of the outgoing dehydrated gas, its dew point at the contactor temperature
and pressure is calculated using this graph. A conservative approach of about 8.5 °C [15]is subtracted
from the dew point estimated from the graph.
Figure B.2: Water Content of Sweet Natural Gas , kg/(10 std m ) (100 kPa and 15 °C) vs Water Dew
point in °C [15]](https://image.slidesharecdn.com/10db86e5-b3a1-4553-b5bc-7c80961ebcd4-150915141925-lva1-app6892/85/CDP-FINAL-REPORT-83-320.jpg)


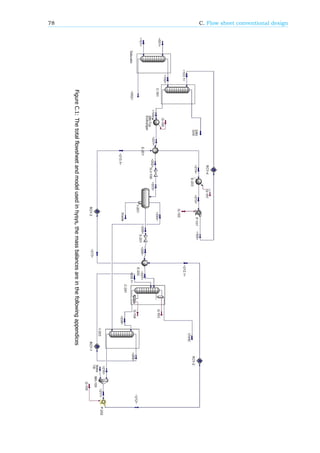
![D
Stream Summary - Conventional
Design Case
Table D.1: Stream Summary - Conventional Design
Name <001> <002> <101> <102> <103> <104> DRY GAS
Vapour Fraction 0 0 1 1 0 0 1
Temperature [C] 35 35 35 35 35 35 35
Pressure [bar] 157 157 157 157 157 157 156
Molar Flow [kgmole/h] 555090 556744 19438 17784 18 26 17776
Mass Flow [kg/h] 9999999 10043330 380657 337325 2594 2717 337203
Liq Volume Flow [m3/h] 10020 10110 1112 1022 2 2 1021
Heat Flow [kJ/h] (*10^5) -158126,43 -158436,62 -1783,75 -1473,70 -14,23 -16,23 -1471,69
Name <201> <202> <203> <204> Waste <205> <206>
Vapour Fraction 0 0 1,56E-02 1 0 0 1,99E-04
Temperature [C] 55 94 98 98 98 98 98
Pressure [bar] 156 156 4 4 4 4 3
Molar Flow [kgmole/h] 26 26 26 0 0 25 25
Mass Flow [kg/h] 2717 2717 2717 10 0 2707 2707
Liq Volume Flow [m3/h] 2 2 2 0 0 2 2
Heat Flow [kJ/h] -16,07 -15,75 -15,75 -0,05 0,00 -15,70 -15,70
Name <207> <208> <209> <210> <211> <212> <213>
Vapour Fraction 0 0 1 0 0 0 0
Temperature [C] 170 204 201 201 199 199 123
Pressure [bar] 3 1 1 1 1 3 2
Molar Flow [kgmole/h] 25 19 1 18 18 18 18
Mass Flow [kg/h] 2707 2587 30 2567 2592 2592 2594
Liq Volume Flow [m3/h] 2 2 0 2 2 2 2
Heat Flow [kJ/h] -15,10 -13,01 -0,22 -12,84 -12,97 -12,97 -13,59
Name <214> <215> Make Up OVHD
Vapour Fraction 0 0 0 1
Temperature [C] 82 34 35 98
Pressure [bar] 2 1 1 1
Molar Flow [kgmole/h] 18 18 0 8
Mass Flow [kg/h] 2594 2594 24 149
Liq Volume Flow [m3/h] 2 2 0 0
Heat Flow [kJ/h] -13,91 -14,28 -0,13 -1,80
79](https://image.slidesharecdn.com/10db86e5-b3a1-4553-b5bc-7c80961ebcd4-150915141925-lva1-app6892/85/CDP-FINAL-REPORT-87-320.jpg)
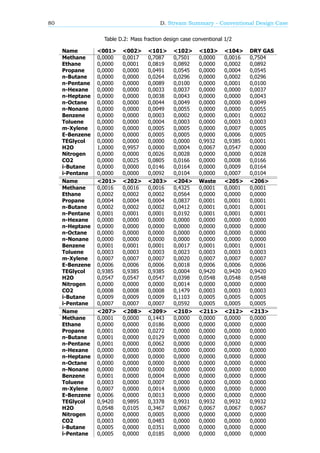


![E
Stream Summary - Turndown Case
Table E.1: Stream summary turndown case hybrid
Name <001> <002> <101> <102> <103> <104> DRY GAS
Vapour Fraction 0 0 1 1 0 0 1
Temperature [C] 35 35 35 35 32 35 35
Pressure [bar] 157 157 157 157 157 157 156
Molar Flow [kgmole/h] 55509 55674 1944 1778 6 7 1777
Mass Flow [kg/h] 1000000 1004333 38062 33729 877 897 33709
Liquid Volume Flow [m3/h] 1002 1011 111 102 1 1 102
Heat Flow [kJ/h] [*10^5] -158126,45 -158437,17 -1783,58 -1473,56 -48,10 -50,29 -1471,37
Name <201> <202> <203> <204> WASTE <205> <206>
Vapour Fraction 0 0 0 1 0 0 0
Temperature [C] 55 92 96 96 96 96 96
Pressure [bar] 156 156 4 4 4 4 3
Molar Flow [kgmole/h] 7 7 7 0 0 7 7
Mass Flow [kg/h] 897 897 897 6 0 891 891
Liquid Volume Flow [m3/h] 1 1 1 0 0 1 1
Heat Flow [kJ/h] [*10^5] -49,75 -48,77 -48,77 -0,25 0,00 -48,52 -48,52
Name <207> <208> <209> <210> <211> <212> <213>
Vapour Fraction 0 0 1 0 0 0 0
Temperature [C] 176 204 199 199 198 198 117
Pressure [bar] 3 1 1 1 1 3 2
Molar Flow [kgmole/h] 7 6 1 6 6 6 6
Mass Flow [kg/h] 891 884 15 875 882 882 877
Liquid Volume Flow [m3/h] 1 1 0 1 1 1 1
Heat Flow [kJ/h] [*10^5] -46,35 -44,42 -1,01 -43,66 -44,06 -44,06 -46,00
Name <214> <215> MAKE UP OVHD
Vapour Fraction 0 0 0 1
Temperature [C] 80 31 35 90
Pressure [bar] 2 2 1 1
Molar Flow [kgmole/h] 6 6 0 1
Mass Flow [kg/h] 877 877 7 22
Liquid Volume Flow [m3/h] 1 1 0 0
Heat Flow [kJ/h] [*10^5] -46,98 -48,27 -0,40 -2,04
83](https://image.slidesharecdn.com/10db86e5-b3a1-4553-b5bc-7c80961ebcd4-150915141925-lva1-app6892/85/CDP-FINAL-REPORT-91-320.jpg)
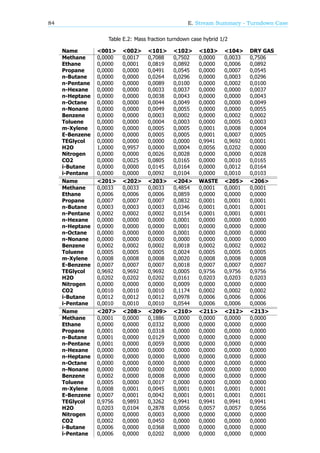
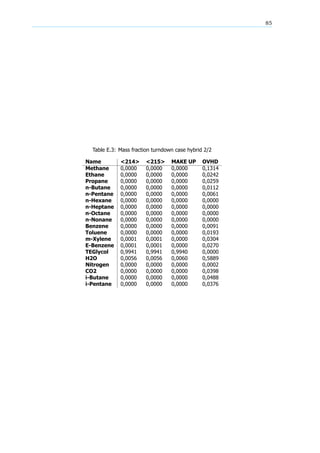

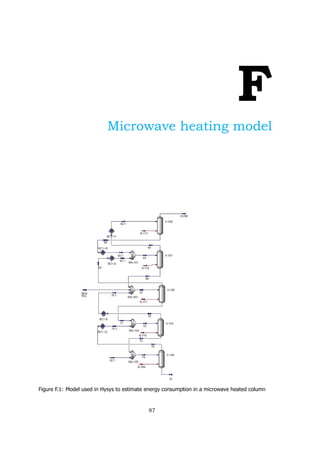


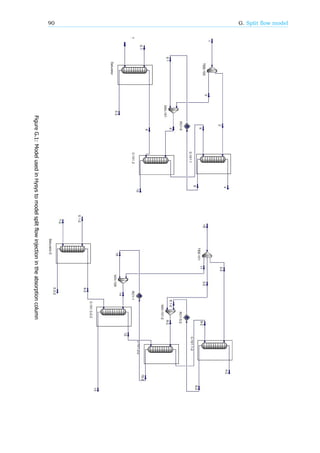

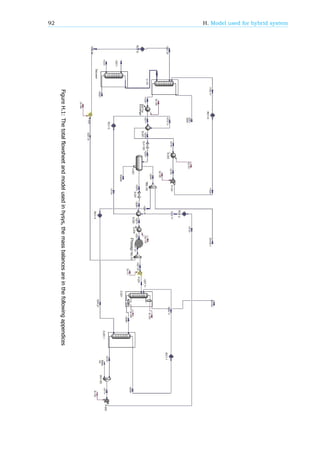

![94 I. Stream Summary - Hybrid: Design Flow
Table I.1: Stream summary design case hybrid
Name <102> DRY GAS <104> <201> <202> <204>
Vapour Fraction 1,0000 1,0000 0,0000 0,0000 0,0000 1,0000
Temperature [C] 35 36 35 36 38 42
Pressure [bar] 157 156 157 156 156 4
Molar Flow [kgmole/h] 17784 17777 18 18 18 0
Mass Flow [kg/h] 337306 337197 1660 1660 1660 3
Liq Volume Flow [m3/h] 1022 1021 1 1 1 0
Heat Flow [kJ/h] -1,47E+09 -1,47E+09 -1,04E+07 -1,04E+07 -1,04E+07 -1,53E+04
Name Waste <205> <203> <206> <207> OVHD
Vapour Fraction 0,0000 0 8,14E-03 9,35E-05 4,14E-04 1
Temperature [C] 42 42 42 42 108 70
Pressure [bar] 4 4 4 3 3 1
Molar Flow [kgmole/h] 0 18 18 18 18 0
Mass Flow [kg/h] 0 1657 1660 1657 1657 3
Liq Volume Flow [m3/h] 0 1 1 1 1 0
Heat Flow [kJ/h] 0,00E+00 -1,04E+07 -1,04E+07 -1,04E+07 -1,01E+07 -1,54E+04
Name <208> <209> <210> <213> <212> Make Up
Vapour Fraction 0,0000 1,0000 0,0000 0,0000 0,0000 0,0000
Temperature [C] 204 203 203 57 198 35
Pressure [bar] 1 1 1 2 3 1
Molar Flow [kgmole/h] 5 0 5 5 5 0
Mass Flow [kg/h] 763 3 761 786 785 24
Liq Volume Flow [m3/h] 1 0 1 1 1 0
Heat Flow [kJ/h] -3,81E+06 -1,84E+04 -3,79E+06 -4,27E+06 -3,93E+06 -1,33E+05
Name <211> <214> <215> <103> <204.2> OVHD-1
Vapour Fraction 0,0000 0 0 0 1 1
Temperature [C] 198 52 35 37 42 42
Pressure [bar] 1 2 2 156 4 4
Molar Flow [kgmole/h] 5 5 5 5 0 0
Mass Flow [kg/h] 785 786 786 786 1 3
Liq Volume Flow [m3/h] 1 1 1 1 0 0
Heat Flow [kJ/h] -3,93E+06 -4,28E+06 -4,32E+06 -4,30E+06 -3,07E+03 -1,23E+04
Name <101> <207.1> <207.2> <207.3> <207.4> <207.5>
Vapour Fraction 1,0000 0,0048 0,0056 5,64E-03 0,0000 0,0000
Temperature [C] 35 150 150 150 159 159
Pressure [bar] 157 3 2 2 157 157
Molar Flow [kgmole/h] 19438 18 11 5 5 5
Mass Flow [kg/h] 380629 1657 1527 764 764 765
Liq Volume Flow [m3/h] 1112 1 1 1 1 1
Heat Flow [kJ/h] -1,78E+09 -9,86E+06 -7,86E+06 -3,93E+06 -3,90E+06 -3,91E+06
Name <207.6> <207.7>
Vapour Fraction 5,64E-03 4,75E-03
Temperature [C] 150 150
Pressure [bar] 2 2
Molar Flow [kgmole/h] 5 5
Mass Flow [kg/h] 764 764
Liq Volume Flow [m3/h] 1 1
Heat Flow [kJ/h] -3,93E+06 -3,93E+06](https://image.slidesharecdn.com/10db86e5-b3a1-4553-b5bc-7c80961ebcd4-150915141925-lva1-app6892/85/CDP-FINAL-REPORT-102-320.jpg)
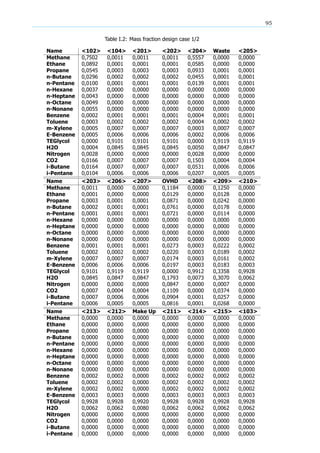
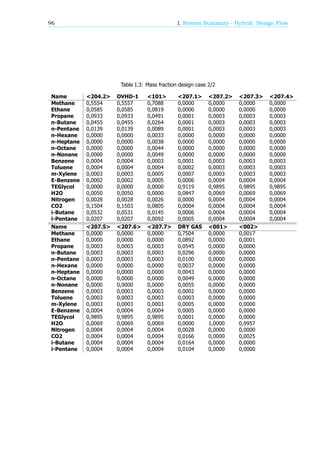

![98 J. Stream Summary - Hybrid: Turndown Case
Table J.1: Stream summary hybrid system turndown case
Name <102> Dry Gas <104> <201> <202> <204>
Vapour Fraction 1,0000 1,0000 0,0000 0,0000 0,0000 1,0000
Temperature [C] 35 37 35 36 41 45
Pressure [bar] 157 156 157 156 156 4
Molar Flow [kgmole/h] 755 755 4 4 4 0
Mass Flow [kg/h] 16189 16183 452 452 452 3
Liq Volume Flow [m3/h] 46 46 0 0 0 0
Heat Flow [kJ/h] -6,39E+07 -6,38E+07 -2,53E+06 -2,53E+06 -2,52E+06 -9,80E+03
Name Waste <205> <203> <206> <207> OVHD
Vapour Fraction 0 0 3,34E-02 3,84E-04 1,51E-03 1
Temperature [C] 45 45 45 45 121 35
Pressure [bar] 4 4 4 3 2,994208 1
Molar Flow [kgmole/h] 0 3 4 3 3 0
Mass Flow [kg/h] 0 449 452 449 449 1
Liq Volume Flow [m3/h] 0 0 0 0 0 0
Heat Flow [kJ/h] 0,00E+00 -2,51E+06 -2,52E+06 -2,51E+06 -2,41E+06 -2,13E+03
Name <208> <209> <210> Make Up <211> <212>
Vapour Fraction 0,0000 1 0,00E+00 0,00E+00 4,33E-04 0
Temperature [C] 204 204 204 35 203 203
Pressure [bar] 1 1 1 1 1 3
Molar Flow [kgmole/h] 2 0 2 0 2 2
Mass Flow [kg/h] 221 0 221 2 223 223
Liq Volume Flow [m3/h] 0 0 0 0 0 0
Heat Flow [kJ/h] -1,10E+06 -1,90E-02 -1,10E+06 -1,10E+04 -1,11E+06 -1,11E+06
Name <204.1> <101> <103> <213> <214> <215>
Vapour Fraction 1,0000 1,0000 0 0 0 0
Temperature [C] 45 35 37 51 41 35
Pressure [bar] 4 157 156 2 2 1
Molar Flow [kgmole/h] 0 1944 2 2 2 2
Mass Flow [kg/h] 0 38063 223 223 223 223
Liq Volume Flow [m3/h] 0 111 0 0 0 0
Heat Flow [kJ/h] 0,00E+00 -1,78E+08 -1,22E+06 -1,21E+06 -1,22E+06 -1,23E+06
Name <204.2> <OVHD-1> <207.1> <207.2> <207.3> <207.4>
Vapour Fraction 1 1 3,84E-03 1,19E-02 1,19E-02 0,0000
Temperature [C] 45 45 146 150 150 166
Pressure [bar] 4 4 2 2 2 157
Molar Flow [kgmole/h] 0 0 3 3 2 2
Mass Flow [kg/h] 0 3 449 444 222 222
Liq Volume Flow [m3/h] 0 0 0 0 0 0
Heat Flow [kJ/h] 0,00E+00 -9,80E+03 -2,38E+06 -2,28E+06 -1,14E+06 -1,13E+06
Name <207.5> <207.6> <207.7>
Vapour Fraction 0,0000 1,19E-02 1,06E-02
Temperature [C] 166 150 150
Pressure [bar] 157 2 2
Molar Flow [kgmole/h] 2 2 2
Mass Flow [kg/h] 223 222 222
Liq Volume Flow [m3/h] 0 0 0
Heat Flow [kJ/h] -1,13E+06 -1,14E+06 -1,14E+06](https://image.slidesharecdn.com/10db86e5-b3a1-4553-b5bc-7c80961ebcd4-150915141925-lva1-app6892/85/CDP-FINAL-REPORT-106-320.jpg)
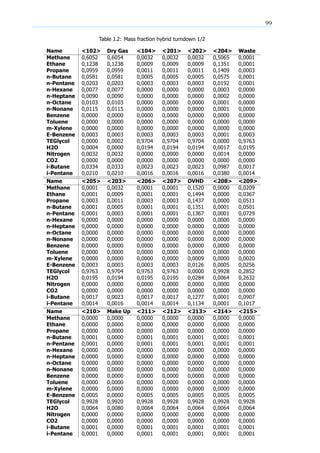
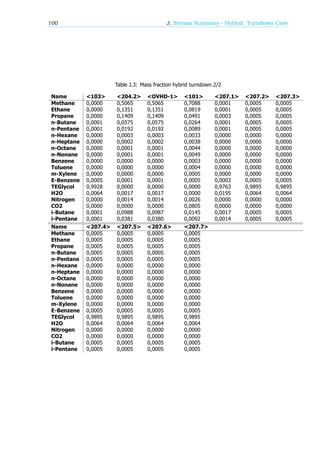
![102 K. Stream Summary - Hybrid: Max Flow Case
Table K.1: Stream summary max flow case hybrid
Name Dry Gas <104> <201> <202> <204> Waste
Vapour Fraction 1,0000 0,0000 0,0000 0,0000 1,0000 0,0000
Temperature [C] 36 35 36 41 45 45
Pressure [bar] 156 157 156 156 4 4
Molar Flow [kgmole/h] 21664 22 22 22 0 0
Mass Flow [kg/h] 413320 2042 2042 2042 5 0
Liq Volume Flow [m3/h] 1244 2 2 2 0 0
Heat Flow [kJ/h] -1,83E+09 -1,28E+07 -1,28E+07 -1,28E+07 -2,46E+04 0,00E+00
Name <205> <203> <206> <207> OVHD <208>
Vapour Fraction 0,0000 8,95E-03 1,06E-04 8,37E-04 1 0
Temperature [C] 45 45 45 115 70 204
Pressure [bar] 4 4 3 3 1 1
Molar Flow [kgmole/h] 22 22 22 22 0 7
Mass Flow [kg/h] 2038 2042 2038 2038 4 937
Liq Volume Flow [m3/h] 2 2 2 2 0 1
Heat Flow [kJ/h] -1,28E+07 -1,28E+07 -1,28E+07 -1,23E+07 -2,06E+04 -4,67E+06
Name <209> <210> <211> Make up <212> <213>
Vapour Fraction 1,0000 0,0000 0,0000 0,0000 0,0000 0,0000
Temperature [C] 203 203 197 35 197 47
Pressure [bar] 1 1 1 157 3 2
Molar Flow [kgmole/h] 0 6 7 0 7 7
Mass Flow [kg/h] 4 935 974 39 974 974
Liq Volume Flow [m3/h] 0 1 1 0 1 1
Heat Flow [kJ/h] -2,32E+04 -4,65E+06 -4,87E+06 -2,14E+05 -4,87E+06 -5,31E+06
Name <214> <215> <103> <204.2> OVHD-1 <101>
Vapour Fraction 0,0000 0 0 1 1 1,0000
Temperature [C] 37 19 20 45 45 35
Pressure [bar] 2 1 156 4 4 157
Molar Flow [kgmole/h] 7 7 7 0 0 23325
Mass Flow [kg/h] 974 974 974 1 4 456755
Liq Volume Flow [m3/h] 1 1 1 0 0 1334
Heat Flow [kJ/h] -5,34E+06 -5,39E+06 -5,37E+06 -4,92E+03 -1,97E+04 -2,14E+09
Name <102> <207.1> <207.2> <207.3> <207.4> <207.5>
Vapour Fraction 1,0000 0,0053 0,0034 0,0034 0,0000 0
Temperature [C] 35 143 150 150 156 156
Pressure [bar] 157 2 2 2 157 157
Molar Flow [kgmole/h] 21673 22 13 7 7 7
Mass Flow [kg/h] 413455 2038 1876 938 938 934
Liq Volume Flow [m3/h] 1244 2 2 1 1 1
Heat Flow [kJ/h] -1,83E+09 -1,22E+07 -9,64E+06 -4,82E+06 -4,79E+06 -4,77E+06
Name <207.6> <207.7>
Vapour Fraction 0,0034 1,98E-03
Temperature [C] 150 150
Pressure [bar] 2 2
Molar Flow [kgmole/h] 7 7
Mass Flow [kg/h] 938 938
Liq Volume Flow [m3/h] 1 1
Heat Flow [kJ/h] -4,82E+06 -4,82E+06](https://image.slidesharecdn.com/10db86e5-b3a1-4553-b5bc-7c80961ebcd4-150915141925-lva1-app6892/85/CDP-FINAL-REPORT-110-320.jpg)
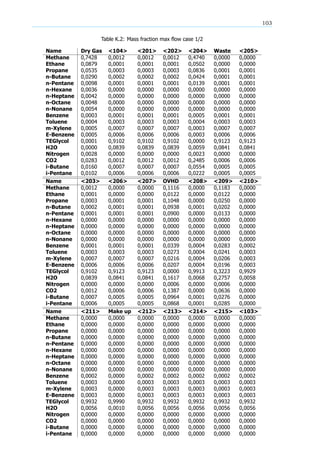
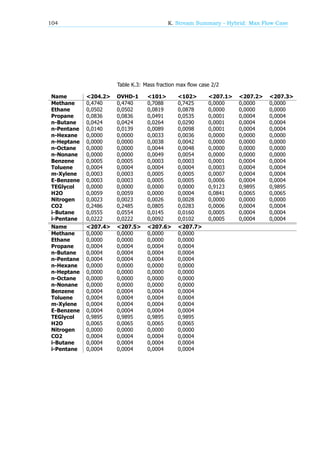
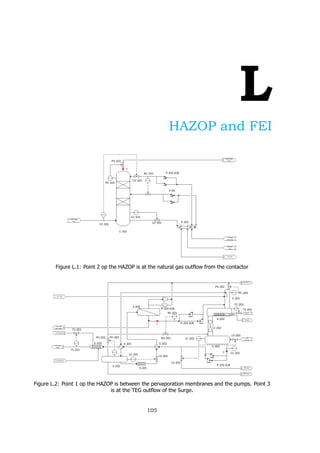
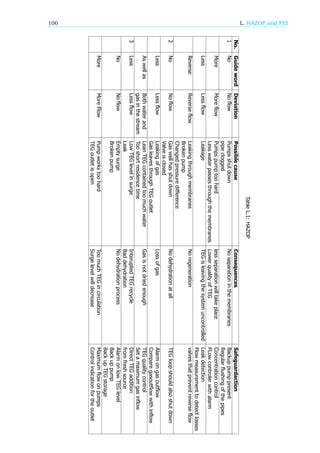
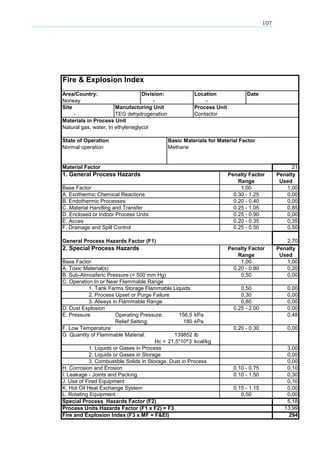


![REACTORS, COLUMNS & VESSELS – SUMMARY
EQUIPMENT NR. :
NAME :
C-101
Contactor :
C-201
Still Column :
C-202
Stripping
Column :
V-201
Flash Vessel :
V-202
Reboiler
Packed
Column
Tray Column Packed
Column
Horizontal Horizontal
Pressure [bara] : 156.25/156.5 1/1.1 1.1 4.5 1.1
Temp. [o
C] : 35 70.3/204 204 42 204
Volume [m3
] :
Diameter [m] :
L or H [m] :
2.04
12.2
0.15
6
0.25
0.5
0.31 (1)
0.46
1.85
0.14 (2)
0.35
1.4
Internals
- Tray Type :
- Tray Number :
- Fixed Packing
Type :
Shape :
- Catalyst
Type :
Shape :
-
-
-
n.a.
n.a.
Mellapack.
n.a.
n.a.
n.a.
Sieve Tray
2
n.a.
n.a.
n.a.
n.a.
n.a.
n.a.
Mellapack
n.a.
n.a.
n.a.
n.a.
n.a.
n.a.
n.a.
n.a.
n.a.
n.a.
n.a.
n.a.
n.a.
n.a.
n.a.
Gas Fired
Number
- Series :
- Parallel :
1
-
1
-
1
-
1
-
1
-
Materials of
Construction (3) :
Column: SS Column: CS
Tray: SS
Column: CS CS Shell: CS
Tubes:
CS/Inconel
Other :](https://image.slidesharecdn.com/10db86e5-b3a1-4553-b5bc-7c80961ebcd4-150915141925-lva1-app6892/85/CDP-FINAL-REPORT-118-320.jpg)
![REACTORS, COLUMNS & VESSELS – SUMMARY
EQUIPMENT NR. :
NAME :
V-203
Surge Vessel :
S-201 A/B
Filter
S-202
Pervaporation
(3)
Horizontal In Line Horizontal
Pressure [bara] : 1 4.5/3.5 (4)
Temp. [o
C] : 202 42 150
Volume [m3
] :
Diameter [m] :
L or H [m] :
0.34 (1)
0.48
1.9
-
0.0254
-
0.074
0.26
1.402
Internals
- Tray Type :
- Tray Number :
- Fixed Packing
Type :
Shape :
- Catalyst
Type :
Shape :
- Tubes
Type :
- Type
-
n.a.
n.a.
n.a.
n.a.
n.a.
n.a.
n.a.
n.a.
n.a.
n.a.
n.a.
n.a.
Inline Strainer
n.a.
n.a.
n.a.
n.a.
n.a.
n.a.
Number
- Series :
- Parallel :
1
-
1
-
-
138
Materials of
Construction (2) :
CS SS SS
Other :
Remarks:
(1) SS = Stainless Steel; CS = Carbon Steel
(2) V-203: For residence time of 20 min and 80% liquid filled.
(3) Data for pervaporation membrane module only.
(4) 3 bar in feed, 20 mbar in permeate side and 1.5 bar in retentate.
Designers : Project ID-Number : CPD3425
Date : June 2015](https://image.slidesharecdn.com/10db86e5-b3a1-4553-b5bc-7c80961ebcd4-150915141925-lva1-app6892/85/CDP-FINAL-REPORT-120-320.jpg)
![HEAT EXCHANGERS & FURNACES – SUMMARY
EQUIPMENT NR. :
NAME :
E-201
Glycol/Glycol
Preheater :
E-202
Glycol/Glycol
Heater :
E-203
Sea-Water
Cooler :
E-204
Pervaporation
Heater
Shell and
Tube
Shell and
Tube
Shell and Tube Shell and Tube
Substance
- Tubes :
- Shell :
Rich TEG
Lean TEG
Rich TEG
Lean TEG
Cooling Water.
Lean TEG
Rich TEG
LP Steam
Duty [kW] : 2.8 93.36 11.37 61.31
Heat Exchange
area [m2
] : 4.24 (1) 24.35(1) 2.6(1) 2.44(1)
Number
- Series :
- Parallel : :
1
-
1
-
1
-
1
-
Pressure [bara]
- Tubes :
- Shell :
5
2.5
3.5
2.5
4
2
3
6.5
Temperature
In / Out [o
C]
- Tubes :
- Shell :
36 / 38
57 / 52
42 / 107.8
198/ 57
10/20
53 / 35
107.8/150
162
Special Materials of
Construction (2) :
Tubes : CS
Shell : CS
Tubes : CS
Shell : CS
Tubes : CS
Shell : CS
Tubes : CS
Shell : CS
Other :
Remarks:
(1) Bare tube surface.
(2) CS = Carbon Steel;
Designers : Project ID-Number : CPD3425
Date : June 2015](https://image.slidesharecdn.com/10db86e5-b3a1-4553-b5bc-7c80961ebcd4-150915141925-lva1-app6892/85/CDP-FINAL-REPORT-121-320.jpg)
![PUMPS, BLOWERS & COMPRESSORS – SUMMARY
EQUIPMENT NR. :
NAME :
P-101
Turbocharger
P-102 A/B
High
Pressure
Pump
P-103 A/B
Semi-Lean
Injection
Pump :
P-201 A/B
Intermediate
Pump :
P-202 A/B
Booster
Pump
Type :
Number :
-
1
Centrifugal
2
Centrifugal
2
Centrifugal
2
Centrifugal
2
Medium
transferred : Rich TEG / Lean
TEG/Semi-Lean
TEG
Lean TEG Semi-Lean
TEG
Semi-Lean
TEG
Lean TEG
Capacity
[kg/s] :
[m3
/h] : 2.5/0.8/0.7 0.8 0.7 1.2 0.8
Density [kg/m3
] : 705.1/1133/1042 1133 1042 636.3 969.6
Pressure [bara]
Suct. / Disch. : (156.5-4.5)
&(1.5-78)&
(1.5-77.5)
78 / 156.5 1.1/156.5 1.5/2 1/2.5
Temperature
In / Out [o
C] : 42/37/160 36/37 150/160 150/150 198
Power [kW]
- Theor. :
- Actual : 2.04 2.17 0.027 0.045
Number
- Theor. :
- Actual : 1 2 (1) 2 (1) 2 (1) 2(1)
Special Materials of
Construction : SS 316 SS 316 SS 316 SS 316 SS 316
Other : Double
mechanical seals
Double
mechanical
seals
Double
mechanical
seals
Double
mechanical
seals
Double
mechanical
seals
Remarks:
(1) One installed spare included.
Designers : Project ID-Number : CPD3425
Date : June 2015](https://image.slidesharecdn.com/10db86e5-b3a1-4553-b5bc-7c80961ebcd4-150915141925-lva1-app6892/85/CDP-FINAL-REPORT-122-320.jpg)
![PUMPS, BLOWERS & COMPRESSORS – SUMMARY
EQUIPMENT NR. :
NAME :
P-203 A/B
Vacuum Pump
Type :
Number :
-
1
Medium
transferred : Water Vapour
Capacity
[kg/s] :
[m3
/h] : 252.3
Density [kg/m3
] : 1
Pressure [bara]
Suct. / Disch. : 0.02/1
Temperature
In / Out [o
C] : 150/150
Power [kW]
- Theor. :
- Actual : 49
Number
- Theor. :
- Actual : 2 (1)
Special Materials of
Construction : SS 316
Other : Double
mechanical seals
Remarks:
(1) One installed spare included.
Designers : Project ID-Number : CPD3425
Date : June 2015](https://image.slidesharecdn.com/10db86e5-b3a1-4553-b5bc-7c80961ebcd4-150915141925-lva1-app6892/85/CDP-FINAL-REPORT-123-320.jpg)
![COLUMN – SPECIFICATION SHEET
EQUIPMENT NUMBER : C-101
NAME : Contactor
General Data
Service : - distillation / extraction / absorption /
Column Type : - packed / tray / spray /
Tray Type : - cap / sieve / valve /
Tray Number (1)
- Theoretical : 6
- Actual : -
- Feed (actual) : Top and Middle (1st
and 4th
theoretical trays)
Tray Distance (HETP) [m] : 0.61 Tray Material : SS314 (2)
Column Diameter [m] : 2.04 Column Material : SS (2)
Column Height [m] : 12.2
Heating : - none / open steam / reboiler /
Process Conditions
Stream Details Feed Gas Feed Liquid Dry Gas
Rich Liquid
Extractant /
side stream
Lean
TEG
Semi
Lean
TEG
Temp. [o
C]
Pressure [bara]
Density [kg/m3
]
Mass Flow [kg/hr]
: 35
156.5
159.5
380617
:36.5
156.5
1133
786.4
160
156.5
1042
764.8
: 35.7
156.3
158.7
3.372E+05
: 35.4
156.5
1125
1660
Composition mol% wt% wt% wt% mol% wt% mol% wt% mol% wt%
TEG
Water
Other
0
0.4
99.6
99.2
0.62
0.18
98.95
0.69
0.33
0.01
0
99.99
91.01
8.45
0.54
Column Internals (3)
Trays Not Applicable
Number of
caps / sieve holes / : …
Active Tray Area [m2
] : …
Weir Length [mm] : …
Diameter of
chute pipe / hole / [mm] : …
Packing
Type : Mellapack
Material :
Volume [m3
] : 9.8 (Total)
Length [m] :-
Width [m] :-
Height [m] : 3 (2 beds of 1.5 m)
Remarks:
(1) Tray numbering from top to bottom.
(2) SS = Stainless Steel; CS = Carbon Steel.
(3) Sketch & measures of Column & Tray layout should have been provided.
Designers : Project ID-Number : CPD3425
Date : June 2015](https://image.slidesharecdn.com/10db86e5-b3a1-4553-b5bc-7c80961ebcd4-150915141925-lva1-app6892/85/CDP-FINAL-REPORT-124-320.jpg)
![DISTILLATION COLUMN – SPECIFICATION SHEET
EQUIPMENT NUMBER : C-201
NAME : Still Column
General Data
Service : - distillation / extraction / absorption /
Column Type : - packed / tray / spray /
Tray Type : - cap / sieve / valve /
Tray Number (1)
- Theoretical : 2
- Actual : 2
- Feed (actual) : 2
Tray Distance (HETP) [m] : 0.61 Tray Material : SS314 (2)
Column Diameter [m] : 0.145 Column Material : CS (2)
Column Height [m] : 6
Heating : - none / open steam / reboiler / Natural Gas (3)
Process Conditions
Stream Details Feed Top Bottom Reflux /
Absorbent
Extractant /
side stream
Liq Gas
Temp. [o
C]
Pressure [bara]
Density [kg/m3
]
Mass Flow [kg/hr]
: 150
2
636.3
763.6
202.9
1.1
0.9
2.811
: 70.3
1
1.13
3.23
: 204
1.1
962.4
763.2
: 70.3
1
972.6
1.018
Composition wt% wt% mol% wt% mol% wt% mol% wt% mol% wt%
TEG
Water
Other
98.95
0.69
0.36
33.6
30.71
35.7
0
17.93
82.07
99.12
0.73
0.15
0.01
99.88
0.02
Column Internals (4)
Trays (5)
Number of
caps / sieve holes / : …
Active Tray Area [m2
] : …
Weir Length [mm] : …
Diameter of
chute pipe / hole / [mm] : …
Packing Not Applicable
Type :
Material :
Volume [m3
] :
Length [m] :
Width [m] :
Height [m] :
Remarks:
(1) Tray numbering from top to bottom.
(2) SS = Stainless Steel; CS = Carbon Steel.
(3) Reboiler is V-202; operates with Natural Gas
(4) Sketch & measures of Column & Tray layout should have been provided.
(5) Tray layout valid for whole column.
Designers : Project ID-Number : CPD3425
Date : June 2015](https://image.slidesharecdn.com/10db86e5-b3a1-4553-b5bc-7c80961ebcd4-150915141925-lva1-app6892/85/CDP-FINAL-REPORT-125-320.jpg)
![COLUMN – SPECIFICATION SHEET
EQUIPMENT NUMBER : C-202
NAME : Stripping Column
General Data
Service : - distillation / extraction / absorption /
Column Type : - packed / tray / spray /
Tray Type : - cap / sieve / valve /
Tray Number (1)
- Theoretical : 1
- Actual : 1
- Feed (actual) : 1
Tray Distance (HETP) [m] : - Tray Material : SS314 (2)
Column Diameter [m] : 0.25 Column Material : CS (2)
Column Height [m] : 0.5
Heating : - none / open steam / reboiler / Natural Gas
Process Conditions
Stream Details Feed Top Bottom Reflux /
Absorbent
Extractant /
side stream
Liq Gas
Temp. [o
C]
Pressure [bara]
Density [kg/m3
]
Mass Flow [kg/hr]
: 204
1.1
962.4
763.2
42.14
4.5
3.86
0.7
: 203
1.1
0.9
2.8
: 203
1.1
964.2
761
:
Composition wt% wt% mol% wt% mol% wt% mol% wt% mol% wt%
TEG
Water
Other
99.12
0.73
0.15
0
0.5
99.5
33.58
30.7
35.72
99.2
0.6
0.2
Column Internals (3)
Trays Not Applicable
Number of
caps / sieve holes / : …
Active Tray Area [m2
] : …
Weir Length [mm] : …
Diameter of
chute pipe / hole / [mm] : …
Packing
Type : Mellapack
Material :-
Volume [m3
] :0.012
Length [m] :-
Width [m] :-
Height [m] :0.25
Remarks:
(1) Tray numbering from top to bottom.
(2) SS = Stainless Steel; CS = Carbon Steel.
(3) Sketch & measures of Column & Tray layout should have been provided.
Designers : Project ID-Number : CPD3425
Date : June 2015](https://image.slidesharecdn.com/10db86e5-b3a1-4553-b5bc-7c80961ebcd4-150915141925-lva1-app6892/85/CDP-FINAL-REPORT-126-320.jpg)
![HEAT EXCHANGER – SPECIFICATION SHEET
EQUIPMENT NUMBER : E-201 In Series : 1
NAME : Glycol/Glycol Preheater In Parallel : none
General Data
Service : - Heat Exchanger - Vaporizer
- Cooler - Reboiler
- Condenser (Air cooled) (1), (2), (3)
Type : - Fixed Tube Sheets - Plate Heat Exchanger
- Floating Head - Finned Tubes
- Hair Pin - Thermosyphon
- Double Tube -
Position : - Horizontal
- Vertical
Capacity [kW] : 2.85 (1)
Heat Exchange Area [m2
] : 4.24 (1)
Overall Heat Transfer Coefficient [W/m2
o
C] : 333.28 (1)
Log. Mean Temperature Diff. (LMTD) [o
C] :
Passes Tube Side : 1
Passes Shell Side : n.a.
Correction Factor LMTD (min. 0.75) :
Corrected LMTD [o
C] : 7.257 (1)
Process Conditions
Medium :
Mass Stream [kg/hr] :
Mass Stream to
- Evaporize [kg/s] :
- Condense [kg/s] :
Average Specific Heat [kJ/kgo
C] :
Heat of Evap. / Condensation [kJ/kg] :
Temperature IN [o
C] :
Temperature OUT [o
C] :
Pressure [bara] :
Material :
Shell Side Tube Side
Lean TEG solution
787
n.a.
3
-
57
52
2.5
C.S
Rich TEG solution
1660
n.a
3
-
36
38
5
CS
Remarks:
(1) Calculation of Air Cooler: “Applied Chemical Process Design”, F. Aerstin and G. Street.
(2) Cooler requires 40 x 40 meters plot space, which may not be available.
(3) Requires Fan(s) for forced air circulation with 960 kW for electrical drive(s).
(1) As simulated in Aspen Hysys.
Designers : Project ID-Number : CPD3425
Date : June 2015](https://image.slidesharecdn.com/10db86e5-b3a1-4553-b5bc-7c80961ebcd4-150915141925-lva1-app6892/85/CDP-FINAL-REPORT-127-320.jpg)
![HEAT EXCHANGER – SPECIFICATION SHEET
EQUIPMENT NUMBER : E-202 In Series : 1
NAME : Glycol/Glycol Heater In Parallel : none
General Data
Service : - Heat Exchanger - Vaporizer
- Cooler - Reboiler
- Condenser
Type : - Fixed Tube Sheets - Plate Heat Exchanger
- Floating Head - Finned Tubes
- Hair Pin - Thermosyphon
- Double Tube -
Position : - Horizontal
- Vertical
Capacity [kW] : 93.36 (1)
Heat Exchange Area [m2
] : 24.35 (1)
Overall Heat Transfer Coefficient [W/m2
o
C] : 327.8 (1)
Log. Mean Temperature Diff. (LMTD) [o
C] :
Passes Tube Side : 1
Passes Shell Side : n.a
Correction Factor LMTD (min. 0.75) :
Corrected LMTD [o
C] : 42.13 (1)
Process Conditions
Medium :
Mass Stream [kg/hr] :
Mass Stream to
- Evaporize [kg/s] :
- Condense [kg/s] :
Average Specific Heat [kJ/kgo
C] :
Heat of Evap. / Condensation [kJ/kg] :
Temperature IN [o
C] :
Temperature OUT [o
C] :
Pressure [bara] :
Material :
Shell Side Tube Side
Rich TEG
786.4
-
-
3
-
198.0
57.0
2.5
CS
Lean TEG
1657
-
-
3
-
42
107.8
3.5
CS
Remarks:
(1) As simulated in Aspen Hysys.
Designers : Project ID-Number : CPD3425
Date : June 2015](https://image.slidesharecdn.com/10db86e5-b3a1-4553-b5bc-7c80961ebcd4-150915141925-lva1-app6892/85/CDP-FINAL-REPORT-128-320.jpg)
![HEAT EXCHANGER – SPECIFICATION SHEET
EQUIPMENT NUMBER : E-203 In Series : 1
NAME : Sea Water Cooler In Parallel : none
General Data
Service : - Heat Exchanger - Vaporizer
- Cooler - Reboiler
- Condenser
Type : - Fixed Tube Sheets - Plate Heat Exchanger
- Floating Head - Finned Tubes
- Hair Pin - Thermosyphon
- Double Tube -
Position : - Horizontal
- Vertical
Capacity [kW] : 11.37 (Aspen)
Heat Exchange Area [m2
] : 2.64 (Calc.)
Overall Heat Transfer Coefficient [W/m2
o
C] : 150 (Assumed).
Log. Mean Temperature Diff. (LMTD) [o
C] : 28.68 (Calc.)
Passes Tube Side : 1
Passes Shell Side : n.a
Correction Factor LMTD (min. 0.75) :
Corrected LMTD [o
C] :
Process Conditions
Medium :
Mass Stream [kg/hr] :
Mass Stream to
- Evaporize [kg/s] :
- Condense [kg/s] :
Average Specific Heat [kJ/kgo
C] :
Heat of Evap. / Condensation [kJ/kg] :
Temperature IN [o
C] :
Temperature OUT [o
C] :
Pressure [bara] :
Material (1) :
Shell Side Tube Side
Lean TEG solution
786.4
-
-
3
-
53
35
2
CS
Sea Water
978.03
-
-
4.18
-
10
20
4
C.S
Remarks:
(1) CS = Carbon Steel;
Designers : Project ID-Number : CPD3425
Date : June 2015](https://image.slidesharecdn.com/10db86e5-b3a1-4553-b5bc-7c80961ebcd4-150915141925-lva1-app6892/85/CDP-FINAL-REPORT-129-320.jpg)
![HEAT EXCHANGER – SPECIFICATION SHEET
EQUIPMENT NUMBER : E-204 In Series : 1
NAME : Pervaporation Heater In Parallel : none
General Data
Service : - Heat Exchanger - Vaporizer
- Cooler - Reboiler
- Condenser
Type : - Fixed Tube Sheets - Plate Heat Exchanger
- Floating Head - Finned Tubes
- Hair Pin - Thermosyphon
- Double Tube -
Position : - Horizontal
- Vertical
Capacity [kW] : 61.31 (Aspen)
Heat Exchange Area [m2
] : 2.44 (Calc.)
Overall Heat Transfer Coefficient [W/m2
o
C] : 900 (Assumed).
Log. Mean Temperature Diff. (LMTD) [o
C] : 27.8 (Calc.)
Passes Tube Side : 1
Passes Shell Side : n.a
Correction Factor LMTD (min. 0.75) :
Corrected LMTD [o
C] :
Process Conditions
Medium :
Mass Stream [kg/hr] :
Mass Stream to
- Condense [kg/hr]
- Evaporate [kg/s] :
Average Specific Heat [kJ/kgo
C] :
Heat of Evap. / Condensation [kJ/kg] :
Temperature IN [o
C] :
Temperature OUT [o
C] :
Pressure [bara] :
Material (1) :
Shell Side Tube Side
Steam
106.02
106.02
-
2075.11
162.06
162.06
6.5
CS
Rich TEG solution
1657
-
-
3
-
107.8
150
3
CS
Remarks:
(1) CS = Carbon Steel;
Designers : Project ID-Number : CPD3425
Date : June 2015](https://image.slidesharecdn.com/10db86e5-b3a1-4553-b5bc-7c80961ebcd4-150915141925-lva1-app6892/85/CDP-FINAL-REPORT-130-320.jpg)
![CENTRIFUGAL PUMP – SPECIFICATION SHEET
EQUIPMENT NUMBER : P-101 Operating : 1
NAME : Turbocharger Installed Spare : 0
Service : TEG Solution
Type :
Number : 1
Operating Conditions & Physical Data
Pumped liquid : TEG Rich/TEG Lean/TEG Semi-Lean
Temperature (T) [o
C] : 42/37/160
Density () [kg/m3
] : 705.1/1133/1042
Viscosity () [Ns/m2
] : 0.000012/0.0197/0.001141
Vapour Pressure (pv) [bara] : 154.6/0.425/30.64 at Temperature [o
C]: 37.8
Power
Capacity (v) [m3
/hr] : 2.5/0.8/0.7
Pressure Levels (ps) [bara] : (156.5-4.5) &(1.5-78)& (1.5-77.5)
Theoretical Power [kW] : none { = v( pd - ps)102
}
Pump Efficiency [-] :
Power at Shaft [kW] :
Construction Details (1)
RPM :
Drive :
Type electrical motor :
Tension [V] :
Rotational direction : Clock /
Counter Cl.
Foundation Plate : Combined /
two parts
Flexible Coupling : Yes
Pressure Gauge Suction : No
Pressure Gauge Discharge : Yes
Min. Overpressure above
pv/pm [bar] :
Nominal diameter
Suction Nozzle […] :
Discharge Nozzle […] :
Cooled Bearings : Yes / No
Cooled Stuffing Box : Yes / No
Smothering Gland : Yes / No
If yes
- Seal Liquid : Yes / No
- Splash Rings : Yes / No
- Packing Type :
- Mechanical Seal : Yes / No
- N.P.S.H. [m] :
{ = pmg }
Construction Materials (2)
Pump House :
Pump Rotor :
Shaft :
Special provisions : none
Operating Pressure [bara] : 156.5/78
Wear Rings :
Shaft Box :
Test Pressure [bara] :
Remarks:
(1) Double mechanical seals and seal fluid required for LPG service. Further details to be specified by
Rotating Equipment specialist.
(2) MS = Mild Steel; HT Steel = High Tensile Steel
Designers : Project ID-Number : CPD3425
Date : June 2015](https://image.slidesharecdn.com/10db86e5-b3a1-4553-b5bc-7c80961ebcd4-150915141925-lva1-app6892/85/CDP-FINAL-REPORT-131-320.jpg)
![CENTRIFUGAL PUMP – SPECIFICATION SHEET
EQUIPMENT NUMBER : P-102 A/B Operating : 1
NAME : High Pressure Pump Installed Spare : 1
Service : TEG solution
Type : Centrifugal
Number : 2
Operating Conditions & Physical Data
Pumped liquid : TEG Lean
Temperature (T) [o
C] : 37
Density () [kg/m3
] : 1133
Viscosity () [Ns/m2
] : 0.019
Vapour Pressure (pv) [bara] : 0.425 at Temperature [o
C] :37.8
Power
Capacity (v) [m3
/hr] : 0.8
Suction (ps) [bara] : 78
Discharge (pd) [bara] : 156.5
Theoretical Power [kW] : 2.037 { = v( pd - ps)102
}
Pump Efficiency [-] :
Power at Shaft [kW] :
Construction Details (1)
RPM :
Drive :
Type electrical motor :
Tension [V] :
Rotational direction : Clock /
Counter Cl.
Foundation Plate : Combined /
two parts
Flexible Coupling : Yes
Pressure Gauge Suction : No
Pressure Gauge Discharge : Yes
Min. Overpressure above
pv/pm [bar] :
Nominal diameter
Suction Nozzle […] :
Discharge Nozzle […] :
Cooled Bearings : Yes / No
Cooled Stuffing Box : Yes / No
Smothering Gland : Yes / No
If yes
- Seal Liquid : Yes / No
- Splash Rings : Yes / No
- Packing Type :
- Mechanical Seal : Yes / No
- N.P.S.H. [m] :
{ = pmg }
Construction Materials (2)
Pump House :
Pump Rotor :
Shaft :
Special provisions : none
Operating Pressure [bara] : 156.5
Wear Rings :
Shaft Box :
Test Pressure [bara] :
Remarks:
(1) Double mechanical seals and seal fluid required for LPG service. Further details to be specified by
Rotating Equipment specialist.
(2) MS = Mild Steel; HT Steel = High Tensile Steel
Designers : Project ID-Number : CPD3425
Date : June 2015](https://image.slidesharecdn.com/10db86e5-b3a1-4553-b5bc-7c80961ebcd4-150915141925-lva1-app6892/85/CDP-FINAL-REPORT-132-320.jpg)
![CENTRIFUGAL PUMP – SPECIFICATION SHEET
EQUIPMENT NUMBER : P-103 A/B Operating : 1
NAME : Semi-Lean Injection Pump Installed Spare : 1
Service : TEG solution
Type : Centrifugal
Number : 2
Operating Conditions & Physical Data
Pumped liquid : Semi-Lean TEG
Temperature (T) [o
C] : 160
Density () [kg/m3
] : 1042
Viscosity () [Ns/m2
] : 0.001141
Vapour Pressure (pv) [bara] : 30.64 at Temperature [o
C] :37.8
Power
Capacity (v) [m3
/hr] : 0.7
Suction (ps) [bara] : 1.1
Discharge (pd) [bara] : 156.5
Theoretical Power [kW] : 2.17 { = v( pd - ps)102
}
Pump Efficiency [-] :
Power at Shaft [kW] :
Construction Details (1)
RPM :
Drive :
Type electrical motor :
Tension [V] :
Rotational direction : Clock /
Counter Cl.
Foundation Plate : Combined /
two parts
Flexible Coupling : Yes
Pressure Gauge Suction : No
Pressure Gauge Discharge : Yes
Min. Overpressure above
pv/pm [bar] :
Nominal diameter
Suction Nozzle […] :
Discharge Nozzle […] :
Cooled Bearings : Yes / No
Cooled Stuffing Box : Yes / No
Smothering Gland : Yes / No
If yes
- Seal Liquid : Yes / No
- Splash Rings : Yes / No
- Packing Type :
- Mechanical Seal : Yes / No
- N.P.S.H. [m] :
{ = pmg }
Construction Materials (2)
Pump House :
Pump Rotor :
Shaft :
Special provisions : none
Operating Pressure [bara] : 156.5
Wear Rings :
Shaft Box :
Test Pressure [bara] :
Remarks:
(3) Double mechanical seals and seal fluid required for LPG service. Further details to be specified by
Rotating Equipment specialist.
(4) MS = Mild Steel; HT Steel = High Tensile Steel
Designers : Project ID-Number : CPD3425
Date : June 2015](https://image.slidesharecdn.com/10db86e5-b3a1-4553-b5bc-7c80961ebcd4-150915141925-lva1-app6892/85/CDP-FINAL-REPORT-133-320.jpg)
![CENTRIFUGAL PUMP – SPECIFICATION SHEET
EQUIPMENT NUMBER : P-201 A/B Operating : 1
NAME : Intermediate Pump Installed Spare : 1
Service : TEG solution
Type : Centrifugal
Number : 2
Operating Conditions & Physical Data
Pumped liquid : Semi-Lean TEG
Temperature (T) [o
C] : 150
Density () [kg/m3
] : 636.3
Viscosity () [Ns/m2
] : 0.00001684
Vapour Pressure (pv) [bara] : 30.64 at Temperature [o
C] : 37.8
Power
Capacity (v) [m3
/hr] : 1.2
Suction (ps) [bara] : 1.5
Discharge (pd) [bara] : 2
Theoretical Power [kW] : 0.027 { = v( pd - ps)102
}
Pump Efficiency [-] :
Power at Shaft [kW] :
Construction Details (1)
RPM :
Drive :
Type electrical motor :
Tension [V] :
Rotational direction : Clock /
Counter Cl.
Foundation Plate : Combined /
two parts
Flexible Coupling : Yes
Pressure Gauge Suction : No
Pressure Gauge Discharge : Yes
Min. Overpressure above
pv/pm [bar] :
Nominal diameter
Suction Nozzle […] :
Discharge Nozzle […] :
Cooled Bearings : Yes / No
Cooled Stuffing Box : Yes / No
Smothering Gland : Yes / No
If yes
- Seal Liquid : Yes / No
- Splash Rings : Yes / No
- Packing Type :
- Mechanical Seal : Yes / No
- N.P.S.H. [m] :
{ = pmg }
Construction Materials (2)
Pump House :
Pump Rotor :
Shaft :
Special provisions : none
Operating Pressure [bara] :
Wear Rings :
Shaft Box :
Test Pressure [bara] :
Remarks:
(5) Double mechanical seals and seal fluid required for LPG service. Further details to be specified by
Rotating Equipment specialist.
(6) MS = Mild Steel; HT Steel = High Tensile Steel
Designers : Project ID-Number : CPD3425
Date : June 2015](https://image.slidesharecdn.com/10db86e5-b3a1-4553-b5bc-7c80961ebcd4-150915141925-lva1-app6892/85/CDP-FINAL-REPORT-134-320.jpg)
![CENTRIFUGAL PUMP – SPECIFICATION SHEET
EQUIPMENT NUMBER : P-202 A/B Operating : 1
NAME : Booster Pump Installed Spare : 1
Service : TEG solution
Type : Centrifugal
Number : 2
Operating Conditions & Physical Data
Pumped liquid : Lean TEG
Temperature (T) [o
C] : 198
Density () [kg/m3
] : 969.6
Viscosity () [Ns/m2
] : 0.0006234
Vapour Pressure (pv) [bara] : 0.4308 at Temperature [o
C] : 37.8
Power
Capacity (v) [m3
/hr] : 0.8
Suction (ps) [bara] : 1
Discharge (pd) [bara] : 2.5
Theoretical Power [kW] : 0.045 { = v( pd - ps)102
}
Pump Efficiency [-] :
Power at Shaft [kW] :
Construction Details (1)
RPM :
Drive :
Type electrical motor :
Tension [V] :
Rotational direction : Clock /
Counter Cl.
Foundation Plate : Combined /
two parts
Flexible Coupling : Yes
Pressure Gauge Suction : No
Pressure Gauge Discharge : Yes
Min. Overpressure above
pv/pm [bar] :
Nominal diameter
Suction Nozzle […] :
Discharge Nozzle […] :
Cooled Bearings : Yes / No
Cooled Stuffing Box : Yes / No
Smothering Gland : Yes / No
If yes
- Seal Liquid : Yes / No
- Splash Rings : Yes / No
- Packing Type :
- Mechanical Seal : Yes / No
- N.P.S.H. [m] :
{ = pmg }
Construction Materials (2)
Pump House :
Pump Rotor :
Shaft :
Special provisions : none
Operating Pressure [bara] : 2.5
Wear Rings :
Shaft Box :
Test Pressure [bara] :
Remarks:
(7) Double mechanical seals and seal fluid required for LPG service. Further details to be specified by
Rotating Equipment specialist.
(8) MS = Mild Steel; HT Steel = High Tensile Steel
Designers : Project ID-Number : CPD3425
Date : June 2015](https://image.slidesharecdn.com/10db86e5-b3a1-4553-b5bc-7c80961ebcd4-150915141925-lva1-app6892/85/CDP-FINAL-REPORT-135-320.jpg)
![VACUUM PUMP – SPECIFICATION SHEET
EQUIPMENT NUMBER : P-203 A/B Operating : 1
NAME : Vacuum Pump Installed Spare : 1
Service : TEG solution
Type : Roots Blower
Number : 2
Operating Conditions & Physical Data
Pumped liquid : Lean TEG
Temperature (T) [o
C] : 150
Density () [kg/m3
] : 1
Viscosity () [Ns/m2
] : 0.000014
Vapour Pressure (pv) [bara] : at Temperature [o
C] :
Power
Capacity (v) [m3
/hr] : 252.3
Suction (ps) [bara] : 0.02
Discharge (pd) [bara] : 1
Theoretical Power [kW] : 49 { = v( pd - ps)102
}
Pump Efficiency [-] :
Power at Shaft [kW] :
Construction Details (1)
RPM :
Drive :
Type electrical motor :
Tension [V] :
Rotational direction : Clock /
Counter Cl.
Foundation Plate : Combined /
two parts
Flexible Coupling : Yes
Pressure Gauge Suction : No
Pressure Gauge Discharge : Yes
Min. Overpressure above
pv/pm [bar] :
Nominal diameter
Suction Nozzle […] :
Discharge Nozzle […] :
Cooled Bearings : Yes / No
Cooled Stuffing Box : Yes / No
Smothering Gland : Yes / No
If yes
- Seal Liquid : Yes / No
- Splash Rings : Yes / No
- Packing Type :
- Mechanical Seal : Yes / No
- N.P.S.H. [m] :
{ = pmg }
Construction Materials (2)
Pump House :
Pump Rotor :
Shaft :
Special provisions : none
Operating Pressure [bara] : 0.02/1
Wear Rings :
Shaft Box :
Test Pressure [bara] :
Remarks:
(9) Double mechanical seals and seal fluid required for LPG service. Further details to be specified by
Rotating Equipment specialist.
(10) MS = Mild Steel; HT Steel = High Tensile Steel
Designers : Project ID-Number : CPD3425
Date : June 2015](https://image.slidesharecdn.com/10db86e5-b3a1-4553-b5bc-7c80961ebcd4-150915141925-lva1-app6892/85/CDP-FINAL-REPORT-136-320.jpg)
![VESSEL – SPECIFICATION SHEET
EQUIPMENT NUMBER : V-201 In Series : 1
NAME : Flash Vessel In Parallel : none
General Data
Service : - Buffer / Storage / Separation / Reaction
Type : Vessel
Position : - Horizontal
- Vertical
Internals : - Demister / Plate / Coil / _________
Heating/Cooling medium : - none / Open / Closed / External Hxgr /________
- Type : n.a.
- Quantity [kg/s] : n.a.
- Press./Temp.’s [bara/o
C] : n.a.
Vessel Diameter (ID) [m] : 0.46
Vessel Height [m] : 1.85
Vessel Tot. Volume [m3
] : 0.31
Vessel Material : C.S.
Other :
Process Conditions
Stream Data Feed Top Bottom
Temperature [o
C]
Pressure [bara]
Density [kg/m3
]
Mass Flow [kg/hr]
: 42.05
: 4.5
:686
:1660
: 42.05
: 4.5
:3.86
:3.3
: 42.05
: 4.5
:1104
:1657
Composition mol% wt% mol% wt% mol% wt%
TEG
Water
Others
91.01
8.45
0.54
0
0.5
99.5
91.19
8.47
0.34
Remarks:
Designers : Project ID-Number : CPD3425
Date : June 2015](https://image.slidesharecdn.com/10db86e5-b3a1-4553-b5bc-7c80961ebcd4-150915141925-lva1-app6892/85/CDP-FINAL-REPORT-137-320.jpg)
![VESSEL – SPECIFICATION SHEET
EQUIPMENT NUMBER : V-202 In Series : 1
NAME : Reboiler In Parallel : none
General Data
Service : - Buffer / Storage / Separation / Reaction
Type : Vessel
Position : - Horizontal
- Vertical
Internals : - Demister / Plate / Coil /Tubes
Heating/Cooling medium : - none / Open / Closed / External Hxgr /Natural Gas
- Type : Fuel
- Quantity [kg/hr] : 2.66
- Press./Temp.’s [bara/o
C] : n.a.
Vessel Diameter (ID) [m] : 0.35
Vessel Height [m] : 1.4
Vessel Tot. Volume [m3
] : 0.14
Vessel Material : C.S.
Other :
Process Conditions
Stream Data Feed Top Bottom
Temperature [o
C]
Pressure [bara]
Density [kg/m3
]
Mass Flow [kg/hr]
: 150.3
: 1.1
:1012
:764.3
: 204
: 1.1
:1.104
:1.12
: 204
: 1.1
:962.4
:763.2
Composition mol% wt% mol% wt% mol% wt%
TEG
Water
Others
99.02
0.77
0.28
28.37
30.03
41.6
99.12
0.7
0.18
Remarks:
Designers : Project ID-Number : CPD3425
Date : June 2015](https://image.slidesharecdn.com/10db86e5-b3a1-4553-b5bc-7c80961ebcd4-150915141925-lva1-app6892/85/CDP-FINAL-REPORT-138-320.jpg)
![VESSEL – SPECIFICATION SHEET
EQUIPMENT NUMBER : V-203 In Series : 1
NAME : Surge Vessel In Parallel : none
General Data
Service : - Buffer / Storage / Separation / Reaction
Type : Vessel
Position : - Horizontal
- Vertical
Internals : - Demister / Plate / Coil /Tubes
Heating/Cooling medium : - none / Open / Closed / External Hxgr /
- Type : n.a
- Quantity [kg/hr] : n.a
- Press./Temp.’s [bara/o
C] : n.a.
Vessel Diameter (ID) [m] : 0.48
Vessel Height [m] : 1.9
Vessel Tot. Volume [m3
] : 0.34
Vessel Material : C.S.
Other :
Process Conditions
Stream Data Feed Make up Bottom
Temperature [o
C]
Pressure [bara]
Density [kg/m3
]
Mass Flow [kg/hr]
: 202.9
: 1.1
:964.2
:761
35
1
1110
24.11
: 198.0
: 2.5
:969.6
:785.2
Composition mol% wt% mol% wt% mol% wt%
TEG
Water
Others
99.2
0.06
0.2
99.2
0.8
0
99.2
0.06
0.2
Remarks:
Designers : Project ID-Number : CPD3425
Date : June 2015](https://image.slidesharecdn.com/10db86e5-b3a1-4553-b5bc-7c80961ebcd4-150915141925-lva1-app6892/85/CDP-FINAL-REPORT-139-320.jpg)
![FILTER–SPECIFICATION SHEET
EQUIPMENT NUMBER : S-201A/B In Series : 1
NAME : Filter In Parallel : 1
General Data
Service : - Buffer / Storage / Separation / Reaction/Filtration
Type : Filter
Position : - Horizontal In-Line
- Vertical
- Type : Strainer
- Quantity [kg/hr] : 1657
- Press./Temp.’s [bara/o
C] : 3.5/42.
Strainer Diameter (ID) [m] : 0.48
Strainer Material : S.S.
Other :
Remarks:
Designers : Project ID-Number : CPD3425
Date : June 2015](https://image.slidesharecdn.com/10db86e5-b3a1-4553-b5bc-7c80961ebcd4-150915141925-lva1-app6892/85/CDP-FINAL-REPORT-140-320.jpg)
![PERVAPORATION MEMBRANE MODULE – SPECIFICATION SHEET
EQUIPMENT NUMBER : S-202 (1) In Series : none
NAME : Pervaporation membrane module In Parallel : 138
General Data
Service : - Buffer / Storage / Separation / Reaction
Type : Vessel
Position : - Horizontal
- Vertical
Internals : - Demister / Plate / Coil / Tubes / Membranes tubes
Heating/Cooling medium : - none / Open / Closed / External Hxgr / Natural Gas
- Type : n.a
- Quantity [kg/hr] : n.a
- Press./Temp.’s [bara/o
C] : n.a.
Vessel Diameter (ID) [m] : 0.26
Vessel Length [m] : 1.402
Vessel Tot. Volume [m3
] : 0.074
Vessel Material : S.S.
Other :
Process Conditions
Stream Data Feed Retentate Permeate
Temperature [o
C]
Pressure [bara]
Density [kg/m3
]
Mass Flow [kg/hr]
: 150.3
: 3.0
: 621
: 1657
: 150.3
: 1.5
: 522
: 1529
: 150.3
: 0.02
: 1
: 128
Composition mol% wt% mol% wt% mol% wt%
TEG
Water
Others
91.20
8.47
0.33
98.95
0.69
0.36
-
100
-
Remarks: (1) 138 modules in rectangular disposal 14 x 10.
Then, 7 x 5 m (WxH) in the pervaporation membrane unit.
Designers : Project ID-Number : CPD3425
Date : June 2015](https://image.slidesharecdn.com/10db86e5-b3a1-4553-b5bc-7c80961ebcd4-150915141925-lva1-app6892/85/CDP-FINAL-REPORT-141-320.jpg)

![Bibliography
[1] J. Pettersen, Natural gas fundamentals (2006).
[2] E. Kirk-Othmer, of chem, Tech., 1, 733 (1983).
[3] S. Mokhatab and M. J. Economides, Process selection is critical to onshore lng economics, World
oil 227, 95 (2006).
[4] Opening the area around jan mayen for petroleum activities – public hear-
ing on impact assessment, https://www.regjeringen.no/en/aktuelt/
opening-the-area-around-jan-mayen-for-pe/id705121/, (Visited on 06/01/2015).
[5] Oil and gas - invest in norway, http://www.invinor.no/no/Industries/Oil-and-Gas/,
(Visited on 06/01/2015).
[6] Status of norwegian natural gas and a forecast towards 2025
fractional flow, http://fractionalflow.com/2014/10/05/
status-of-norwegian-natural-gas-and-a-forecast-towards-2025/, (Visited
on 06/01/2015).
[7] msdssearch.dow.com/publishedliteraturedowcom/dh 004d/0901b8038004d042.pdf filepath=
ethyleneglycol/pdfs/noreg/612-00004.pdf&frompage=getdoc, http://msdssearch.dow.
com/PublishedLiteratureDOWCOM/dh_004d/0901b8038004d042.pdf?filepath=
ethyleneglycol/pdfs/noreg/612-00004.pdf&fromPage=GetDoc, (Visited on
06/11/2015).
[8] Triethylene glycol c6h14o4 - pubchem, http://pubchem.ncbi.nlm.nih.gov/compound/
triethylene_glycol, (Visited on 06/01/2015).
[9] Water, density, specific enthalpy, viscosity, http://www.thermexcel.com/english/
tables/eau_atm.htm, (Visited on 06/01/2015).
[10] Engineering toolbox, http://www.engineeringtoolbox.com/
fluids-evaporation-latent-heat-d_147.html, (Visited on 06/01/2015).
[11] Engineering toolbox, http://www.engineeringtoolbox.com/, (Visited on 06/01/2015).
[12] Mother earth alcohol fuel: Chapter 7 - still designs, http://journeytoforever.org/
biofuel_library/ethanol_motherearth/meCh7.html, (Visited on 05/28/2015).
[13] G. GPSA, Engineering data book, Gas Processors Suppliers Association , 16 (2004).
[14] Sulzer - mellapak and mellapakplus , http://www.sulzer.com/en/
Products-and-Services/Separation-Technology/Structured-Packings/
Mellapak-MellapakPlus-Mellapak-Plastic, (Visited on 05/28/2015).
[15] J. M. Campbell, Gas conditioning and processing. volume 2: The equipment modules, (1998).
[16] D. L. S. W. W.D.Seider, J.D. Seader, Product and Process Design Principles; Synthesis, Analysis,
and Evaluation, third edition ed. (Wiley, 2010).
[17] www.bharatbijlee.com/motors/industrial-catalogue.pdf, http://www.bharatbijlee.com/
motors/Industrial-Catalogue.pdf, (Visited on 06/25/2015).
[18] Dow ethylene glycols, http://www.dow.com/ethyleneglycol/about/properties.htm,
(Visited on 06/10/2015).
135](https://image.slidesharecdn.com/10db86e5-b3a1-4553-b5bc-7c80961ebcd4-150915141925-lva1-app6892/85/CDP-FINAL-REPORT-143-320.jpg)
![136 Bibliography
[19] C. O. TOXICOLOGY, EMERGENCY AND CONTINUOUS EXPOSURE LIMITS FOR SELECTED AIR-
BORNE CONTAMINANTS, Vol. 1 (National Academy Press, Washington, D.C., 1984).
[20] Gases - explosive and flammability concentration limits, http://www.engineeringtoolbox.
com/explosive-concentration-limits-d_423.html, (Visited on 06/10/2015).
[21] T. I. A. of Oil & Gas Producers, Monday accident & lessons learned: Ogp safety alert – teg fire
at gas dehydration unit, http://www.taproot.com/archives/40586 (2013), (Visited on
06/10/2015).
[22] E. Altman, P. Kreis, T. van Gerven, G. Stefanidis, A. Stankiewicz, and A. Górak, Experimental,
modeling and simulation of reactive distillation, Microwave Enhanced Reactive Distillation 49, 95
(2010).
[23] J. Robinson, S. Kingman, D. Irvine, P. Licence, A. Smith, G. Dimitrakis, D. Obermayer, and
C. O. Kappe, Understanding microwave heating effects in single mode type cavities theory and
experiment, Physical Chemistry Chemical Physics 12, 4750 (2010).
[24] A. Stankiewicz and J. A. Moulijn, Re-engineering the chemical processing plant: process intensi-
fication (CRC Press, 2003).
[25] Automobile technology: Turbocharger, http://automobiletechinfo.blogspot.nl/
2013/09/turbocharger.html, (Visited on 06/26/2015).
[26] Energy recovery turbocharger energy analysis - energy recovery, http://www.
energyrecovery.com/resource/turbocharger-energy-analysis/, (Visited on
06/11/2015).
[27] Technologies - membrane distillation - kmx corp. - kmx corporation,azeotropic waste
streams,membrane technology,wastewater treatment,chemical users,chemical waste gen-
erators,clean tech,converting waste into valuable recycled products,greenhouse gas re-
ductions,hazardous waste recycling,hollow fiber membranes,offsite recycling,pervaporation
membranes,recovery of hazardous waste,separation of volatile organic compound(s),solvent
recovery,toxic waste recycling,waste chemical recovery,waste water recycling,water purifica-
tion, http://www.kmxcorp.com/water_chemical_purification.php?division=
Technologies&area=Membrane%20Distillation&page=Introduction, (Visited on
06/11/2015).
[28] Membrane filtration emis, http://emis.vito.be/node/19492, (Visited on 06/11/2015).
[29] P. Kraychy and A. Masuda, Molecular sieves dehydrate high-acid gas at pine creek, Oil and Gas
Journal (1966).
[30] M. F. Doherty and M. F. Malone, Conceptual design of distillation systems (McGraw-Hill Sci-
ence/Engineering/Math, 2001).
[31] W. L. Luyben and I.-L. Chien, Design and control of distillation systems for separating azeotropes
(John Wiley & Sons, 2011).
[32] www.graham-mfg.com/usr/pdf/techlibvacuum/210.pdf, http://www.graham-mfg.com/
usr/pdf/techlibvacuum/210.pdf, (Visited on 06/11/2015).
[33] C. Ramshaw and R. H. Mallinson, Mass transfer apparatus and process, (1983), uS Patent
4,400,275.
[34] L. Agarwal, V. Pavani, D. Rao, and N. Kaistha, Process intensification in higee absorption and
distillation: design procedure and applications, Industrial & Engineering Chemistry Research 49,
10046 (2010).
[35] T. Kelleher and J. R. Fair, Distillation studies in a high-gravity contactor, Industrial & engineering
chemistry research 35, 4646 (1996).](https://image.slidesharecdn.com/10db86e5-b3a1-4553-b5bc-7c80961ebcd4-150915141925-lva1-app6892/85/CDP-FINAL-REPORT-144-320.jpg)
![Bibliography 137
[36] File:half-yearly electricity and gas prices, second half of year, 2012–14 (eur per kwh) yb15.png -
statistics explained, http://ec.europa.eu/eurostat/statistics-explained/index.
php/File:Half-yearly_electricity_and_gas_prices,_second_half_of_year,
(Visited on 06/10/2015).
[37] Pumping costs, http://www.engineeringtoolbox.com/water-pumping-costs-d_
1527.html, (Visited on 06/08/2015).
[38] How much carbon dioxide is produced per kilowatthour when generating electricity with fossil
fuels - faq - u.s. energy information administration (eia), http://www.eia.gov/tools/
faqs/faq.cfm?id=74&t=11, (Visited on 06/10/2015).
[39] N. E. Leadbeater, Microwave heating as a tool for sustainable chemistry (CRC Press, 2010).
[40] C. O. Kappe, A. Stadler, and D. Dallinger, Microwaves in organic and medicinal chemistry (John
Wiley & Sons, 2012).
[41] J. Wijmans, A. Ng, and A. Mairal, Natural gas dehydration process and apparatus, (2004), uS
Patent App. 10/280,147.
[42] C. Yu, C. Zhong, Y. Liu, X. Gu, G. Yang, W. Xing, and N. Xu, Pervaporation dehydration of ethylene
glycol by naa zeolite membranes, Chemical Engineering Research and Design 90, 1372 (2012).
[43] R. Huang, P. Shao, X. Feng, and W. Anderson, Separation of ethylene glycol-water mixtures
using sulfonated poly (ether ether ketone) pervaporation membranes: membrane relaxation and
separation performance analysis, Industrial & engineering chemistry research 41, 2957 (2002).
[44] pervaporation-membranes.com/wp-content/uploads/2014/10/datasheet-pvm-094-version-16-
10-2014.pdf, http://pervaporation-membranes.com/wp-content/uploads/2014/
10/Datasheet-PVM-094-version-16-10-2014.pdf (), (Visited on 06/11/2015).
[45] pervaporation-membranes.com/wp-content/uploads/2014/10/datasheet-
4-channel-hybrid-silica-membranes-version-23-9-2014.pdf, http://
pervaporation-membranes.com/wp-content/uploads/2014/10/
Datasheet-4-Channel-Hybrid-Silica-membranes-Version-23-9-2014.pdf (),
(Visited on 06/15/2015).
[46] pervaporation-membranes.com/wp-content/uploads/2014/10/datasheet-pvm-094-version-16-
10-2014.pdf, http://pervaporation-membranes.com/wp-content/uploads/2014/
10/Datasheet-PVM-094-version-16-10-2014.pdf (), (Visited on 06/15/2015).
[47] W. U. W. Werkgroep Begrotingsproblemen in de Chemische Industrie (Webci), Dace prijzenboekje,
Kostengegevens tbv ramingen , 254 (2005).
[48] Matches’ engineering to chemical energy manufacturing metallurgical industries, http://www.
matche.com/, (Visited on 06/08/2015).
[49] Eur to usd exchange rate - bloomberg markets, http://www.bloomberg.com/quote/
EURUSD:CUR, (Visited on 06/23/2015).
[50] J. R. Couper, W. R. Penney, and J. R. Fair, Chemical Process Equipment revised 2E: Selection and
Design (Gulf Professional Publishing, 2009).
[51] Calculator: Saturated steam table by pressure tlv, http://www.tlv.com/global/TI/
calculator/steam-table-pressure.html (), (Visited on 06/25/2015).
[52] Heat transfer coefficients in heat exchangers, http://www.engineeringtoolbox.com/
heat-transfer-coefficients-exchangers-d_450.html (), (Visited on 06/25/2015).
[53] J. Fair, How to predict sieve tray entrainment and flooding, Petro/Chem Eng 33, 45 (1961).](https://image.slidesharecdn.com/10db86e5-b3a1-4553-b5bc-7c80961ebcd4-150915141925-lva1-app6892/85/CDP-FINAL-REPORT-145-320.jpg)
![138 Bibliography
[54] www.sulzer.com/nl/-/media/documents/productsandservices/separation technology/structured
packings/brochures/structured packings.pdf, http://www.sulzer.com/nl/-/media/
Documents/ProductsAndServices/Separation_Technology/Structured_
Packings/Brochures/Structured_Packings.pdf, (Visited on 06/04/2015).
[55] L. T. Biegler, I. E. Grossmann, and A. W. Westerberg, Systematic methods for chemical process
design, (1997).
[56] Siddhant equipments limited, www.aquacoolct.com/articles.htm, (Visited on
06/25/2015).
[57] Heat transfer coefficients in heat exchangers, http://www.engineeringtoolbox.com/
heat-transfer-coefficients-exchangers-d_450.html, (Visited on 06/11/2015).
[58] Heat exchanger mean temperature differences for refrigerant mixtures, http://www-old.me.
gatech.edu/energy/pubs/imece/imece.html, (Visited on 06/26/2015).
[59] Physics 203, https://spot.davidjulrich.com/blog/112/, (Visited on 06/26/2015).
[60] Modulus of elasticity, average properties of structural materials, shear modulus, poisson’s ra-
tio, density engineers edge www.engineersedge.com, http://www.engineersedge.com/
manufacturing_spec/average_properties_structural_materials.htm, (Visited on
06/25/2015).](https://image.slidesharecdn.com/10db86e5-b3a1-4553-b5bc-7c80961ebcd4-150915141925-lva1-app6892/85/CDP-FINAL-REPORT-146-320.jpg)


