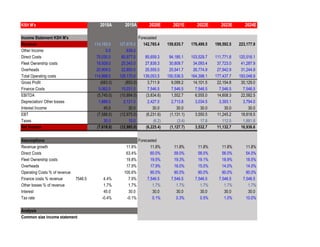
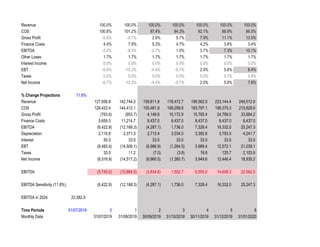
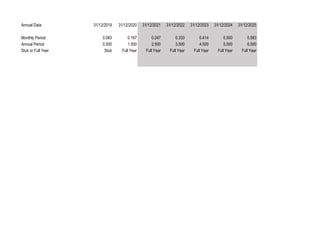
KSH M's 2018A 2019A 2020E 2021E 2022E 2023E 2024E
Income Statement KSH M's Forecasted
Revenue 114,185.0 127,678.0 142,765.4 159,635.7 178,499.5 199,592.5 223,177.9
Other Income 0.0 639.0
Direct Costs 75,030.0 80,977.0 85,659.3 94,185.1 103,529.7 111,771.8 120,516.1
Fleet Ownership costs 18,929.0 25,343.0 27,839.3 30,809.7 34,093.4 37,723.0 41,287.9
Overheads 20,909.0 22,850.0 25,555.0 25,541.7 26,774.9 27,942.9 31,244.9
Total Operating costs 114,868.0 129,170.0 139,053.5 150,536.5 164,398.1 177,437.7 193,048.9
Gross Profit (683.0) (853.0) 3,711.9 9,099.2 14,101.5 22,154.8 30,129.0
Finance Costs 5,062.0 10,031.0 7,546.5 7,546.5 7,546.5 7,546.5 7,546.5
EBITDA (5,745.0) (10,884.0) (3,834.6) 1,552.7 6,555.0 14,608.3 22,582.5
Depreciation/ Other losses 1,888.0 2,121.0 2,427.0 2,713.8 3,034.5 3,393.1 3,794.0
Interest Income 45.0 30.0 30.0 30.0 30.0 30.0 30.0
EBT (7,588.0) (12,975.0) (6,231.6) (1,131.1) 3,550.5 11,245.2 18,818.5
Taxes 30.0 10.0 (6.2) (3.4) 17.8 112.5 1,881.8
Net Income (7,618.0) (12,985.0) (6,225.4) (1,127.7) 3,532.7 11,132.7 16,936.6
Assumptions Forecasted
Revenue growth 11.8% 11.8% 11.8% 11.8% 11.8% 11.8%
Direct Costs 63.4% 60.0% 59.0% 58.0% 56.0% 54.0%
Fleet Ownership costs 19.8% 19.5% 19.3% 19.1% 18.9% 18.5%
Overheads 17.9% 17.9% 16.0% 15.0% 14.0% 14.0%
Operating Costs % of revenue 100.6% 90.0% 90.0% 90.0% 90.0% 90.0%
Finance costs % revenue 7546.5 4.4% 7.9% 7,546.5 7,546.5 7,546.5 7,546.5 7,546.5
Other losses % of revenue 1.7% 1.7% 1.7% 1.7% 1.7% 1.7% 1.7%
Interest 45.0 30.0 30.0 30.0 30.0 30.0 30.0
Tax rate -0.4% -0.1% 0.1% 0.3% 0.5% 1.0% 10.0%
Analysis
Common size income statement
Revenue 100.0% 100.0% 100.0% 100.0% 100.0% 100.0% 100.0%
COS 100.6% 101.2% 97.4% 94.3% 92.1% 88.9% 86.5%
Gross Profit -0.6% -0.7% 2.6% 5.7% 7.9% 11.1% 13.5%
Finance Costs 4.4% 7.9% 5.3% 4.7% 4.2% 3.8% 3.4%
EBITDA -5.0% -8.5% -2.7% 1.0% 3.7% 7.3% 10.1%
Other Loses 1.7% 1.7% 1.7% 1.7% 1.7% 1.7% 1.7%
Interest Income 0.0% 0.0% 0.0% 0.0% 0.0% 0.0% 0.0%
EBT -6.6% -10.2% -4.4% -0.7% 2.0% 5.6% 8.4%
Taxes 0.0% 0.0% 0.0% 0.0% 0.0% 0.1% 0.8%
Net Income -6.7% -10.2% -4.4% -0.7% 2.0% 5.6% 7.6%
% Change Projections 11.8%
Revenue 127,658.8 142,744.0 159,611.8 178,472.7 199,562.5 223,144.4 249,512.9
COS 128,422.4 144,412.1 155,461.9 168,299.8 183,797.1 198,375.3 215,828.6
Gross Profit (763.6) (953.7) 4,149.9 10,172.9 15,765.4 24,769.0 33,684.2
Finance Costs 5,659.3 11,214.7 8,437.0 8,437.0 8,437.0 8,437.0 8,437.0
EBITDA (6,422.9) (12,168.3) (4,287.1) 1,736.0 7,328.4 16,332.0 25,247.3
Depreciation 2,110.8 2,371.3 2,713.4 3,034.0 3,392.6 3,793.5 4,241.7
Interest 50.3 33.5 33.5 33.5 33.5 33.5 33.5
EBT (8,483.4) (14,506.1) (6,966.9) (1,264.5) 3,969.4 12,572.1 21,039.1
Taxes 33.5 11.2 (7.0) (3.8) 19.8 125.7 2,103.9
Net Income (8,516.9) (14,517.2) (6,960.0) (1,260.7) 3,949.6 12,446.4 18,935.2
EBITDA (5,745.0) (10,884.0) (3,834.6) 1,552.7 6,555.0 14,608.3 22,582.5
EBITDA Sensitivity (11.8%) (6,422.9) (12,168.3) (4,287.1) 1,736.0 7,328.4 16,332.0 25,247.3
EBITDA in 2024 22,582.5
Time Periods 01/07/2019 0 1 2 3 4 5 6
Monthly Data 31/07/2019 31/08/2019 30/09/2019 31/10/2019 30/11/2019 31/12/2019 31/01/2020
Annual Data 31/12/2019 31/12/2020 31/12/2021 31/12/2022 31/12/2023 31/12/2024 31/12/2025
Monthly Period 0.083 0.167 0.247 0.333 0.414 0.500 0.583
Annual Period 0.500 1.500 2.500 3.500 4.500 5.500 6.500
Stub or Full Year Stub Full Year Full Year Full Year Full Year Full Year Full Year

KENYA AIRWAYS STATEMENT ANALYSIS- CIFA LUDENYO

  • 1.
    KSH M's 2018A2019A 2020E 2021E 2022E 2023E 2024E Income Statement KSH M's Forecasted Revenue 114,185.0 127,678.0 142,765.4 159,635.7 178,499.5 199,592.5 223,177.9 Other Income 0.0 639.0 Direct Costs 75,030.0 80,977.0 85,659.3 94,185.1 103,529.7 111,771.8 120,516.1 Fleet Ownership costs 18,929.0 25,343.0 27,839.3 30,809.7 34,093.4 37,723.0 41,287.9 Overheads 20,909.0 22,850.0 25,555.0 25,541.7 26,774.9 27,942.9 31,244.9 Total Operating costs 114,868.0 129,170.0 139,053.5 150,536.5 164,398.1 177,437.7 193,048.9 Gross Profit (683.0) (853.0) 3,711.9 9,099.2 14,101.5 22,154.8 30,129.0 Finance Costs 5,062.0 10,031.0 7,546.5 7,546.5 7,546.5 7,546.5 7,546.5 EBITDA (5,745.0) (10,884.0) (3,834.6) 1,552.7 6,555.0 14,608.3 22,582.5 Depreciation/ Other losses 1,888.0 2,121.0 2,427.0 2,713.8 3,034.5 3,393.1 3,794.0 Interest Income 45.0 30.0 30.0 30.0 30.0 30.0 30.0 EBT (7,588.0) (12,975.0) (6,231.6) (1,131.1) 3,550.5 11,245.2 18,818.5 Taxes 30.0 10.0 (6.2) (3.4) 17.8 112.5 1,881.8 Net Income (7,618.0) (12,985.0) (6,225.4) (1,127.7) 3,532.7 11,132.7 16,936.6 Assumptions Forecasted Revenue growth 11.8% 11.8% 11.8% 11.8% 11.8% 11.8% Direct Costs 63.4% 60.0% 59.0% 58.0% 56.0% 54.0% Fleet Ownership costs 19.8% 19.5% 19.3% 19.1% 18.9% 18.5% Overheads 17.9% 17.9% 16.0% 15.0% 14.0% 14.0% Operating Costs % of revenue 100.6% 90.0% 90.0% 90.0% 90.0% 90.0% Finance costs % revenue 7546.5 4.4% 7.9% 7,546.5 7,546.5 7,546.5 7,546.5 7,546.5 Other losses % of revenue 1.7% 1.7% 1.7% 1.7% 1.7% 1.7% 1.7% Interest 45.0 30.0 30.0 30.0 30.0 30.0 30.0 Tax rate -0.4% -0.1% 0.1% 0.3% 0.5% 1.0% 10.0% Analysis Common size income statement
  • 2.
    Revenue 100.0% 100.0%100.0% 100.0% 100.0% 100.0% 100.0% COS 100.6% 101.2% 97.4% 94.3% 92.1% 88.9% 86.5% Gross Profit -0.6% -0.7% 2.6% 5.7% 7.9% 11.1% 13.5% Finance Costs 4.4% 7.9% 5.3% 4.7% 4.2% 3.8% 3.4% EBITDA -5.0% -8.5% -2.7% 1.0% 3.7% 7.3% 10.1% Other Loses 1.7% 1.7% 1.7% 1.7% 1.7% 1.7% 1.7% Interest Income 0.0% 0.0% 0.0% 0.0% 0.0% 0.0% 0.0% EBT -6.6% -10.2% -4.4% -0.7% 2.0% 5.6% 8.4% Taxes 0.0% 0.0% 0.0% 0.0% 0.0% 0.1% 0.8% Net Income -6.7% -10.2% -4.4% -0.7% 2.0% 5.6% 7.6% % Change Projections 11.8% Revenue 127,658.8 142,744.0 159,611.8 178,472.7 199,562.5 223,144.4 249,512.9 COS 128,422.4 144,412.1 155,461.9 168,299.8 183,797.1 198,375.3 215,828.6 Gross Profit (763.6) (953.7) 4,149.9 10,172.9 15,765.4 24,769.0 33,684.2 Finance Costs 5,659.3 11,214.7 8,437.0 8,437.0 8,437.0 8,437.0 8,437.0 EBITDA (6,422.9) (12,168.3) (4,287.1) 1,736.0 7,328.4 16,332.0 25,247.3 Depreciation 2,110.8 2,371.3 2,713.4 3,034.0 3,392.6 3,793.5 4,241.7 Interest 50.3 33.5 33.5 33.5 33.5 33.5 33.5 EBT (8,483.4) (14,506.1) (6,966.9) (1,264.5) 3,969.4 12,572.1 21,039.1 Taxes 33.5 11.2 (7.0) (3.8) 19.8 125.7 2,103.9 Net Income (8,516.9) (14,517.2) (6,960.0) (1,260.7) 3,949.6 12,446.4 18,935.2 EBITDA (5,745.0) (10,884.0) (3,834.6) 1,552.7 6,555.0 14,608.3 22,582.5 EBITDA Sensitivity (11.8%) (6,422.9) (12,168.3) (4,287.1) 1,736.0 7,328.4 16,332.0 25,247.3 EBITDA in 2024 22,582.5 Time Periods 01/07/2019 0 1 2 3 4 5 6 Monthly Data 31/07/2019 31/08/2019 30/09/2019 31/10/2019 30/11/2019 31/12/2019 31/01/2020
  • 3.
    Annual Data 31/12/201931/12/2020 31/12/2021 31/12/2022 31/12/2023 31/12/2024 31/12/2025 Monthly Period 0.083 0.167 0.247 0.333 0.414 0.500 0.583 Annual Period 0.500 1.500 2.500 3.500 4.500 5.500 6.500 Stub or Full Year Stub Full Year Full Year Full Year Full Year Full Year Full Year