The document discusses corporate finance and valuation principles, highlighting the importance of understanding biases in valuations, the roles of discounted cash flow (DCF) methods, and the need for accurate assessments of growth and risks. It covers various valuation models, emphasizes that there are no precise estimations in valuations, and provides examples from major Tata companies with detailed calculations. Key themes include the intrinsic value of assets, the impact of operating risks, and the necessity for discerning the cost of capital.


![Austria [1]
4.50%
Albania
11.25%
Belgium [1]
4.95%
Armenia
9.00%
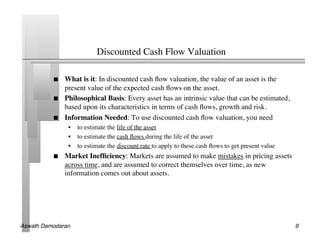
Cyprus [1]
5.63%
Azerbaijan
8.25%
Denmark
4.50%
Belarus
11.25%
Country Risk Premiums
Finland [1]
4.50%
Bosnia and Herzegovina
12.75%
January 2010
France [1]
Germany [1]
4.50%
4.50%
Bulgaria
Croatia
7.50%
7.50%
Greece [1]
6.08%
Czech Republic
5.85%
Iceland
7.50%
Estonia
5.85%
Ireland [1]
4.95%
Hungary
6.90%
Italy [1]
5.40%
Kazakhstan
7.20%
Canada
4.50%
Malta [1]
5.85%
Latvia
7.50%
Mexico
6.90%
Lithuania
6.90%
Netherlands [1]
4.50%
United States of America
4.50%
Moldova
15.75%
Norway
4.50%
Montenegro
9.75%
Portugal [1]
5.40%
Poland
6.08%
Spain [1]
4.50%
Romania
7.50%
Argentina
Sweden
14.25%
4.50%
Russia
6.90%
Belize
Switzerland
14.25%
4.50%
Slovakia
5.85%
Bolivia
12.75%
Kingdom
United 4.50%
Slovenia [1]
5.40%
Brazil
7.50%
Turkmenistan
12.75%
Chile
5.85%
Ukraine
12.75%
Colombia
7.50%
Bahrain
6.08%
Australia
4.50%
Costa Rica
8.25%
Israel
5.85%
New Zealand
4.50%
Ecuador
19.50%
Jordan
7.50%
El Salvador
19.50%
Kuwait
5.40%
Guatemala
8.25%
Lebanon
12.75%
Honduras
12.75%
Oman
6.08%
Nicaragua
14.25%
Qatar
5.40%
Panama
8.25%
Saudi Arabia
5.85%
Paraguay
14.25%
United Arab Emirates
5.40%
Peru
7.50%
Uruguay
9.75%
Venezuela
11.25%
Aswath Damodaran! 30!](https://image.slidesharecdn.com/tatavaluationbyaswath-100803060544-phpapp01/85/Tata-valuation-by-aswath-30-320.jpg)