Download to read offline


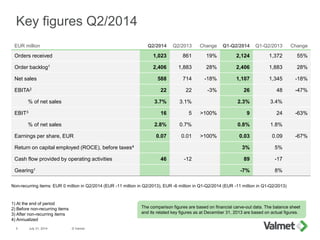

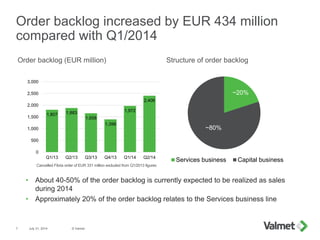

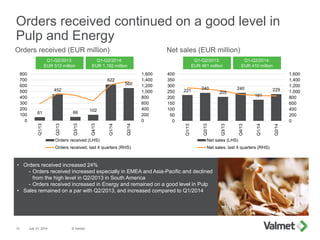
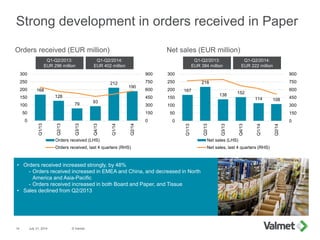

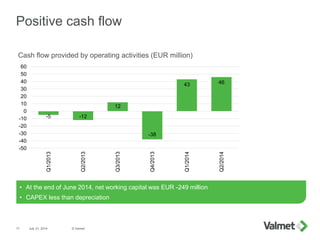
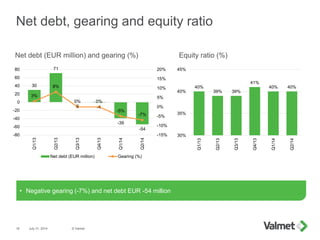
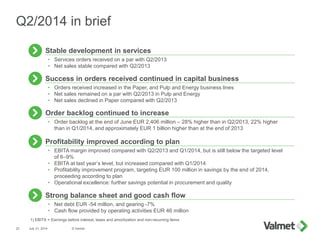


In the first half of 2014, Valmet reported a strong increase in orders received, particularly in the paper, pulp, and energy sectors, leading to an order backlog that is 28% higher than the previous year. The company's net sales remained stable, although slightly down in the paper sector, while profitability improvements are ongoing with an aim to save EUR 100 million by the end of 2014. Financially, Valmet has a positive cash flow, a strong balance sheet, and reduced net debt.


