Download to read offline

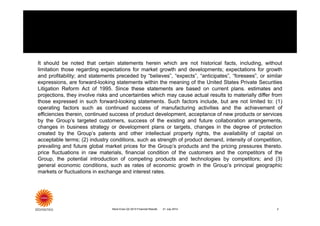
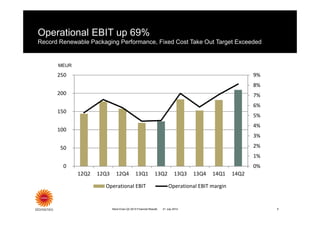
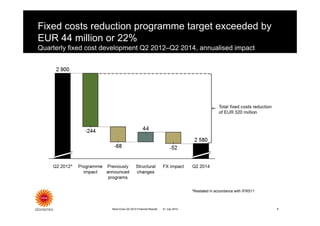
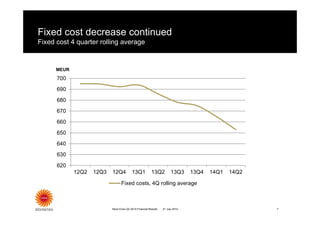
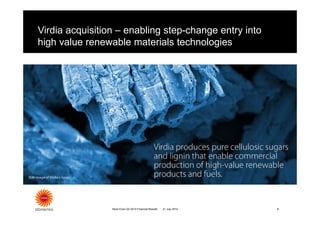

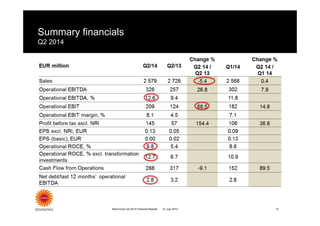
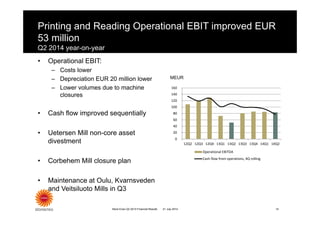
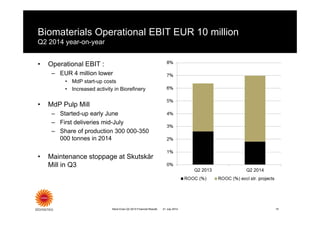
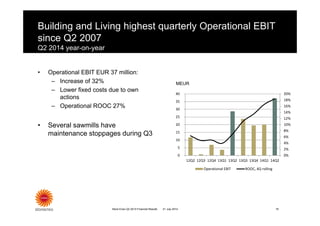
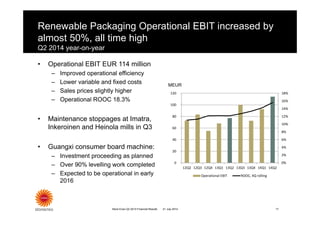
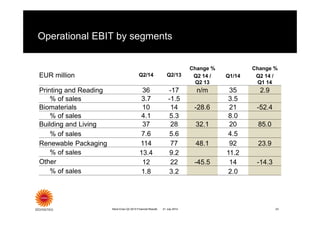
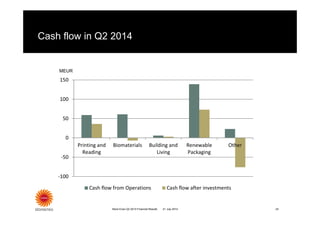
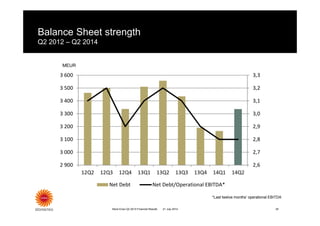

- Stora Enso reported financial results for Q2 2014, with sales of EUR 2.579 billion and operational EBIT margin of 8.1%, up from 4.5% in Q2 2013. - All business divisions improved operational EBIT significantly compared to Q2 2013. Renewable Packaging achieved record results with operational EBIT up almost 50%. - The fixed costs reduction program was completed, exceeding its target by 22%. Transformation to renewable materials continues with the Virdia acquisition and machine conversion in Varkaus.


