Download as PDF, PPTX


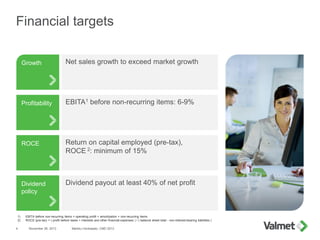

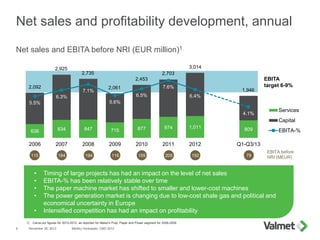
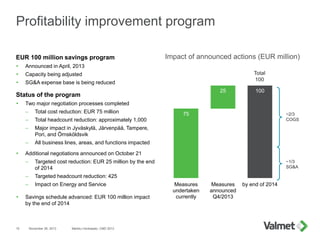
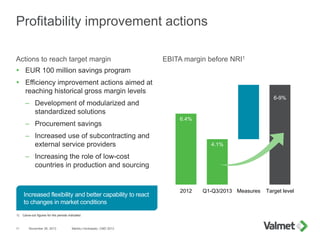
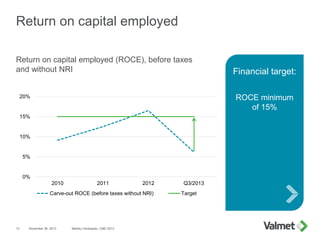
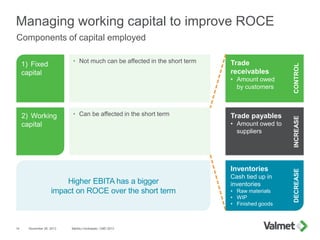

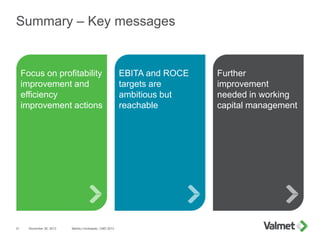

The financial update by CFO Markku Honkasalo outlines targets for growth, profitability, and return on capital employed (ROCE) alongside capital management strategies. Emphasis is placed on the importance of efficiency improvements and a €100 million savings program to enhance profitability, with ambitious ROCE targets set at a minimum of 15%. The document highlights strong cash flow, a solid balance sheet, and various growth drivers in the global market, particularly in the Asia-Pacific region.


