Download as PDF, PPTX

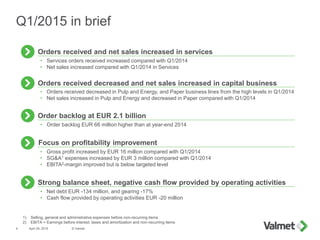
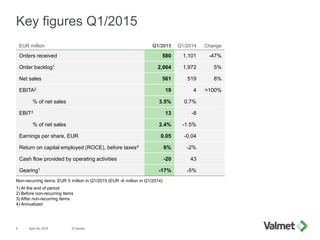
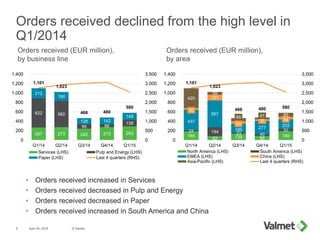

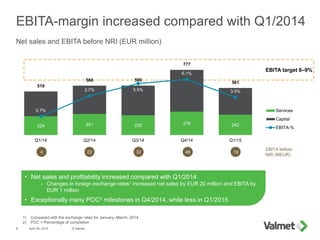
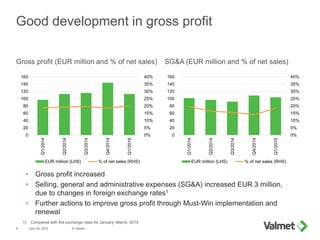


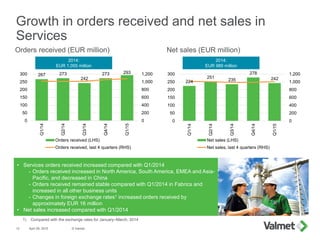
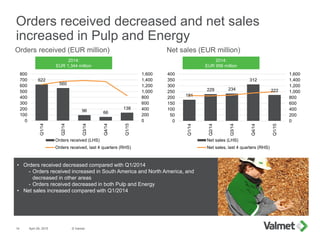
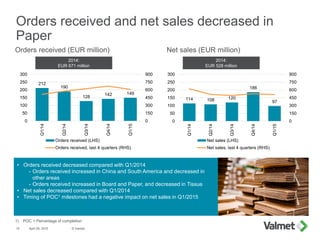
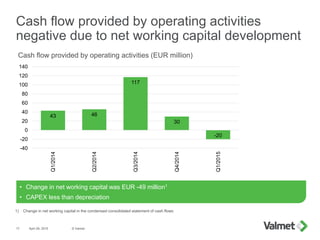
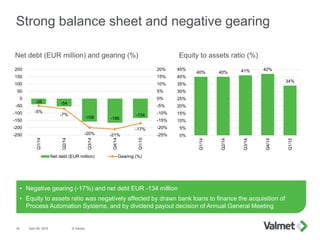
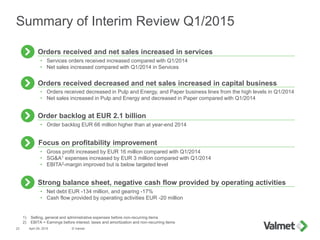


In Q1 2015, Valmet experienced a decrease in orders received for pulp, energy, and paper segments, but an increase in orders received for services, leading to improved net sales in that area. The company reported a gross profit increase of EUR 16 million year-over-year, though SG&A expenses also rose, and the EBITA margin remains below target. Valmet maintains a strong balance sheet, with a negative net debt of EUR -134 million and an order backlog of EUR 2.1 billion, indicating stability despite negative cash flow from operating activities.


