Downloaded 13 times
![When a survey is a good choice
• A survey is a good choice when you want to get answers
to specific questions by reaching a large group of users
• It’s not a good idea to use a survey when you have broad
questions about your users or want to understand
comprehensive workflow
• A survey is a good method when you want quantitative
[numbers] data, not qualitative [text] data
6](https://image.slidesharecdn.com/uxpawebinarsurveysmonterary-140612154415-phpapp02/85/Surveys-6-320.jpg)
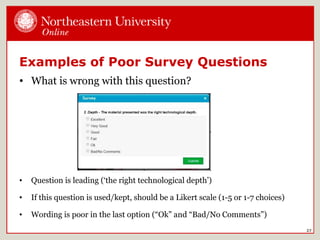
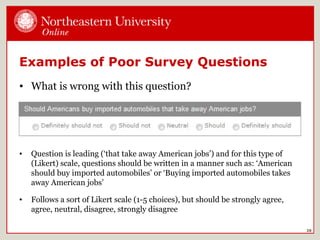

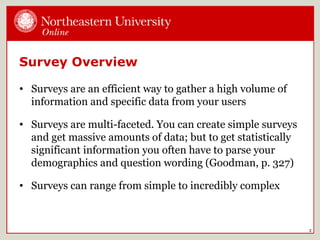
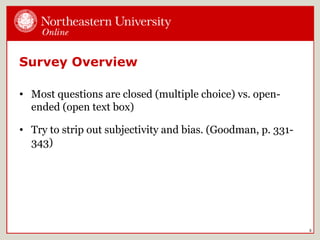
Surveys are an efficient way to gather information from users. They can range from simple to complex and use closed or open-ended questions. Online survey tools make administration and analysis easier. Good survey design involves determining goals, sample size, question wording free of bias, logical flow, and testing. Analysis requires looking at trends in raw data. Reporting should include an executive summary and presentation of data. Examples show poor question wording can introduce bias or be convoluted.


![Survey design-workshop-1234170716539145-3[1]](https://cdn.slidesharecdn.com/ss_thumbnails/survey-design-workshop-1234170716539145-31-120721053559-phpapp02-thumbnail.jpg?width=640&height=640&fit=bounds)


