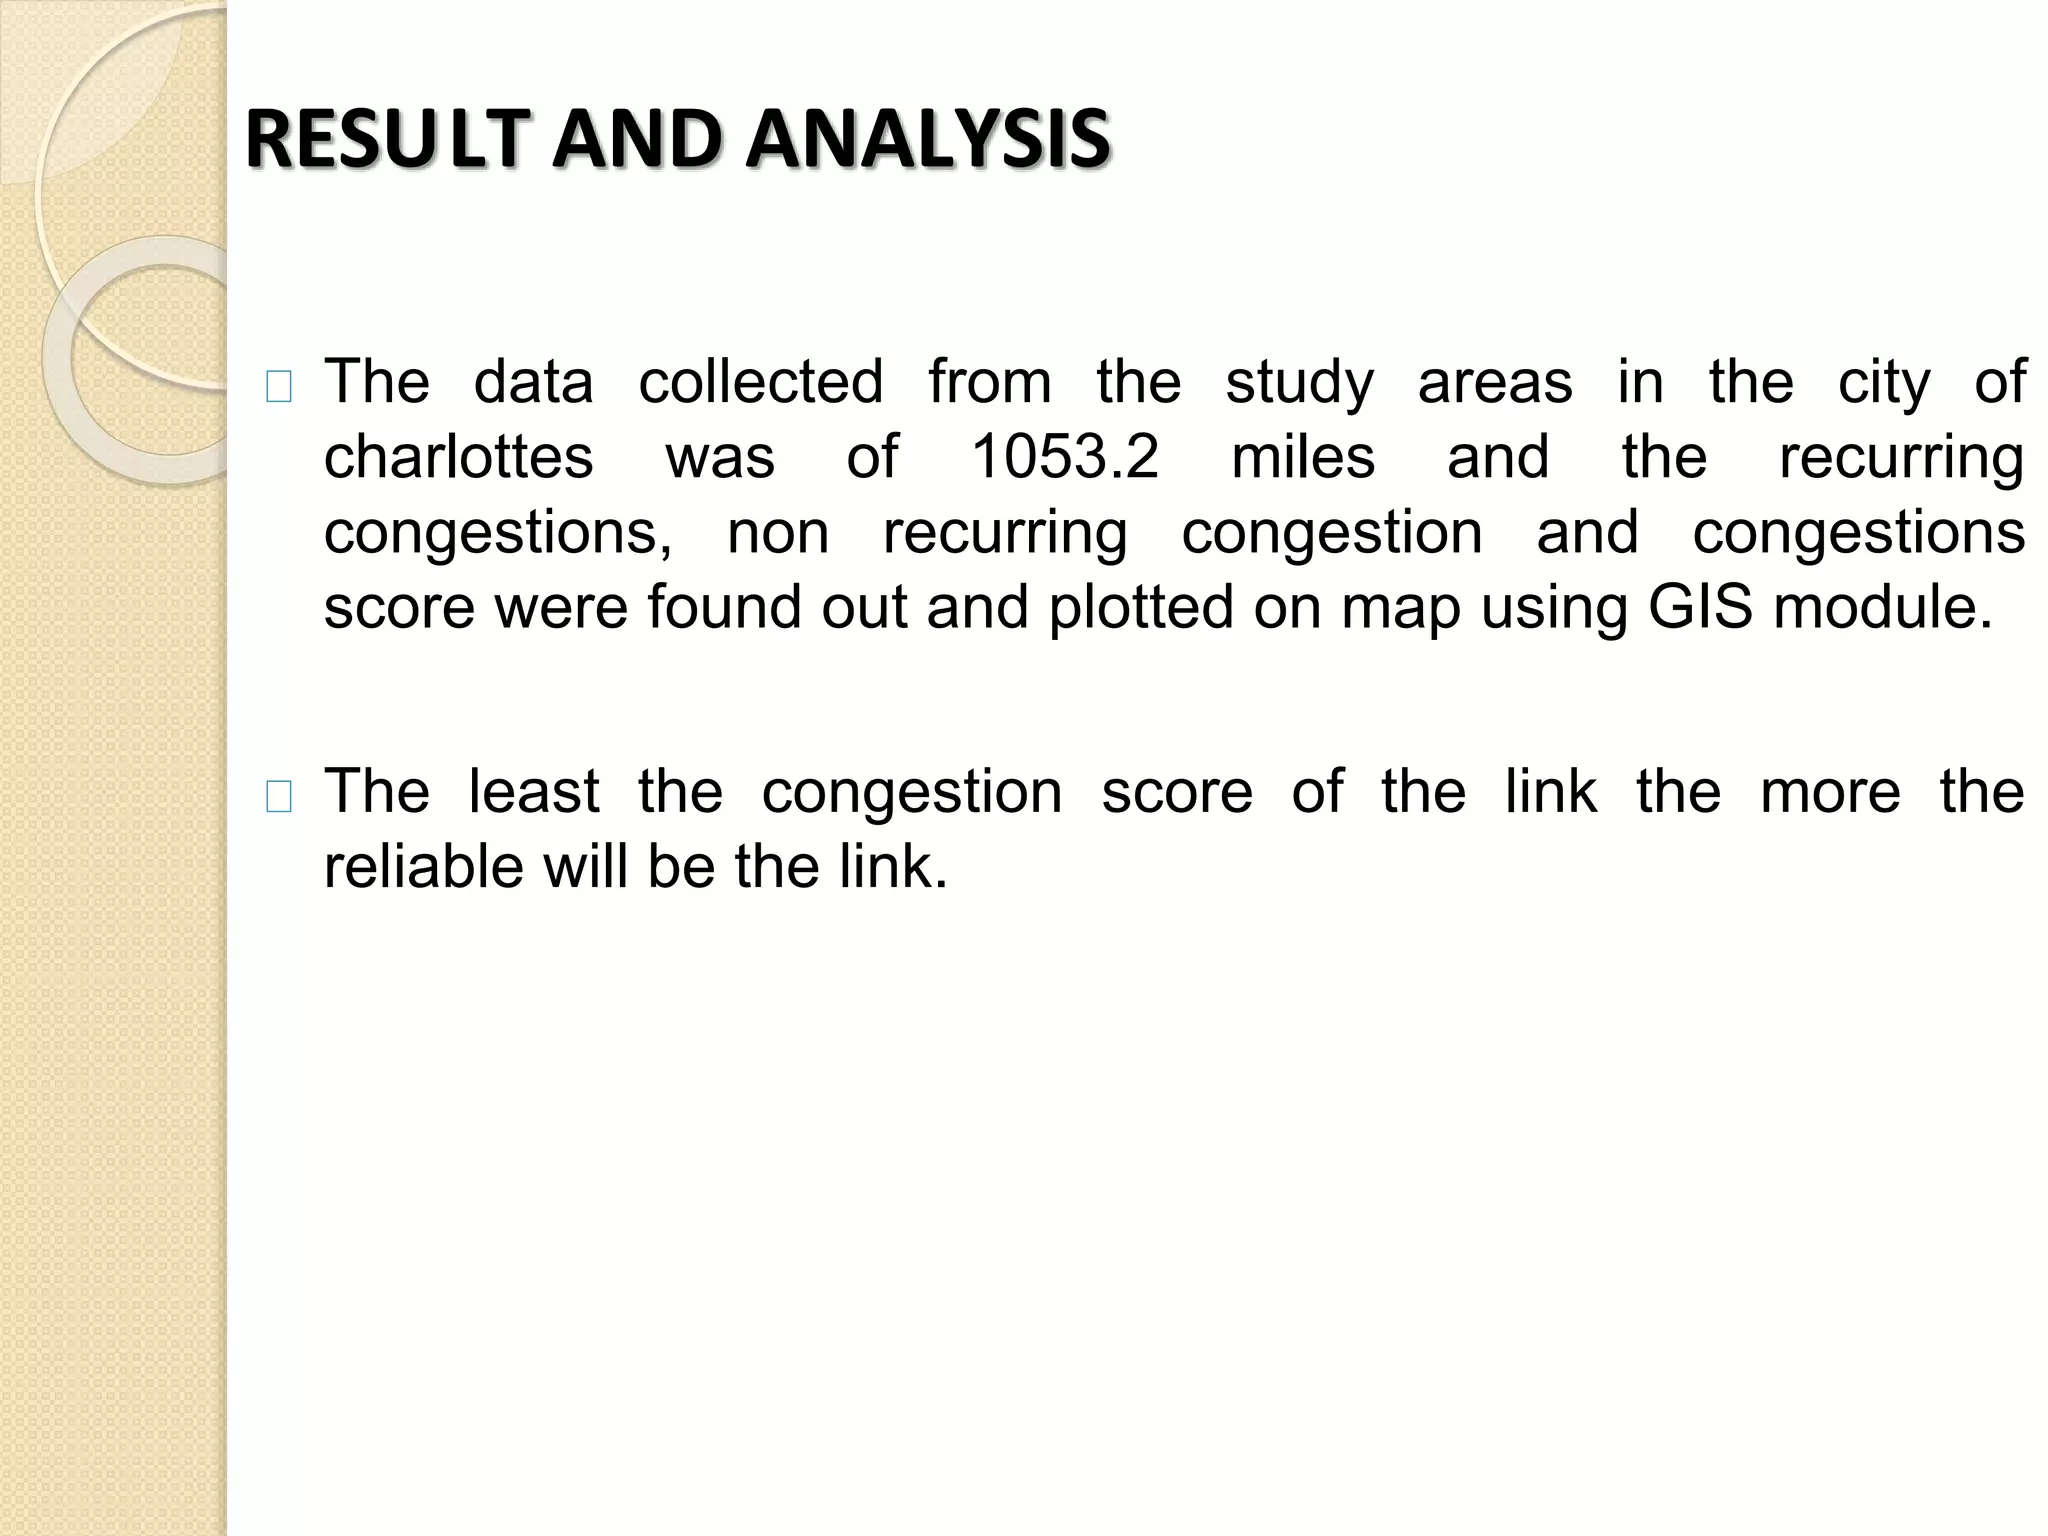
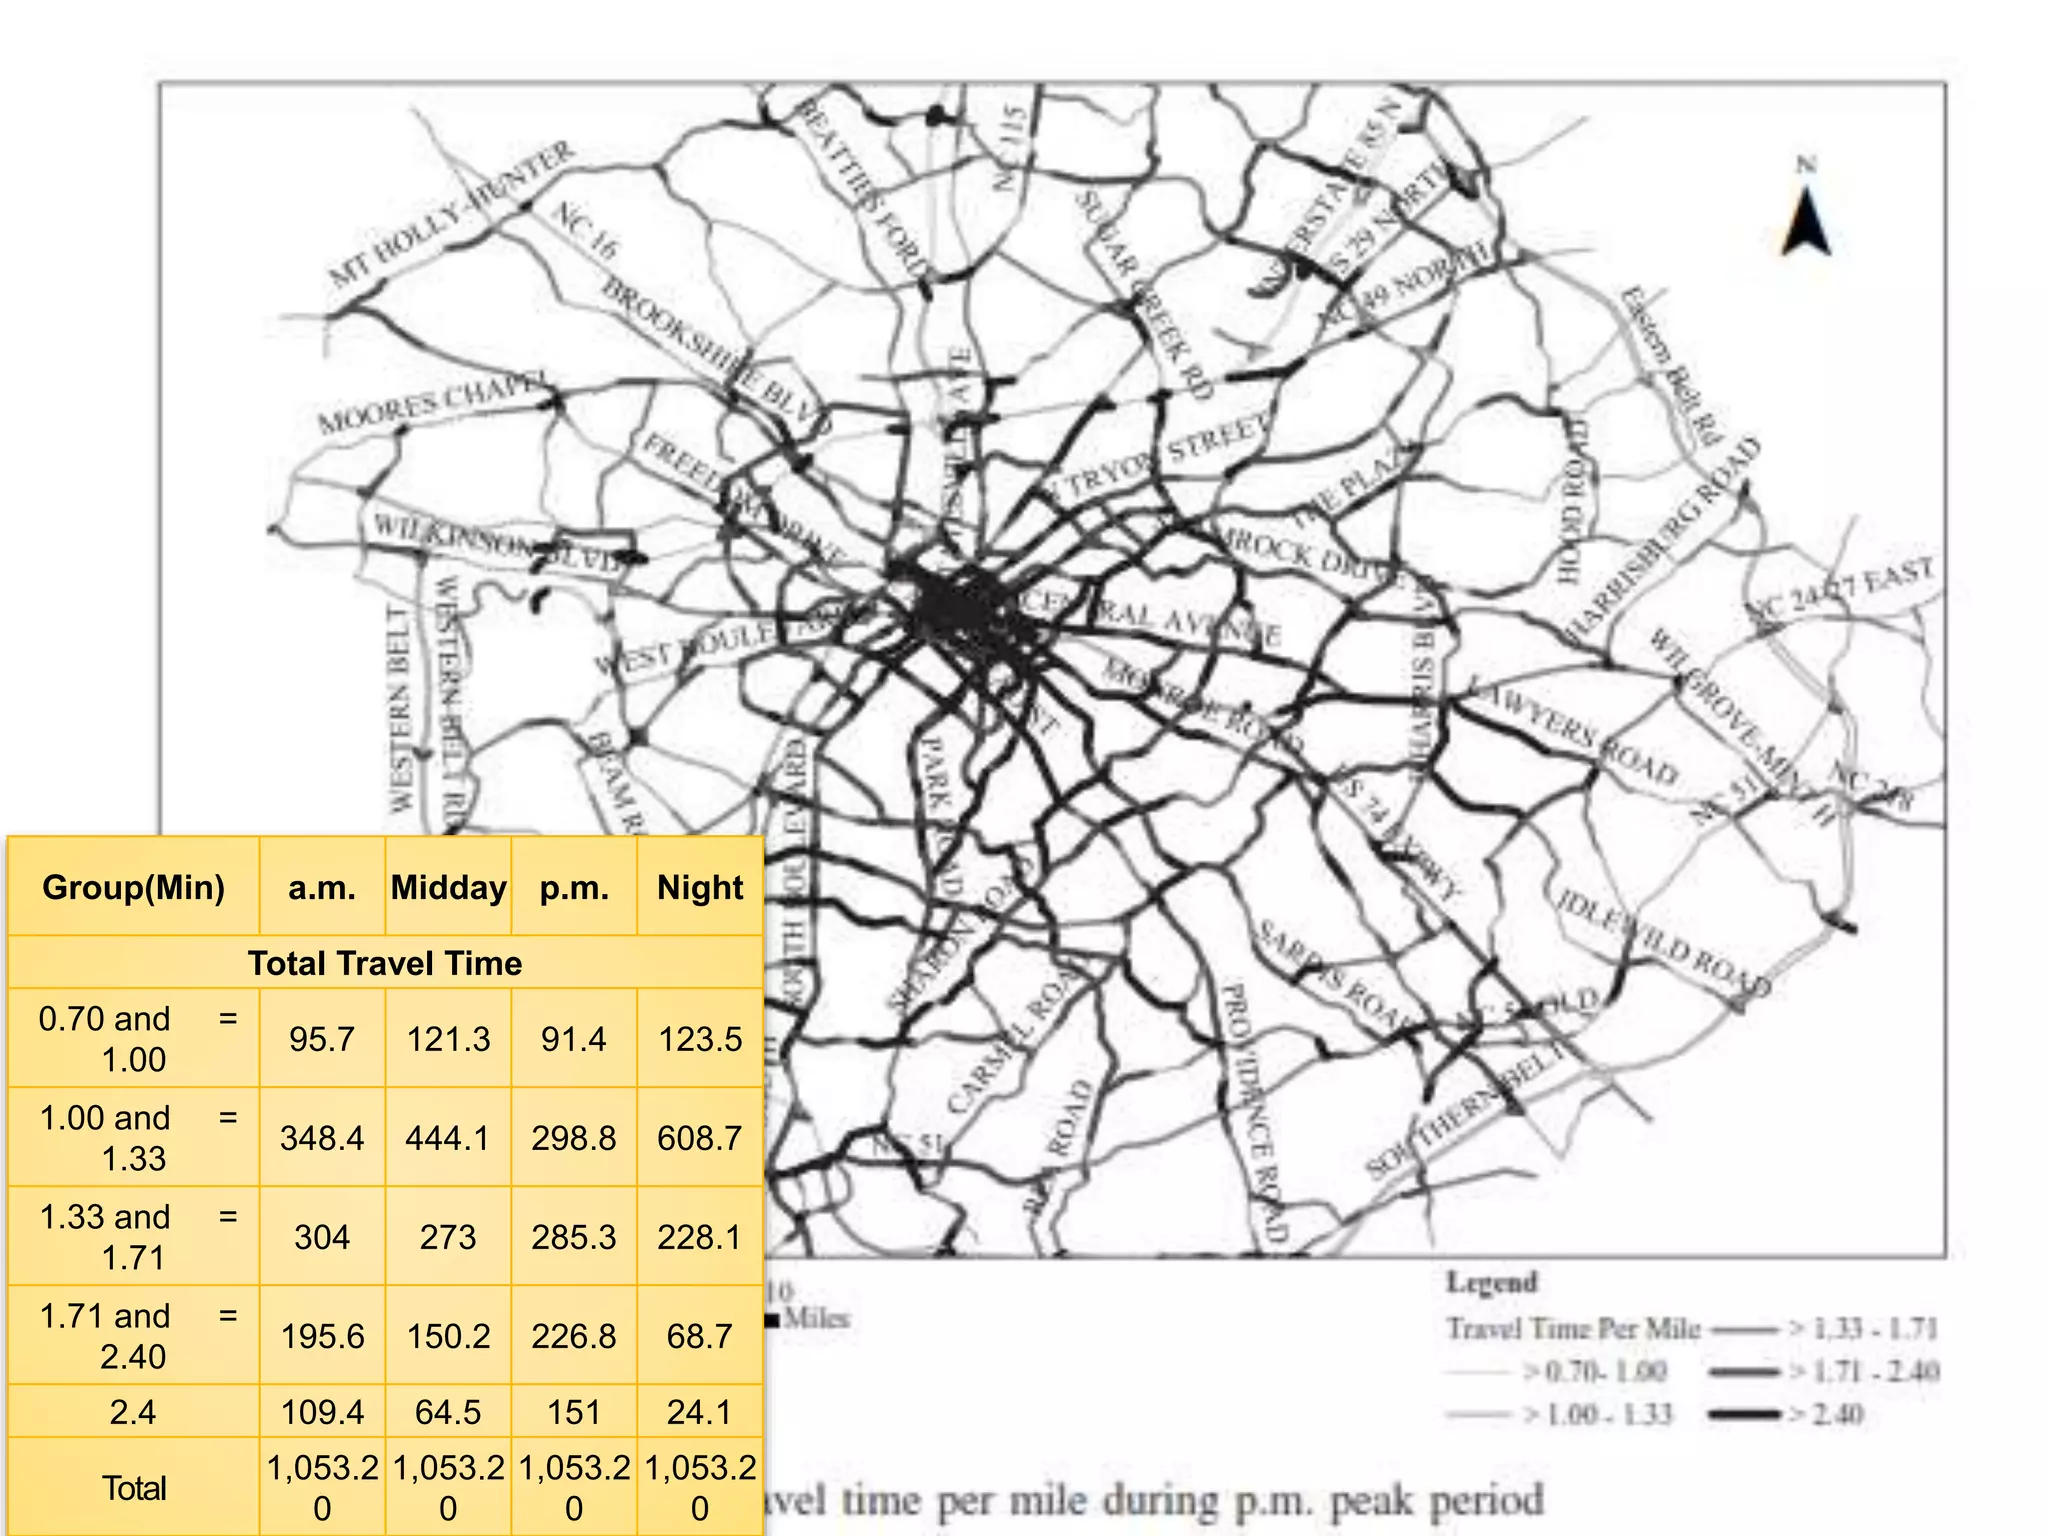
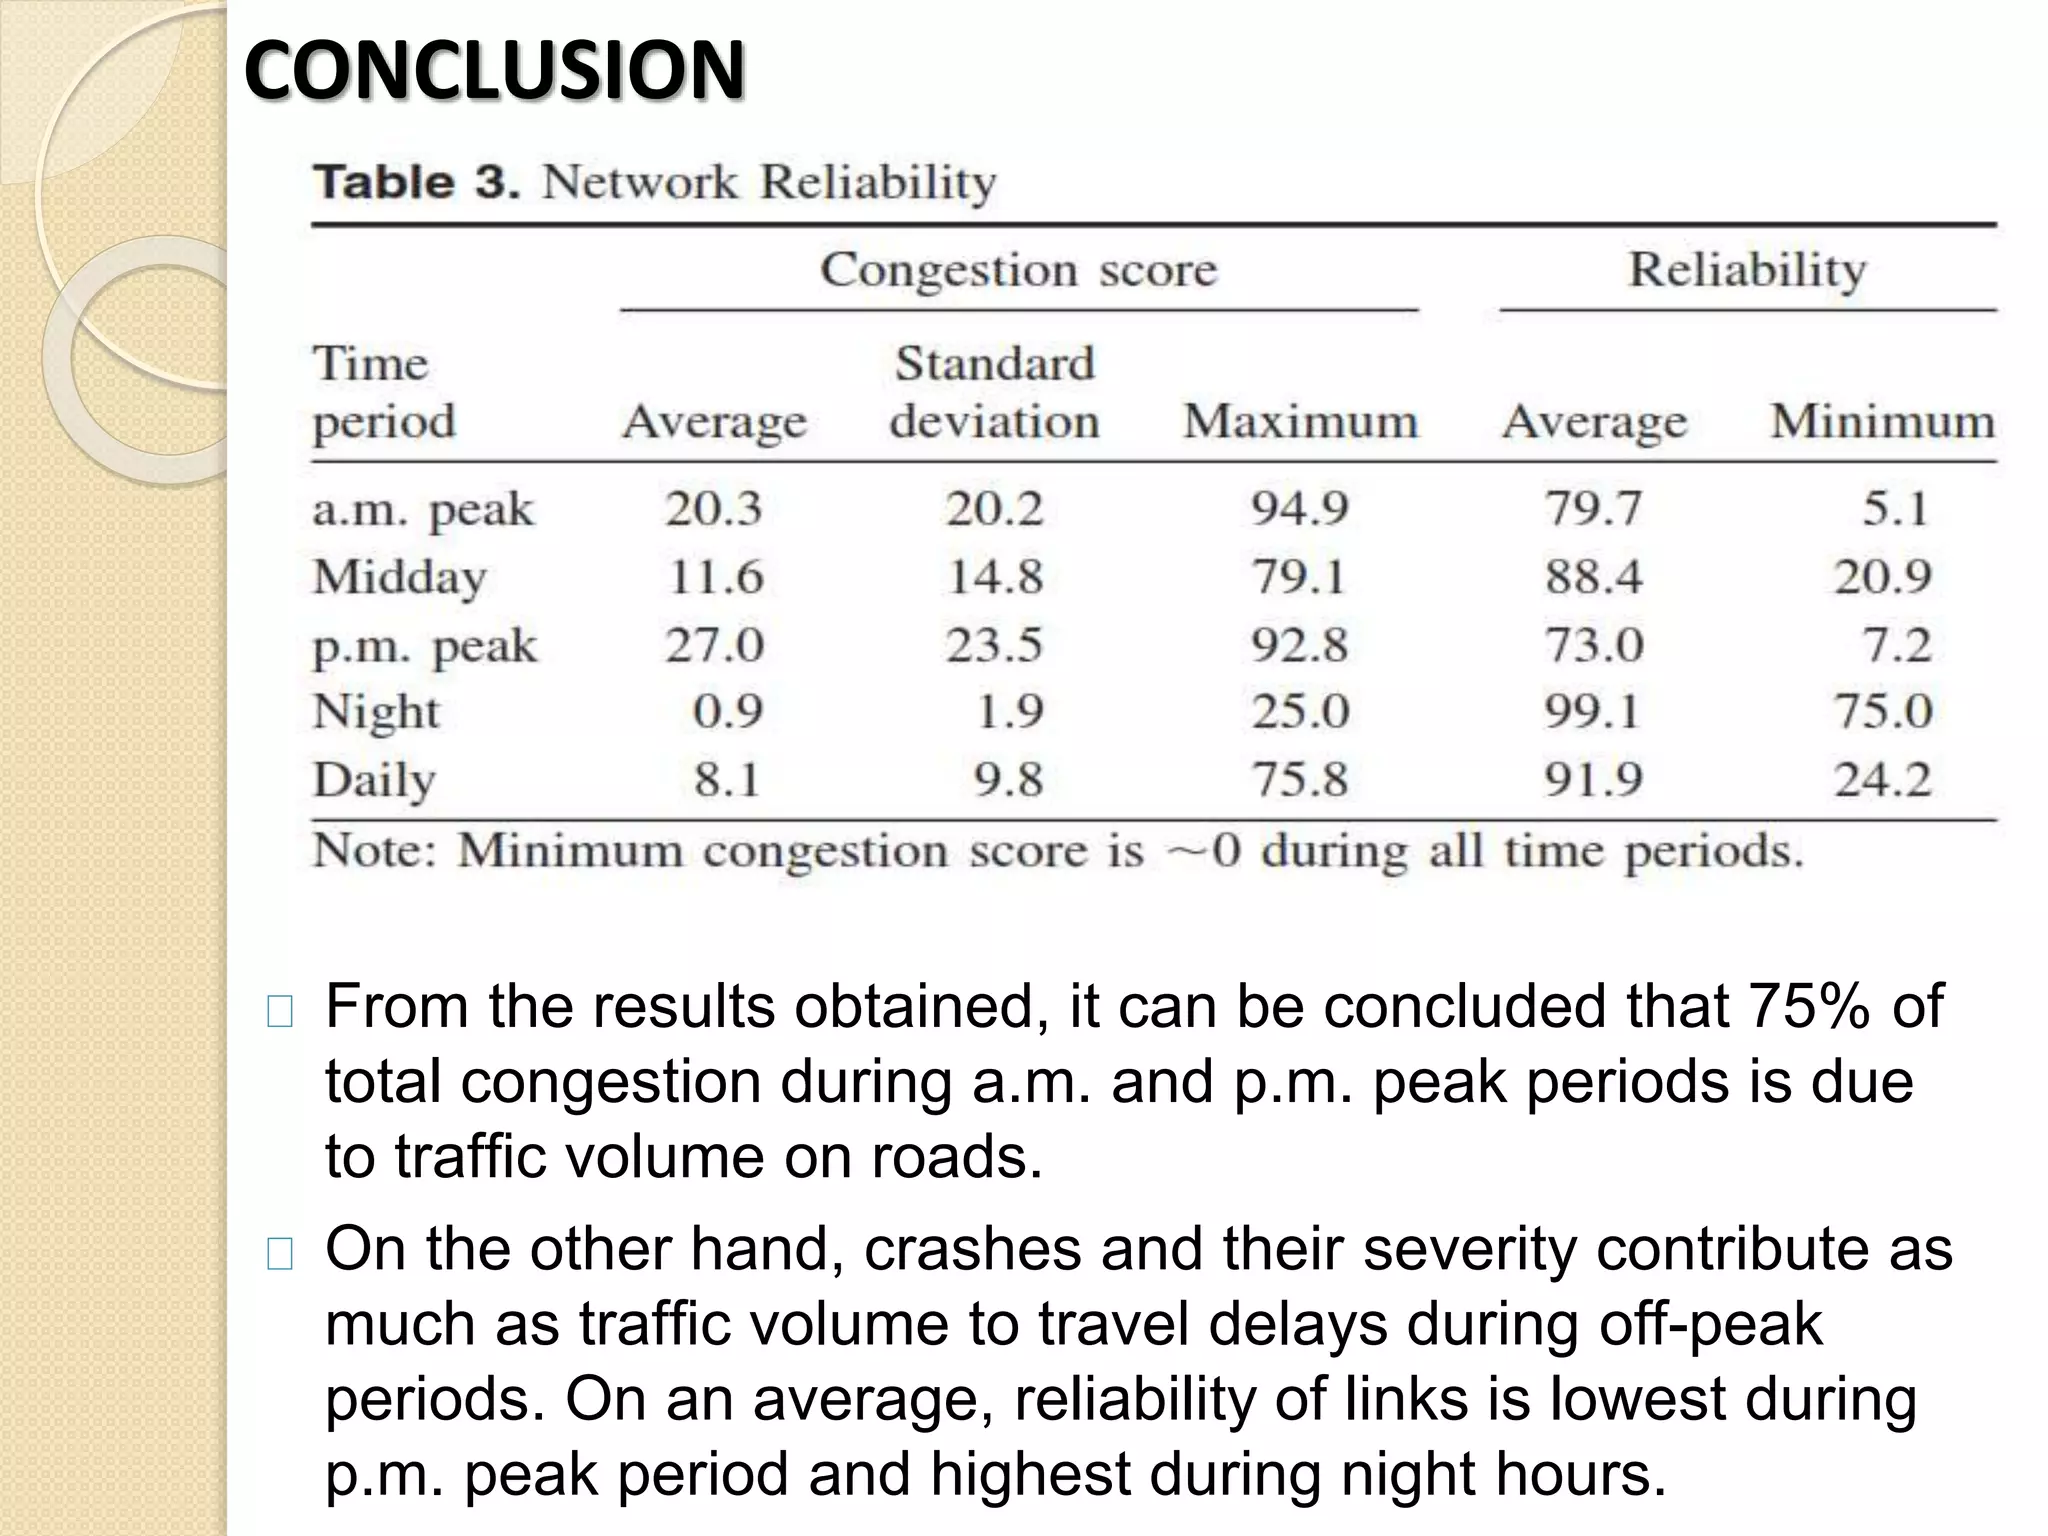
GUJARAT TECHNOLOGICAL 
UNIVERSITY 
BIRLA VISHWAKARMA 
MAHAVIDHYALAYA 
PAPER REVIEWED 
1. Assessment of Link Reliability as Function of Congestion 
components. 
KUSHALKUMAR G PATEL 
140080713009
Assessment of Link Reliability as a Function of 
Congestion Components 
This paper is written by Srinivas S. Pulugurtha, 
Associate Professor, Civil and Environmental Engineering 
dept., Univ. of North Carolina at Charlotte. & Nagaswetha 
Pasupuleti Graduate Student, Civil and Environmental 
Engineering, Univ. of North Carolina at Charlotte. 
This paper is part of the Journal of Transportation 
Engineering, Vol. 136, No. 10, October 1, 2010.
INTRODUCTION 
Increasing travel congestion has been a growing concern to 
engineers and planners of the states’ DOT, responsible local 
agencies, the general public and elected officials due to its 
impact on mobility and economy. 
Congestion, in general, reduces the capacity of the roadway 
and makes the traffic condition unstable. 
As congestion increases, reliability of travel becomes an 
increasingly important attribute for users of transportation 
networks
ABSTRACT 
The focus of this paper is to develop and illustrate the 
working of a geographic information systems GIS based 
methodology to estimate congestion and assess reliability of 
links on a road network considering both recurring and 
nonrecurring congestion components by time period of the 
day. 
The estimated reliability can be used to identify optimal travel 
paths and make better routing decisions 
For this research data collected was for the city of Charlotte 
in Mecklenburg County, North Carolina which are used to 
demonstrate the methodology.
LITERATURE REVIEW 
This paper is an extension of earlier efforts by the writers 
Pulugurtha and Pasupuleti in 2008, to address the limitations 
of past research by defining and estimating reliability of each 
link in the transportation network as a function of travel time 
variation and travel delay index due to crashes. 
Past research does not consider the effect of factors such as 
crashes related to nonrecurring congestion component 
along with recurring congestion component in estimating 
congestion and/or reliability for all the links on major roads in 
the transportation network.
METHODOLOGY 
The purposed methodology used to determine the travel time 
and travel delay due to crash recurring and non- recurring 
congestion include the following steps: 
◦ Data collection. 
◦ Estimate travel time and its variation under recurring congestion 
conditions. 
◦ Estimate travel delay due to crashes under nonrecurring 
congestion conditions. 
◦ Integrate congestion components to compute congestion 
score and reliability.
METHODOLOGY- Step: 1 Data collection 
Four different time periods were considered for research 
purpose in this paper: 
◦ AM Peak period - 6.30am to 9.30am 
◦ MIDDAY Off-peak period - 9.30am to 3.30am 
◦ PM Peak period - 3.30pm to 6.30pm 
◦ NIGHT Off-peak period – 6.30pm to 6.30am 
For calculating recurring congestions (RC) travel time and its 
variation data for each link requires link capacity, travel 
speeds, and traffic volumes for each time period. 
While for Non-recurring congestions (NRC) past crash data, 
temporary changes in networks and the delays related to it 
will be needed such historical data information will be 
available from local agencies. 
The Data was collected for total of 1053.2 miles in 
Charlotte city
METHODOLOGY- Step: 2 Estimate travel time 
and its variation under recurring congestion 
conditions. 
For calculating travel time equation by fundamental bureau of 
public roads was used. 
Once the travel time is known RC will also be determined 
from it by using the below equation.
METHODOLOGY- Step: 3 Estimate travel delay 
due to crashes under nonrecurring congestion 
conditions. 
NRC occurred in a particular link can be calculated by using 
the following equation: 
TYPE OF CRASH CRASH SEVERITY VALUE 
A FATAL 8 
B SEVERE 6 
C LESS SEVERE 3 
O(PDO) PROPERTY DAMAGE 
ONLY 
1
METHODOLOGY- Step: 4 To compute 
congestion score and reliability. 
Congestion score can be calculated by using the following 
series of equations:
METHODOLOGY- Step: 4 To compute 
congestion score and reliability. 
In the above equations we need to note that Maximum 
possible congestion for RC and NRC for any link is 100 
And the term WR & WNR are the weight(Importance) for the 
link has to be logically decided by looking over the link 
capacity and volume.
RESULT AND ANALYSIS 
The data collected from the study areas in the city of 
charlottes was of 1053.2 miles and the recurring 
congestions, non recurring congestion and congestions 
score were found out and plotted on map using GIS module. 
The least the congestion score of the link the more the 
reliable will be the link.
TRAVEL TIME OF EACH LINK 
Travel time value per unit distance mile is calculated for each 
link on selected major roads in the city of Charlotte, N.C. 
The links are classified into the following five groups based 
on their travel time per mile: 
0.70 (speed=85 mi / h) to 1.00 min (speed=60 mi / h) 
1.00 (speed=60 mi / h) to 1.33 min (speed=45 mi / h) 
1.33 (speed=45 mi / h) to 1.71 min (speed=35 mi / h) 
1.71 (speed=35 mi / h) to 2.40 min (speed=25 mi / h) and 
2.40 min (speed=25 mi / h)
Group(Min) a.m. Midday p.m. Night 
Total Travel Time 
0.70 and = 
1.00 
95.7 121.3 91.4 123.5 
1.00 and = 
1.33 
348.4 444.1 298.8 608.7 
1.33 and = 
1.71 
304 273 285.3 228.1 
1.71 and = 
2.40 
195.6 150.2 226.8 68.7 
2.4 109.4 64.5 151 24.1 
Total 
1,053.2 
0 
1,053.2 
0 
1,053.2 
0 
1,053.2 
0
Group(Min) a.m. Midday p.m. Night 
Variation in travel time 
= 0 4.3 4.1 3.2 
1,053.2 
0 
5 and = 15 456.9 680.2 386.3 0 
15 and = 25 260.9 237.2 210.9 0 
25 and = 50 218.4 96.8 236.2 0 
50 112.7 34.9 216.6 0 
Total 
1,053.2 
0 
1,053.2 
0 
1,053.2 
0 
1,053.2 
0
TRAVEL DELAY INDEX DUE TO CRASH PER 
MILE 
Crash data were used to compute the travel delay index 
due to crashes per mile. A total of 18,782crashes (47 
fatal crashes, 6,202 injury crashes) and remaining are 
PDO crashes were reported during 2006 on the 
considered 1,053.2 center-lane miles. 
The number of crashes per mile per year is 
approximately 17.8 
The links in the road network were classified based on 
the travel delay index due to crashes per mile during a 
time period on a day into the following five groups: 
◦ 0.000 no crashes 
◦ 0.000 to 0.003 one crash during a day; 
◦ 0.003 to 0.008 two or three crashes during a day 
◦ 0.008 to 0.016 four to six crashes during day 
◦ 0.016 more than six crashes during a day
Group a.m. Midday p.m. Night 
Travel delay index due to crashes per mile 
0 571.5 480.6 499.1 487.3 
0.000 and = 
0.003 
42.7 52.7 53.4 42.4 
0.003 and = 
0.008 
139.6 133.3 145.4 148.7 
0.008 and = 
0.016 
131.5 116.6 117 140.7 
0.016 168 270 238.2 234.1 
Total 1,053.20 1,053.20 1,053.20 1,053.20
Group a.m. Midday p.m. Night 
Congestion score 
0 4.1 4.1 3.2 487.3 
0 and = 5 370.5 561.9 309.5 548.8 
5 and = 15 263.9 293.6 202.8 16.2 
15 and = 25 174.5 106.3 172.5 0.9 
25 240.2 87.2 365.2 0 
Total 1,053.20 1,053.20 1,053.20 1,053.20
CONCLUSION 
From the results obtained, it can be concluded that 75% of 
total congestion during a.m. and p.m. peak periods is due 
to traffic volume on roads. 
On the other hand, crashes and their severity contribute as 
much as traffic volume to travel delays during off-peak 
periods. On an average, reliability of links is lowest during 
p.m. peak period and highest during night hours.

Uts congestion components

  • 1.
    GUJARAT TECHNOLOGICAL UNIVERSITY BIRLA VISHWAKARMA MAHAVIDHYALAYA PAPER REVIEWED 1. Assessment of Link Reliability as Function of Congestion components. KUSHALKUMAR G PATEL 140080713009
  • 2.
    Assessment of LinkReliability as a Function of Congestion Components This paper is written by Srinivas S. Pulugurtha, Associate Professor, Civil and Environmental Engineering dept., Univ. of North Carolina at Charlotte. & Nagaswetha Pasupuleti Graduate Student, Civil and Environmental Engineering, Univ. of North Carolina at Charlotte. This paper is part of the Journal of Transportation Engineering, Vol. 136, No. 10, October 1, 2010.
  • 3.
    INTRODUCTION Increasing travelcongestion has been a growing concern to engineers and planners of the states’ DOT, responsible local agencies, the general public and elected officials due to its impact on mobility and economy. Congestion, in general, reduces the capacity of the roadway and makes the traffic condition unstable. As congestion increases, reliability of travel becomes an increasingly important attribute for users of transportation networks
  • 4.
    ABSTRACT The focusof this paper is to develop and illustrate the working of a geographic information systems GIS based methodology to estimate congestion and assess reliability of links on a road network considering both recurring and nonrecurring congestion components by time period of the day. The estimated reliability can be used to identify optimal travel paths and make better routing decisions For this research data collected was for the city of Charlotte in Mecklenburg County, North Carolina which are used to demonstrate the methodology.
  • 5.
    LITERATURE REVIEW Thispaper is an extension of earlier efforts by the writers Pulugurtha and Pasupuleti in 2008, to address the limitations of past research by defining and estimating reliability of each link in the transportation network as a function of travel time variation and travel delay index due to crashes. Past research does not consider the effect of factors such as crashes related to nonrecurring congestion component along with recurring congestion component in estimating congestion and/or reliability for all the links on major roads in the transportation network.
  • 6.
    METHODOLOGY The purposedmethodology used to determine the travel time and travel delay due to crash recurring and non- recurring congestion include the following steps: ◦ Data collection. ◦ Estimate travel time and its variation under recurring congestion conditions. ◦ Estimate travel delay due to crashes under nonrecurring congestion conditions. ◦ Integrate congestion components to compute congestion score and reliability.
  • 7.
    METHODOLOGY- Step: 1Data collection Four different time periods were considered for research purpose in this paper: ◦ AM Peak period - 6.30am to 9.30am ◦ MIDDAY Off-peak period - 9.30am to 3.30am ◦ PM Peak period - 3.30pm to 6.30pm ◦ NIGHT Off-peak period – 6.30pm to 6.30am For calculating recurring congestions (RC) travel time and its variation data for each link requires link capacity, travel speeds, and traffic volumes for each time period. While for Non-recurring congestions (NRC) past crash data, temporary changes in networks and the delays related to it will be needed such historical data information will be available from local agencies. The Data was collected for total of 1053.2 miles in Charlotte city
  • 8.
    METHODOLOGY- Step: 2Estimate travel time and its variation under recurring congestion conditions. For calculating travel time equation by fundamental bureau of public roads was used. Once the travel time is known RC will also be determined from it by using the below equation.
  • 9.
    METHODOLOGY- Step: 3Estimate travel delay due to crashes under nonrecurring congestion conditions. NRC occurred in a particular link can be calculated by using the following equation: TYPE OF CRASH CRASH SEVERITY VALUE A FATAL 8 B SEVERE 6 C LESS SEVERE 3 O(PDO) PROPERTY DAMAGE ONLY 1
  • 10.
    METHODOLOGY- Step: 4To compute congestion score and reliability. Congestion score can be calculated by using the following series of equations:
  • 11.
    METHODOLOGY- Step: 4To compute congestion score and reliability. In the above equations we need to note that Maximum possible congestion for RC and NRC for any link is 100 And the term WR & WNR are the weight(Importance) for the link has to be logically decided by looking over the link capacity and volume.
  • 12.
    RESULT AND ANALYSIS The data collected from the study areas in the city of charlottes was of 1053.2 miles and the recurring congestions, non recurring congestion and congestions score were found out and plotted on map using GIS module. The least the congestion score of the link the more the reliable will be the link.
  • 13.
    TRAVEL TIME OFEACH LINK Travel time value per unit distance mile is calculated for each link on selected major roads in the city of Charlotte, N.C. The links are classified into the following five groups based on their travel time per mile: 0.70 (speed=85 mi / h) to 1.00 min (speed=60 mi / h) 1.00 (speed=60 mi / h) to 1.33 min (speed=45 mi / h) 1.33 (speed=45 mi / h) to 1.71 min (speed=35 mi / h) 1.71 (speed=35 mi / h) to 2.40 min (speed=25 mi / h) and 2.40 min (speed=25 mi / h)
  • 14.
    Group(Min) a.m. Middayp.m. Night Total Travel Time 0.70 and = 1.00 95.7 121.3 91.4 123.5 1.00 and = 1.33 348.4 444.1 298.8 608.7 1.33 and = 1.71 304 273 285.3 228.1 1.71 and = 2.40 195.6 150.2 226.8 68.7 2.4 109.4 64.5 151 24.1 Total 1,053.2 0 1,053.2 0 1,053.2 0 1,053.2 0
  • 15.
    Group(Min) a.m. Middayp.m. Night Variation in travel time = 0 4.3 4.1 3.2 1,053.2 0 5 and = 15 456.9 680.2 386.3 0 15 and = 25 260.9 237.2 210.9 0 25 and = 50 218.4 96.8 236.2 0 50 112.7 34.9 216.6 0 Total 1,053.2 0 1,053.2 0 1,053.2 0 1,053.2 0
  • 16.
    TRAVEL DELAY INDEXDUE TO CRASH PER MILE Crash data were used to compute the travel delay index due to crashes per mile. A total of 18,782crashes (47 fatal crashes, 6,202 injury crashes) and remaining are PDO crashes were reported during 2006 on the considered 1,053.2 center-lane miles. The number of crashes per mile per year is approximately 17.8 The links in the road network were classified based on the travel delay index due to crashes per mile during a time period on a day into the following five groups: ◦ 0.000 no crashes ◦ 0.000 to 0.003 one crash during a day; ◦ 0.003 to 0.008 two or three crashes during a day ◦ 0.008 to 0.016 four to six crashes during day ◦ 0.016 more than six crashes during a day
  • 17.
    Group a.m. Middayp.m. Night Travel delay index due to crashes per mile 0 571.5 480.6 499.1 487.3 0.000 and = 0.003 42.7 52.7 53.4 42.4 0.003 and = 0.008 139.6 133.3 145.4 148.7 0.008 and = 0.016 131.5 116.6 117 140.7 0.016 168 270 238.2 234.1 Total 1,053.20 1,053.20 1,053.20 1,053.20
  • 18.
    Group a.m. Middayp.m. Night Congestion score 0 4.1 4.1 3.2 487.3 0 and = 5 370.5 561.9 309.5 548.8 5 and = 15 263.9 293.6 202.8 16.2 15 and = 25 174.5 106.3 172.5 0.9 25 240.2 87.2 365.2 0 Total 1,053.20 1,053.20 1,053.20 1,053.20
  • 19.
    CONCLUSION From theresults obtained, it can be concluded that 75% of total congestion during a.m. and p.m. peak periods is due to traffic volume on roads. On the other hand, crashes and their severity contribute as much as traffic volume to travel delays during off-peak periods. On an average, reliability of links is lowest during p.m. peak period and highest during night hours.