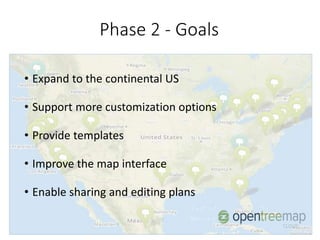
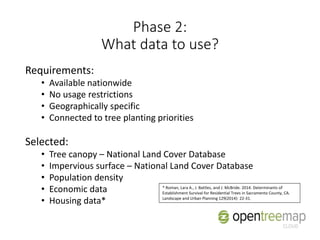
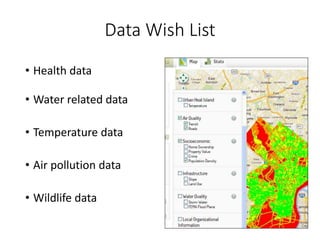
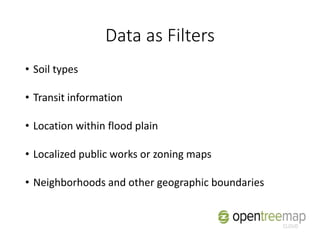
Download to read offline

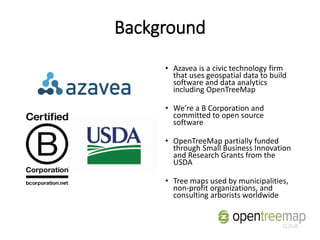


This document discusses Azavea's OpenTreeMap software for analyzing and planning urban forests. It describes Azavea's background in civic technology and geospatial data. OpenTreeMap allows users to model forest growth and prioritize tree planting locations using various data layers. The document seeks feedback on additional data sources and customization options to improve the software's modeling and scenario-building capabilities.