Download to read offline


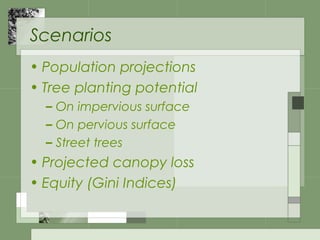

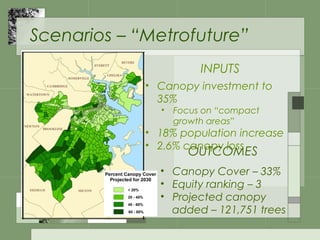


This document summarizes a study examining scenarios to achieve more equitable urban tree canopy distribution in Boston. It presents 5 potential scenarios: 1) Current Trends, 2) Metrofuture, 3) Grow Boston Greener, 4) Green Equity, and 5) All Trees. The Green Equity scenario achieved the most equitable distribution with a 39% canopy cover and equity ranking of 1 by focusing tree planting in environmental justice communities. However, the study found that true equity was not achieved and there is still room to increase Boston's overall canopy coverage to 40% through additional tree planting and other green infrastructure investments beyond trees alone.


