Download as PDF, PPTX

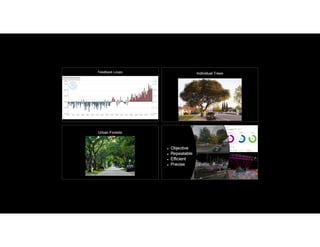
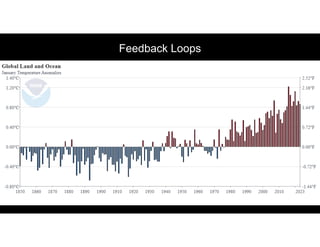
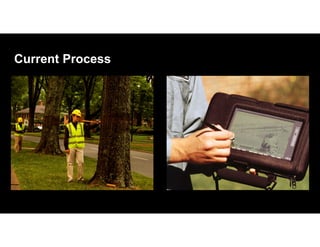
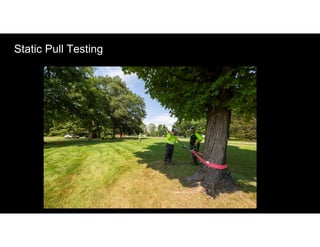
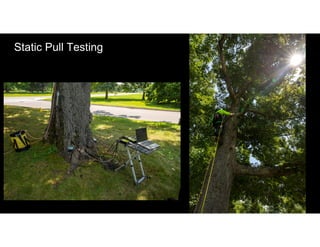
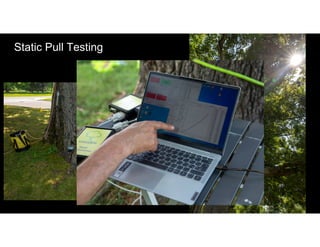
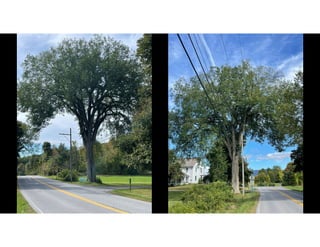
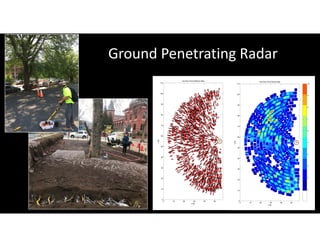
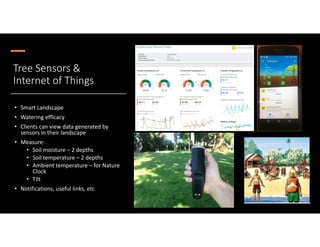
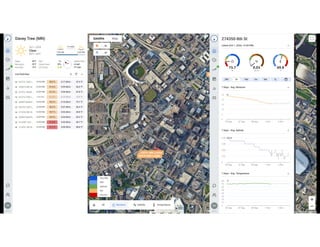
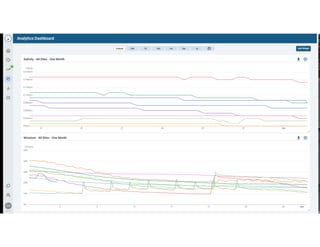
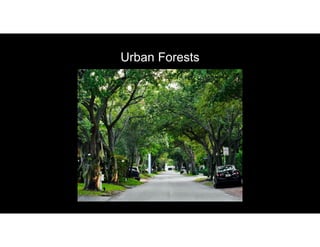
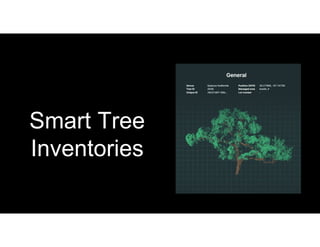
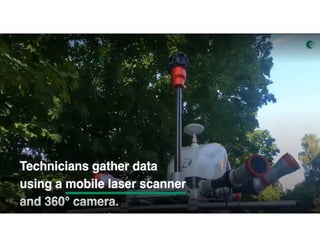
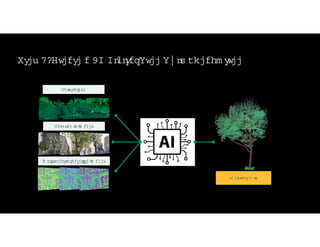
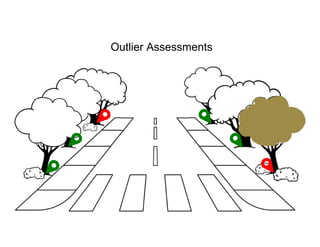
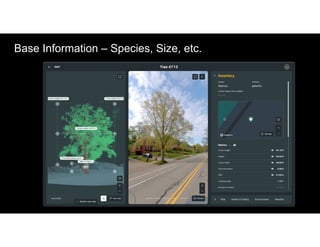
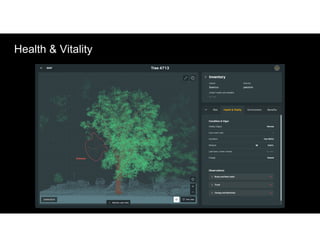
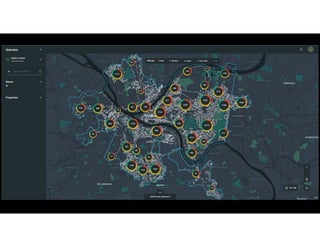
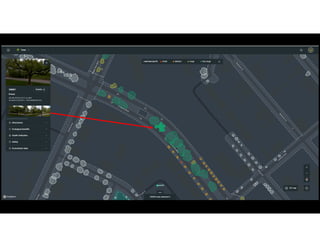
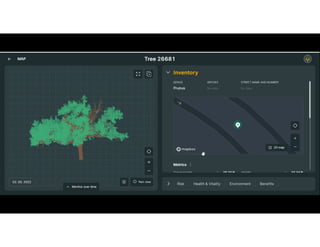
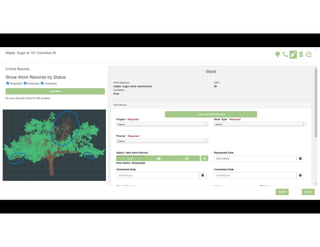

The document discusses leveraging technology to enhance urban forest resilience, focusing on data collection and analysis for tree health management. It emphasizes the use of smart landscape technologies, including sensors and digital twins, to monitor various environmental factors affecting trees. Additionally, the process involves identifying outliers for further assessment to improve overall urban forestry practices.


