Presented by Ian Hanou at the Trees, People, and Built Environment 3 Conference, Birmingham, England, April 2017. Geospatial mapping and analysis of the urban forest including tree inventories and Urban Tree Canopy (UTC) assessments have become commonplace tools in North America. Cities and environmental nonprofits use inventories to improve management and maintenance, and use UTC to develop a citywide benchmark, monitor change, inform master plans, and prioritize planting efforts to maximize benefits where they are lacking in the community. As a natural progression with recent GIS and mobile technology innovations, inventories and UTC data have been incorporated into online mapping programs to increase access to this information and ease-of-use for non-technical users.
Through a series of short case studies, this paper highlights some of the benefits, considerations, and impacts of bringing urban forestry data and prioritization tools into online mapping applications. Evidence suggests that such tools may increase awareness of the urban forest as an asset and a resource for community development, public health goals, and scenario planning. The collaboration that is created during an inclusive process to develop and implement such tools is discussed along with the role of tree professionals and nonprofits in UTC targets, followed by recommendations for practitioners.
MARC Sustainable Urban Forest Management WorkshopIan Hanou
This document summarizes a workshop presentation on sustainable urban forest management. The presentation covered defining sustainable urban forestry, gathering data through tree inventories and assessments, analyzing that data to identify needs and goals, and developing management plans and strategies. Software tools were also discussed for collecting, managing, and utilizing urban forestry data. The document provided examples of the types of data collected and how it can be analyzed and incorporated into management plans and reports.
ISM Environment Insights w/ Advanced Analytics - Data For GoodData For Good Regina
Manitoba Forage and Grassland Association
The project proponent Manitoba Forage and Grassland Association (MFGA) sought (1) to quantify the hydrologic effect of natural forage land use within the Assiniboine River Basin, and (2) to recommend land and water management practices that address various hydrologic issues present in the basin. Through ISM’s web-based delivery platform, highly technical hydrologic simulation results (provided by project partner Aquanty) are presented in a summarized and consumable format, intended for use by high level decision makers.
South Nation Conservation
South Nation Conservation (SNC) is a conservation authority responsible for watershed management outside of Ottawa, ON. In addition to having a need for a hydrologic understanding of their geography, SNC had a need for a full hydrologic forecasting platform to drive their business decisions. Daily ingestion of weather forecasts formed the foundational piece of this platform, giving SNC a continually updated prediction of potential hydrologic issues. ISM, Aquanty, and IBM’s The Weather Company partnered in this pioneering solution.
California Utility Company
ISM and IBM’s The Weather Company partnered to provide a predictive asset maintenance platform for a southern California energy utility. The client required real-time weather forecast models to be ingested, and fuel the prediction of “fire weather”, or places where wild fires are likely to occur. This allowed the client to identify which of their assets (power lines, sub stations, etc) may be at risk, and enables them to take proactive and preventive.
Assessing Renewable Energy Potential Using the Geospatial Toolkit (GsT): Appl...Worldwatch Institute
This webinar includes an overview and demonstration of the desktop-based Geospatial Toolkit and the web-based Enterprise Geospatial Toolkit. Participants will also learn how the Geospatial Toolkit was used in Vietnam to support the development of Thanh Hoa’s Green Growth Initiative.
The Geospatial Toolkit is a desktop-based application produced for individual countries or regions that allows data visualization and guided geospatial analysis of high-level renewable energy development issues (wind, solar, and/or biomass depending on data availability). The Geospatial Toolkit is designed for use by non-geospatial professionals, but also provides access to the geospatial layers for more advanced analysis. Geospatial Toolkits have been produced for several countries/regions in Asia, and around the world.
The Geospatial Toolkit is recognized as a valuable tool providing decision makers with the ability to visualize the renewable energy resources relative to their infrastructure and conduct guided, quantitative analysis of high-level renewable energy resource potential under different scenarios. It can be used to identify areas with large amounts of renewable energy resource potential and/or few barriers to development, allowing more efficient targeting of detailed site analysis needs. The desktop version of the Toolkit is an open-source application, packaged with public data to allow widespread access to the application. Recently a web-based version, the Enterprise Geospatial Toolkit, has been developed, improving access to more spatially and temporally detailed datasets for analysis within the application and externally, improving performance, and providing access to enhanced analysis capabilities.
Speakers:
Jon Duckworth, National Renewable Energy Laboratory (NREL)
Donna Heimiller, National Renewable Energy Laboratory
Khanh Nguyen, USAID Low Emission Asian Development (LEAD) Program Country Coordinator
Moderators:
Sandra Khananusit, Asia LEDS Partnership Secretariat
Alexander Ochs, LEDS GP Energy Working Group
The document discusses linking PEPFAR reporting data to geographic information systems (GIS) to improve health programs in Kenya's Nyanza province. It describes how M&E officers were trained to link PEPFAR data to GIS datasets to produce maps showing counseling and testing uptake. These maps revealed areas with low uptake and informed interventions to address challenges. Comparing maps from before and after interventions showed improvements in many sites, demonstrating how data visualization through GIS can help evaluate programs and guide decision making.
Improving Efficiency in Data Collection for Urban Development Plans through I...Muhammad Qadeer
Improving Efficiency in Data Collection for Urban Development Plans through Information & Communication Technology,
Research paper presented in International Conference on Town Planning and Urban Management (ICTPUM2014)
The document discusses Brazil's trilateral South-South cooperation initiative to establish reference centers in Africa for census data collection using electronic methods. The initiative aims to strengthen capacities of African statistical institutions for conducting population censuses from 2017-2022. Brazil, through its experience with a digital 2010 census, will partner with UNFPA and statistics offices in Senegal, Cape Verde, and South Africa to develop training modules and establish these countries as reference centers to support other African countries' transition to electronic census data collection. The centers will help more countries on the continent strengthen statistics and data for public policy using Brazil's innovative approaches.
This document is a resume for Devansh Khakhar that outlines his education, work experience, projects, skills, and leadership experience. It shows that he has a Master's degree in Information Management from Syracuse University with a 3.7 GPA and relevant coursework and a Bachelor's degree in Computer Engineering from Mumbai University. For work experience, it lists two internships where he conducted analytics projects and determined supply chain improvements. It also outlines several academic projects where he built predictive models and data visualizations. It highlights his leadership as a graduate assistant and case competition lead at Syracuse University.
This document summarizes the key policies and initiatives around opening government data in Australia. It outlines the eGovernment and Digital Economy Policy from 2013 which aims to publish high-value public data and seek public-private partnerships using big data. It also discusses the Gov 2.0 Taskforce Report from 2009 which established principles like declaring open government and using Creative Commons licenses. The document then reviews the benefits of open data like increased transparency, innovation, and improved government services. It highlights data.gov.au as the platform for publishing and accessing Australian government data and discusses some challenges around privacy, skills, and changing culture. Finally, it promotes events like GovHack to showcase uses of open data and encourage collaboration.
National statistical systems are being called upon to enhance their contribution to fill data gaps and produce consistent statistics to describe issues related to sustainable development and disaster risk reduction. This will involve statistical domains like the environment, the economy, and society. Guidelines and standardization across frameworks like the SDGs and Sendai Framework are needed. National statistical offices have an important role to play in areas like collecting disaster-related data, providing technical assistance, and publishing statistics on extreme events and disasters to support monitoring of international agreements. For countries to make progress, statistical capacity must be strengthened through collaboration across data producers and alignment with official statistics.
Ta5.10 schmidt.integrating human rights with collection and dissmemination st...Statistics South Africa
The document discusses integrating human rights into statistics in South Africa. It recommends moving from survey-based organization to organizing statistics around themes, and establishing a unit focused on marginalized groups. This would increase participation, transparency, and understanding of user needs. It also discusses measuring human rights to comply with international agreements South Africa has signed. The governance survey is used as an example, noting it includes questions on discrimination, rights knowledge, and democracy perceptions with disaggregation by attributes like gender, disability and ethnicity. While progress has been made, further participation at the community level and formalizing research ethics are areas for additional growth.
Sheffield why open data matters to local government officers - tim adams lgaLG Inform Plus
Presentation given by Tim Adams Local Government Association LGA LG Inform Plus programme manager on the importance of open data to public sector officers and to local government policy. Given at Sheffield City Open Data Event - 10-July-2015
The Expert Group on Disaster-related Statistics in Asia and the Pacific was formed to improve disaster risk reduction statistics through sharing best practices and pilot studies. The group is drafting a Disaster-related Statistics Framework to address the need for standardized and harmonized methods for collecting and reporting data on disaster risks, occurrences, and impacts. The framework is being tested in several countries and the group will finalize documentation, case studies, and recommendations before presenting a version 1.0 of the framework for review and concluding its work in 2018.
Devansh Khakhar is a graduate student pursuing an MS in Information Management and a Certificate of Advanced Study in Data Science from Syracuse University. He has work experience as a Lean Consultant and Business Technology Analyst Intern. He is currently a Graduate Assistant and the Project Lead for the IM Case Competition. Devansh has strong skills in project management, business analysis, and data visualization tools. He has conducted various academic projects involving predictive modeling, process automation implementation, and data visualization.
Custom Tools for Urban Forestry Nonprofits and Outreach July 12, 2016Chris Peiffer
Learn about the Urban Forest Cloud from the PA Horticultural Society, the PlantMOreTrees tool by the Forest ReLeaf of Missouri, and the BranchOut Campaign the City of Columbus, Ohio. Watch the recording here: http://www.anymeeting.com/planitgeopro/E953D98183473E
A Decision Support System for the Design and Evaluation of Durable Wastewater...AM Publications
To develop the waste water solutions challenging task. To design sustainable wastewater solution requires information about new ideas, new systems and latest technology. Generally it is assumed that, decision making needs to involve field experts and engineers to define values and brainstorms solution. This paper describes a decision support system model that is designed to help community planners to identify the solution which balance the environmental, economic and social needs. System will be scalable, adaptable and flexible. Our decision support system will take modular description of components and description of community constraints, suggest the design of alternative waste water system, and facilitates evaluating how well each design satisfies the given constraints. Decision support system will give alternatives with visualization of the effect of various trade-offs and their effect in the relation of the community’s goals.
Digital4Climate-Leveraging Digital innovations & data for climate action Soren Gigler
How can digital innovations support climate action. Moving from digial technologies being the problem to contributing towards the fight agains climate change. This presentation provides an overview of the BMZ-supported digital and green transformation programs from around the world. Digital technologies and data can make a differnce, however it needs to be given a purpose and fit the needs of people, local communities and the planet.
Stephen Passmore and Peter Head of The Ecological Sequestration Trust are joined by Bob Bishop of the International Centre for Earth Simulation to discuss there pioneering project creating Global to Local Scale, Human, Economic, Ecological, Systems Models
Smarter Water and Smarter Sustainable Dubuque | 2013 Loras College Business A...Cartegraph
Loras College is proud to present our annual Business Analytics Symposium on March 27, 2014 at the Grand River Center in Dubuque, IA. Industry experts will share their insights about the evolving field of business analytics opportunities. Learn about everything from best practices when analyzing data to the importance and benefits of building a culture of analytics within your organization.
To learn more, secure your seat or to take advantage of group discounts visit www.loras.edu/bigdata.
Enabling the Digital and Green Twin Transition Soren Gigler
The document discusses several initiatives aimed at enabling a "twin transition" between green and digital transformation. It describes programs that leverage digital technologies like AI, blockchain, and IoT to enhance sustainability and address climate change through innovations in areas like renewable energy, agriculture, and waste management. The initiatives seek to commercialize cleantech solutions, shape digital transformation in an environmentally friendly way, and harness digital potential to achieve climate goals through a combination of knowledge sharing, pilot projects, and multi-stakeholder partnerships.
By Sander Janssen, Research Team Leader of Earth Observation and Environmental Informatics at Alterra, Wageningen UR,
12 April 2017- 14:00 CET
--The webinar was held as part of ASIRA (Access to Scientific Information Resources in Agriculture) Online Course for Low-Income Countries--
This presentation focus on the political context of open data publishing, methodological frameworks for estimating the impacts of open data and highlight the Open Data Journal for Agricultural Research as publication channel for open data sets. It will also build on personal reflections on publishing open data from Dr. Janssen’s own research career.
For more on the topic: http://aims.fao.org/activity/blog/join-free-webinar-publishing-open-data-agricultural-research
FCA resilience.io Platform:
Resource Economic Human Ecosystem
Modelling Platform Prototype
Foster Mensah
Centre for Remote Sensing and Geographic Information Services (CERSGIS)
University of Ghana
Rachael Kemp, Future Earth Ltd
Stephen Passmore, The Ecological Sequestration Trust
Koen H. van Dam and Harry Triantafyllidis
Department of Chemical Engineering
Imperial College London, UK
6 August 2015
EOR Webinar PAS presentation slidesFINAL.pptxPAS_Team
The document discusses a consultation webinar held by the Planning Advisory Service on environmental outcome reports. It provides an overview of the Planning Advisory Service and their work supporting local planning authorities. It then summarizes the webinar which included presentations on the government's plans for introducing environmental outcome reports to replace current environmental assessment processes, and experiences from Surrey County Council and Hampshire County Council conducting environmental monitoring.
This document summarizes a conference presentation on using crowdsourcing approaches like volunteered geographic information (VGI), citizen science (CS), and participatory mapping (PM) to engage the public in policymaking. It defines these approaches and provides examples. While governments have been reluctant to use crowdsourced data due to quality and legal concerns, the presenters argue that capitalizing on established crowdsourcing models and open data practices could help develop public policies to formally incorporate crowdsourcing into government decision-making and engagement. Recommendations are provided for overcoming barriers and assuaging government adoption of these approaches.
Webinar by Stephen Passmore (The Ecological Sequestration Trsut) and Rembrandt Koppelaar (IIER/ICL) that will explain the http://resilience.io platform focusing on its core capability in providing cross-sector decision support for a city and its hinterland.
We will provide an overview of how the resource-economic simulation model operates and provides the evidence in city region decision-making for investment, procurement, policy making, and planning, to achieve more resilient solutions. We will focus on the interconnections between resource flows from human and ecological agents as well as the socio-economic activity of people and companies, and how these deliver regional outputs.
Areas that we will be addressing include:
Resource flows and socio-economic model interconnections.
Links to planning, procurement, policy making, and investment decisions.
Data acquisition, maintenance, and sharing cross-sector and regional interdependencies.
Crowdsourcing involves breaking large tasks into smaller pieces that can be completed by members of the general public, often online. It provides benefits like lower costs, greater scale and access to citizen data. However, it also faces challenges like ensuring data quality and sustained participation. Well-designed projects and engagement are needed to motivate crowds and address issues. Quality assurance processes are important to build trust in citizen science.
Data ecosystems: turning data into public valueSlim Turki, Dr.
Africa Information Highway Live Exchange #Session 7
8 October 2021
The AIH Live Exchange between the Africa Information Highway Team, partners and countries is a free monthly webinar hosted by the African Development Bank to discuss topics related to government data and statistics. This webinar series is the main platform for countries to share their experiences and best practices around open data including using their Open Data Platform of the AIH.
This session is co-organized with the Luxembourg Institute of Science and Technology (LIST) which is a mission-driven Research and Technology Organization (RTO) that develops advanced technologies and delivers innovative products and services to industry and society. These innovations can also be used to solve several societal challenges, particularly in the areas of the environment, security, education and culture, sustainable development, as well as the efficient use of resources.
Official statistical data are recognized as high-value datasets for the society and economy, to enrich research, inform decision making or develop new products and services. The use of these authoritative data sources contributes to building a society with more empowered people, better policies, more effective and accountable decision-making, greater participation and stronger democratic mechanisms.
Official statistics are produced to be used and re-used to make an impact on society through a higher degree of openness and transparency while ensuring confidentiality and, at the same time, providing equal access to information to citizens.
The value of data lies in its use and re-use. In this interactive webinar, you will learn new techniques to improve the use and re-use of your statistical data, going beyond the provision logic and adopting the ecosystem mindset. You will:
● Sharpen your capacity at identifying and engaging users and re-users and stakeholders (data ecosystem mapping)?
● Effectively tackle technical and organizational barriers to stimulate data use and re-use?
● Smartly orchestrate a self-sustainable data ecosystem to increase the impact of statistical data.
This session is an opportunity for Regional members countries to '' Sharpen their skills in making data used and re-used by developing an ecosystem mindset to effectively build sustainable community of users around their Open Data Platform thus promoting transparency and better decision-making”
The HDR Regenerative Design Framework is a new way of thinking that breaks existing design paradigms and creates net positive buildings through social and ecological systems thinking.
Using the Urban Forest Sustainability and Management Audit to Develop Program...Plan-It Geo, LLC
The webinar covered using the Urban Forest Sustainability and Management Audit (UFSMA) to develop urban forestry program goals and strategies. The UFSMA is an assessment approach developed by USDA Forest Service to evaluate and plan urban forestry programs. It involves gathering documents, conducting interviews, evaluating 11 categories related to policies, funding, inventories, and more. This information is used to identify issues, set goals and criteria, and develop an adaptive management plan. The webinar provided an overview of the UFSMA process and resources available to help communities implement the audit.
Presentation at the 5th Global Science Conference on Climate-Smart Agriculture.
Title: Designing climate knowledge networks to link research with agricultural professionals and producers for timely action
Speaker: Caitlin Corner-Dolloff
Microbial characterisation and identification, and potability of River Kuywa ...Open Access Research Paper
Water contamination is one of the major causes of water borne diseases worldwide. In Kenya, approximately 43% of people lack access to potable water due to human contamination. River Kuywa water is currently experiencing contamination due to human activities. Its water is widely used for domestic, agricultural, industrial and recreational purposes. This study aimed at characterizing bacteria and fungi in river Kuywa water. Water samples were randomly collected from four sites of the river: site A (Matisi), site B (Ngwelo), site C (Nzoia water pump) and site D (Chalicha), during the dry season (January-March 2018) and wet season (April-July 2018) and were transported to Maseno University Microbiology and plant pathology laboratory for analysis. The characterization and identification of bacteria and fungi were carried out using standard microbiological techniques. Nine bacterial genera and three fungi were identified from Kuywa river water. Clostridium spp., Staphylococcus spp., Enterobacter spp., Streptococcus spp., E. coli, Klebsiella spp., Shigella spp., Proteus spp. and Salmonella spp. Fungi were Fusarium oxysporum, Aspergillus flavus complex and Penicillium species. Wet season recorded highest bacterial and fungal counts (6.61-7.66 and 3.83-6.75cfu/ml) respectively. The results indicated that the river Kuywa water is polluted and therefore unsafe for human consumption before treatment. It is therefore recommended that the communities to ensure that they boil water especially for drinking.
Kinetic studies on malachite green dye adsorption from aqueous solutions by A...Open Access Research Paper
Water polluted by dyestuffs compounds is a global threat to health and the environment; accordingly, we prepared a green novel sorbent chemical and Physical system from an algae, chitosan and chitosan nanoparticle and impregnated with algae with chitosan nanocomposite for the sorption of Malachite green dye from water. The algae with chitosan nanocomposite by a simple method and used as a recyclable and effective adsorbent for the removal of malachite green dye from aqueous solutions. Algae, chitosan, chitosan nanoparticle and algae with chitosan nanocomposite were characterized using different physicochemical methods. The functional groups and chemical compounds found in algae, chitosan, chitosan algae, chitosan nanoparticle, and chitosan nanoparticle with algae were identified using FTIR, SEM, and TGADTA/DTG techniques. The optimal adsorption conditions, different dosages, pH and Temperature the amount of algae with chitosan nanocomposite were determined. At optimized conditions and the batch equilibrium studies more than 99% of the dye was removed. The adsorption process data matched well kinetics showed that the reaction order for dye varied with pseudo-first order and pseudo-second order. Furthermore, the maximum adsorption capacity of the algae with chitosan nanocomposite toward malachite green dye reached as high as 15.5mg/g, respectively. Finally, multiple times reusing of algae with chitosan nanocomposite and removing dye from a real wastewater has made it a promising and attractive option for further practical applications.
Improving the viability of probiotics by encapsulation methods for developmen...Open Access Research Paper
The popularity of functional foods among scientists and common people has been increasing day by day. Awareness and modernization make the consumer think better regarding food and nutrition. Now a day’s individual knows very well about the relation between food consumption and disease prevalence. Humans have a diversity of microbes in the gut that together form the gut microflora. Probiotics are the health-promoting live microbial cells improve host health through gut and brain connection and fighting against harmful bacteria. Bifidobacterium and Lactobacillus are the two bacterial genera which are considered to be probiotic. These good bacteria are facing challenges of viability. There are so many factors such as sensitivity to heat, pH, acidity, osmotic effect, mechanical shear, chemical components, freezing and storage time as well which affects the viability of probiotics in the dairy food matrix as well as in the gut. Multiple efforts have been done in the past and ongoing in present for these beneficial microbial population stability until their destination in the gut. One of a useful technique known as microencapsulation makes the probiotic effective in the diversified conditions and maintain these microbe’s community to the optimum level for achieving targeted benefits. Dairy products are found to be an ideal vehicle for probiotic incorporation. It has been seen that the encapsulated microbial cells show higher viability than the free cells in different processing and storage conditions as well as against bile salts in the gut. They make the food functional when incorporated, without affecting the product sensory characteristics.
RoHS stands for Restriction of Hazardous Substances, which is also known as t...vijaykumar292010
RoHS stands for Restriction of Hazardous Substances, which is also known as the Directive 2002/95/EC. It includes the restrictions for the use of certain hazardous substances in electrical and electronic equipment. RoHS is a WEEE (Waste of Electrical and Electronic Equipment).
Epcon is One of the World's leading Manufacturing Companies.EpconLP
Epcon is One of the World's leading Manufacturing Companies. With over 4000 installations worldwide, EPCON has been pioneering new techniques since 1977 that have become industry standards now. Founded in 1977, Epcon has grown from a one-man operation to a global leader in developing and manufacturing innovative air pollution control technology and industrial heating equipment.
Evolving Lifecycles with High Resolution Site Characterization (HRSC) and 3-D...Joshua Orris
The incorporation of a 3DCSM and completion of HRSC provided a tool for enhanced, data-driven, decisions to support a change in remediation closure strategies. Currently, an approved pilot study has been obtained to shut-down the remediation systems (ISCO, P&T) and conduct a hydraulic study under non-pumping conditions. A separate micro-biological bench scale treatability study was competed that yielded positive results for an emerging innovative technology. As a result, a field pilot study has commenced with results expected in nine-twelve months. With the results of the hydraulic study, field pilot studies and an updated risk assessment leading site monitoring optimization cost lifecycle savings upwards of $15MM towards an alternatively evolved best available technology remediation closure strategy.
Optimizing Post Remediation Groundwater Performance with Enhanced Microbiolog...Joshua Orris
Results of geophysics and pneumatic injection pilot tests during 2003 – 2007 yielded significant positive results for injection delivery design and contaminant mass treatment, resulting in permanent shut-down of an existing groundwater Pump & Treat system.
Accessible source areas were subsequently removed (2011) by soil excavation and treated with the placement of Emulsified Vegetable Oil EVO and zero-valent iron ZVI to accelerate treatment of impacted groundwater in overburden and weathered fractured bedrock. Post pilot test and post remediation groundwater monitoring has included analyses of CVOCs, organic fatty acids, dissolved gases and QuantArray® -Chlor to quantify key microorganisms (e.g., Dehalococcoides, Dehalobacter, etc.) and functional genes (e.g., vinyl chloride reductase, methane monooxygenase, etc.) to assess potential for reductive dechlorination and aerobic cometabolism of CVOCs.
In 2022, the first commercial application of MetaArray™ was performed at the site. MetaArray™ utilizes statistical analysis, such as principal component analysis and multivariate analysis to provide evidence that reductive dechlorination is active or even that it is slowing. This creates actionable data allowing users to save money by making important site management decisions earlier.
The results of the MetaArray™ analysis’ support vector machine (SVM) identified groundwater monitoring wells with a 80% confidence that were characterized as either Limited for Reductive Decholorination or had a High Reductive Reduction Dechlorination potential. The results of MetaArray™ will be used to further optimize the site’s post remediation monitoring program for monitored natural attenuation.
1. Putting Geospatial Assessment Tools to Use Online:
How Cities Prioritize Livability and Health Outcomes through the
Lens of Urban Forestry
TPBE3 | 06.04.17
www.planitgeo.com | info@planitgeo.com 1
Presented by:
Ian S. Hanou
Paper is in peer review by Cities and
the Environment (CATE) journal
2. Software: Urban Forest Cloud
• Web, mobile, and desktop
• Subscription and custom tools
• 100+ software clients/users
GIS/RS Canopy Analysis
Ecosystem Services Analysis / i-Tree
Tree Inventory & Risk Assessment
Management Plans
LiDAR Canopy Analysis
Technology & Trees
2www.planitgeo.com | info@planitgeo.com
Founded 2012, offices in CO, CA, PA, NC
3. Introduction / Agenda
www.planitgeo.com | info@planitgeo.com 3
Intro
Tech
Overview
Case
Studies
Summary
Intro
• The Geospatial Urban Forest … tree
inventory and Urban Tree Canopy (UTC) assessment
• Technology … achieve greatest return on
investment from efficiency to assess, manage, plan,
track, and monitor the urban forest
• Applications … outreach, manage, plan, monitor,
prioritize, track work and programs, visualize &
quantify oUTComes
• Case Studies … benefits, considerations, and impacts
of developing online urban forestry data and
prioritization tools; evolving roles & recommendations
4. An Explosion of Online Urban Forestry Tools
www.planitgeo.com | info@planitgeo.com 5
Intro
Tech
Overview
Case
Studies
Summary
Intro
• CanVis and C-CAP Land Cover Atlas (NOAA Digital Coast)
• Cool-Connect-Absorb (Trust for Public Land)
• UTC Mapper (Virginia Tech)
• Health Impact Assessment (US Environmental Protection Agency)
• Healthy Trees, Healthy Cities (The Nature Conservancy)
• i-Tree Suite (USDA Forest Service, Davey Institute, etc.)
• Open Tree Map (Azavea)
• STEW-MAP (Center for Neighborhood Technology/US Forest Service)
• Trees and Health (Portland State University)
• Urban Forest Cloud: Tree Plotter and Canopy Planner (Plan-It Geo)
Impact on outcomes …
change in culture and outreach …
recommendations for practitioners ...
5. Tree Inventories: Moving Online
www.planitgeo.com | info@planitgeo.com 6
Intro
Tech
Overview
Case
Studies
Summary
Intro
• 67% of U.S. cities have some inventory; 83% computerized
systems (Hauer, Peterson 2015)
• Collect, share, and analyze data from anywhere in real-time
• Public or private property (crowdsourced)
• Manage trees, planting activities, volunteers, work orders, and
UTC data without knowing you’re “doing GIS” (Hanou 2016)
6. Tree Canopy Assessment: Moving Online
www.planitgeo.com | info@planitgeo.com 7
Intro
Tech
Overview
Case
Studies
Summary
Intro
• Geospatial analysis of urban tree canopy (UTC) and potential planting
areas using LiDAR, multispectral imagery, and GIS inputs
• A key performance metric and indicator for environmental health
• Identify partners, funding, stewardship, needs, and priorities
• Majority of canopy/planting space on private land (O’Neil-Dunne 2009)
• Direct outreach, policy, and management for greatest impact on
community sustainability, equity, access, and environmental goals
“UTC prioritization works by matching known benefits of trees,
to places lacking those benefits, and then matches those
locations to organizations positioned to manage those issues
that trees help to ameliorate.” (Locke et al. 2013)
oUTComes
7. Tree Canopy Assessment Components
www.planitgeo.com | info@planitgeo.com 8
Intro
Tech
Overview
Case
Studies
Summary
Intro
Land cover mapping
Maps & Metrics
Reporting
Analysis Tools
8. Tech & Software Overview
www.planitgeo.com | info@planitgeo.com 9
• Software as a Service (SaaS)
• Browser and Cloud-based vs. Native App
• URL, no install or other GIS/GPS software
• Mobile (tablet/smartphone, on or offline)
• GIS and map-based
• Place tree / work order location on imagery
• Base maps to choose from
• No GPS required
• Open source technologies
• Administer users/permissions
• Open data sources/considerations
Intro
Tech
Overview
Case
Studies
Summary
Tech
Overview
9. Case Studies (CS #1-5)
www.planitgeo.com | info@planitgeo.com 10
Intro
Tech
Overview
Case
Studies
Summary
Case
Studies
10. CS #1: Baton Rouge Green
www.planitgeo.com | info@planitgeo.com 11
Intro
Tech
Overview
Case
Studies
Summary
Case
Studies
• Relationship b/w government and nonprofit
• >10,000 trees tracked in online map; share urban forest data
and quantify ecosystem services
• LADOTD highway ramp relocation; 110 crape myrtles, area
with low canopy. Had data and tool to show the values:
• Stormwater regulation (79,206 gallons/year), air pollution
removal (84 lbs./year), carbon storage (12,101 lbs.), and
carbon sequestration (5,660 lbs./year)
• Letter: advocating for smart development and appropriate
conservation of UTC; zero net loss and 3:1 replacement ratio
• BRG justified their role in protection/mitigation plans by
sharing their experience/qualifications using the tool
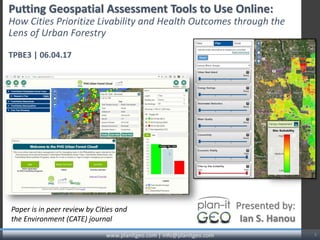
12. CS #2: Pennsylvania Horticultural Society
www.planitgeo.com | info@planitgeo.com 13
Intro
Tech
Overview
Case
Studies
Summary
Case
Studies
• Founded 1827, greening, education, plant and care for trees
• Programs: Tree Tenders, Plant One Million, riparian, tree giveaway, Tree
Checkers maintain, monitor, and report their tree health
• Tree and project data was historically managed and reported in 26
spreadsheets; cumbersome/tedious upkeep
13. www.planitgeo.com | info@planitgeo.com 14
Intro
Tech
Overview
Case
Studies
Summary
Case
Studies
• Streamline collecting/managing
tree health monitoring data and
new planting requests
• From paper forms or spreadsheets
smartphones or tablets
• More convenient for Tree Tenders
to sign-up neighbors
• Easier permit process w/City of
Philadelphia. In 1st season, 1/3 of
planting applications were via the
UFC
• Attach a photo while inspecting
trees in the field
• Central data location and standard
format
• Dashboard summarizes results,
species mix, health metrics, etc.
PHS Urban Forest Cloud: a browser-based map and database application
15. www.planitgeo.com | info@planitgeo.com 16
Intro
Tech
Overview
Case
Studies
Summary
Case
Studies
2015 Tree Canopy Assessment & Online Canopy Planner Tool
• U.S. Mayors Climate Protection Agreement (2007) and Green Team
• Greenspace Working Group (2012)
• Role of UTC in climate change and sustainability
• Est’d loss of 200,000 ash trees citywide (Emerald Ash Borer)
• Need for an outreach campaign and UTC goal
CS #3: Columbus, Ohio BranchOut Program
16. www.planitgeo.com | info@planitgeo.com 17
Intro
Tech
Overview
Case
Studies
Summary
Case
Studies
oUTComes: buy-in, collaboration, and a framework
Role of citizens, private property/partnerships
300,000 tree planting goal and 27% UTC goal
Site-specific tracking tools and landscape-scale
visualization of urban forest data online
Proactive management, need for defined standards
Watershed-scale assessment & planning
18. CS #4: Keep Indianapolis Beautiful
www.planitgeo.com | info@planitgeo.com 19
Intro
Tech
Overview
Case
Studies
Summary
Case
Studies
Phase 1: interactive hotspot & weighting app; overlay priorities on
where we’ve been planting; criteria well-vetted by diverse board
members; formulating a “health layer” is in-progress
• Increasing from 33% to 34% UTC requires 267,000 new shade trees
Phase 2: migrated KIB’s tree planting, volunteer, and project
management database to the cloud. All staff can now access tree,
project and volunteer data via tablet, not just GIS specialists.
Mission: to engage diverse communities to create vibrant public
places, helping people and nature thrive™
Background: 2006 hot spot priorities map: tree canopy, impervious
surfaces, industrial lands, traffic counts, childhood asthma, crime, and
income. Tracked plantings in GIS and stored nursery orders, projects,
and volunteer info in MS Access. New strategic tool to identify
overlapping initiatives, partners, be visible online, and educate. And
build social capital and “tree culture”!
19. www.planitgeo.com | info@planitgeo.com 20
Intro
Tech
Overview
Case
Studies
Summary
Case
Studies
Phase 1 example: the selection of priority criteria is a reflection of KIB’s mission
statement and purpose as an organization
20. CS #4: Keep Indianapolis Beautiful
www.planitgeo.com | info@planitgeo.com 21
Intro
Tech
Overview
Case
Studies
Summary
Case
Studies
Phase 2 example
21. CS #5: Portland State University: HtHp
www.planitgeo.com | info@planitgeo.com 22
Intro
Tech
Overview
Case
Studies
Summary
Case
Studies
• 2011 U.S. Forest Service, National Urban & Community Forestry Advisory
Council grant, “Healthy Trees, Healthy People” (HtHp)
• Identify canopy design to improve public health outcomes; quantify
benefits and role in addressing air pollution and urban heat
• 13 U.S. cities: land use, tree canopy, air pollution, and urban heat data
empirical relationship of canopy design & environmental stressors
• Developed spatially explicit online GIS tool
• Surveyed how professionals identify and prioritize planting and how an
online map may help
• Results informed the tool to help UF, planning, and health professionals
identify and prioritize sites benefiting historically underserved areas
22. www.planitgeo.com | info@planitgeo.com 23
Intro
Tech
Overview
Case
Studies
Summary
Case
Studies
View, weight (rank), and filter six
different criteria, including:
• % tree canopy cover
• Traffic-related air quality
• Urban heat island index
• % of residents < age 18
• % of residents > age 65
• % of residents living under
poverty level
Canopy 30-m National Land Cover
Database (NLCD) from the U.S.
Geologic Survey (USGS). TRAQ index
derived by PSU using GIS analysis and
empirical research from Portland,
Oregon, then extrapolated to 12 cities.
CS #5: Portland State University: HtHp
24. www.planitgeo.com | info@planitgeo.com 25
Intro
Tech
Overview
Case
Studies
Summary
Case
Studies
CS #5: Portland State University: HtHp
Unexpected but welcome results …
- New partners at the same table for the 1st time
o Environmental justice, public health, and environmental
- “Groups with similar missions who had not been at the same table
until now can be convened, allowing scientific and demographic
data to be explored and compared across neighborhoods and
cities.” (Vivek Shandas)
- Viewing data in an online interactive map, one participant stated:
“We are far more biologically impoverished than I realized” (when
comparing neighborhoods).
25. Challenges & Limitations
www.planitgeo.com | info@planitgeo.com 26
Intro
Tech
Overview
Case
Studies
SummarySummary
Urban and community forestry is about people, then about trees
• Not all decision makers or users will be impacted or comfortable with
online tools
• Some users can be intimidated by maps and tools and leery of the learning
curve
• Not all stakeholders will have access to online tools (underserved and low
income areas)
Don’t try to create a perfect model
• Apply a meaningful process and provide a framework for data-driven
decision making and implementation, followed by on-the-ground
verification
Always be a role for tree professionals and urban forest managers
• Implementing large-scale planting initiatives successfully requires proper
standards and techniques, suitable nursery stock, and maintenance plans
for young tree care
26. Future Research
www.planitgeo.com | info@planitgeo.com 27
Intro
Tech
Overview
Case
Studies
SummarySummary
• Impact of online tools: ROI, volunteerism, canopy cover,
stewardship, funding, and urban tree culture
• Drones and Unmanned Aerial Vehicles; limited more by
regulation than by technical capabilities
• Augmented Reality: practical and theoretical uses
• Monitoring, immersive (remote) plant identification for
educational purposes, etc.)
• Cloud-based, real-time technologies (e.g. smart watches
and dashboards) may drive efficiencies and possibilities
• What’s the full potential of “the geospatial urban
forest”?
27. Recommendations
www.planitgeo.com | info@planitgeo.com 28
Intro
Tech
Overview
Case
Studies
SummarySummary
Planning
• Community knowledge + experts, inclusive, local priorities
• Define audience, goals, messaging
• What is needed, a tool or solutions?
Tool Development
• Choose meaningful, familiar geographic scales
• Spatial extent of GIS inputs (e.g. spotty health data across a study area)
• Identify highly correlated criteria and existing derived layers
Applications
• Create interactive, visual, educational tools; list websites on criteria,
research, and tree care for longevity and maximum benefits
• Set UTC goals based on science, data, and a collaborative planning process,
not political appeal
28. 29www.planitgeo.com | info@planitgeo.com
Contacts & Web Resources
Intro
Tech
Overview
Case
Studies
SummarySummary
1. Robert Seemann, www.batonrougegreen.com/ and https://pg-
cloud.com/BatonRougeGreen/
2. Dana Dentice, www.plantonemillion.org/ and https://pg-
cloud.com/PHS
3. John Bowers, www.columbus.gov/branch-out/ and https://pg-
cloud.com/Columbus/
4. Nate Faris, www.kibi.org/ and https://pg-cloud.com/KIB/
5. Vivek Shandas, Portland State, www.treesandhealth.org/ and
http://map.treesandhealth.org/
6. This research paper: www.digitalcommons.lmu.edu (Cities and
the Environment, CATE)
29. Ian Hanou, Owner and Founder
(303) 503-4846
IanHanou@PlanItGeo.com
A geospatial technology, software,
consulting, and planning firm
specializing in urban forestry.
Info@PlanItGeo.com
www.planitgeo.com
THANK YOU!
30