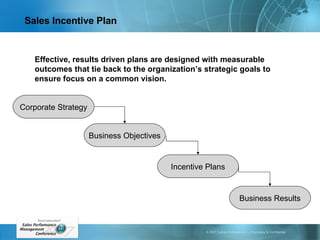
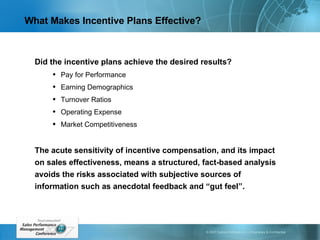
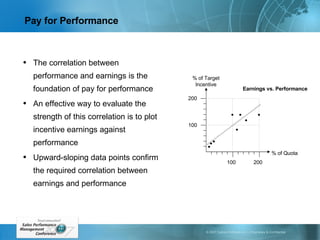
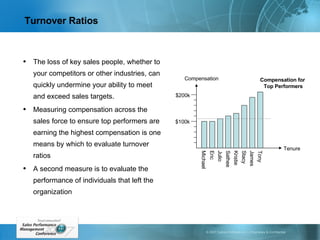
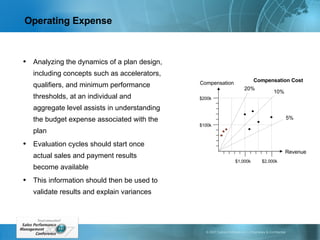
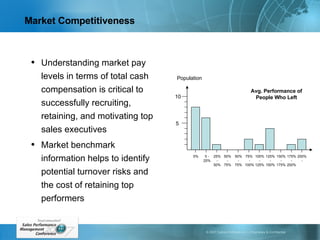
Bruce Jackson Managing Director, Sales Performance Management Iconixx Using Callidus TrueAnalytics to Drive Sales Plan Effectiveness
Session Theme Effective sales incentive plans interpret business objectives accurately and use the information to assess individual or team performance metrics driving high performing organizations.  Business Intelligence technologies, such as Callidus TrueAnalytics, transform data into valuable and useful information providing insight into whether the incentive plan designs are meeting stated business objectives and where improvements can be achieved.
Sales Incentive Plan  Effective, results driven plans are designed with measurable outcomes that tie back to the organization’s strategic goals to ensure focus on a common vision. Corporate Strategy Business Objectives Incentive Plans Business Results
What Makes Incentive Plans Effective? Did the incentive plans achieve the desired results? Pay for Performance Earning Demographics Turnover Ratios Operating Expense Market Competitiveness The acute sensitivity of incentive compensation, and its impact on sales effectiveness, means a structured, fact-based analysis avoids the risks associated with subjective sources of information such as anecdotal feedback and “gut feel”.
Challenges Analyzing sales incentive plan effectiveness is often met with challenges Information is stored in disparate systems Inconsistent data across systems Unable to turn data into information Do not have the right tools Sales Performance Management data warehouses provide some of the most reliable and consistent information audited by numerous people on a monthly basis.  The repositories contain sales, revenue, credit, performance, incentive, and payment data critical to evaluating plan performance
Turning Data into Knowledge Business Intelligence “ Quantitative aspect of transforming data to information to derive knowledge through reporting and analysis of structured information” -- Gartner Group
Pay for Performance The correlation between performance and earnings is the foundation of pay for performance An effective way to evaluate the strength of this correlation is to plot incentive earnings against performance Upward-sloping data points confirm the required correlation between earnings and performance % of Target Incentive % of Quota 100 200 100 200 Earnings vs. Performance
Earning Demographics Even the best designs can produce unexpected results Does your design inadvertently favor sales representatives with small territories over those with large territories? To analyze whether territory size impacts earning potential, plot incentive earnings in terms of gross dollars or percentage of target incentive pay against territory size % of Target Incentive Territory Size 3M 200% Target Incentive vs. Territory Size 2M 1M 4M 5M 7M 6M 100% 8M 10M 9M
Turnover Ratios The loss of key sales people, whether to your competitors or other industries, can quickly undermine your ability to meet and exceed sales targets. Measuring compensation across the sales force to ensure top performers are earning the highest compensation is one means by which to evaluate turnover ratios A second measure is to evaluate the performance of individuals that left the organization Compensation Tenure $200k Compensation for  Top Performers $100k Michael Eric Julio Sathee Kristie Stacy James Tony
Operating Expense Analyzing the dynamics of a plan design, including concepts such as accelerators, qualifiers, and minimum performance thresholds, at an individual and aggregate level assists in understanding the budget expense associated with the plan Evaluation cycles should start once actual sales and payment results become available This information should then be used to validate results and explain variances Compensation Revenue $1,000k $2,000k $100k $200k 10% 5% 20% Compensation Cost
Market Competitiveness Understanding market pay levels in terms of total cash compensation is critical to successfully recruiting, retaining, and motivating top sales executives Market benchmark information helps to identify potential turnover risks and the cost of retaining top performers Avg. Performance of People Who Left 0 - 25% Population 5 10 0% 25% - 50% 50% - 75% 50% - 75% 75%  - 100% 100% - 125% 125% - 150% 150% - 175% 175% - 200% 200% -
Session Theme Effective sales incentive plans interpret business objectives accurately and use the information to assess individual or team performance metrics driving high performing organizations.  Business Intelligence technologies, such as Callidus TrueAnalytics, transform data into valuable and useful information providing insight into whether the incentive plan designs are meeting stated business objectives and where improvements can be achieved.

Using Callidus TrueAnalytics to Drive Sales Plan Effectiveness

  • 1.
    Bruce Jackson ManagingDirector, Sales Performance Management Iconixx Using Callidus TrueAnalytics to Drive Sales Plan Effectiveness
  • 2.
    Session Theme Effectivesales incentive plans interpret business objectives accurately and use the information to assess individual or team performance metrics driving high performing organizations. Business Intelligence technologies, such as Callidus TrueAnalytics, transform data into valuable and useful information providing insight into whether the incentive plan designs are meeting stated business objectives and where improvements can be achieved.
  • 3.
    Sales Incentive Plan Effective, results driven plans are designed with measurable outcomes that tie back to the organization’s strategic goals to ensure focus on a common vision. Corporate Strategy Business Objectives Incentive Plans Business Results
  • 4.
    What Makes IncentivePlans Effective? Did the incentive plans achieve the desired results? Pay for Performance Earning Demographics Turnover Ratios Operating Expense Market Competitiveness The acute sensitivity of incentive compensation, and its impact on sales effectiveness, means a structured, fact-based analysis avoids the risks associated with subjective sources of information such as anecdotal feedback and “gut feel”.
  • 5.
    Challenges Analyzing salesincentive plan effectiveness is often met with challenges Information is stored in disparate systems Inconsistent data across systems Unable to turn data into information Do not have the right tools Sales Performance Management data warehouses provide some of the most reliable and consistent information audited by numerous people on a monthly basis. The repositories contain sales, revenue, credit, performance, incentive, and payment data critical to evaluating plan performance
  • 6.
    Turning Data intoKnowledge Business Intelligence “ Quantitative aspect of transforming data to information to derive knowledge through reporting and analysis of structured information” -- Gartner Group
  • 7.
    Pay for PerformanceThe correlation between performance and earnings is the foundation of pay for performance An effective way to evaluate the strength of this correlation is to plot incentive earnings against performance Upward-sloping data points confirm the required correlation between earnings and performance % of Target Incentive % of Quota 100 200 100 200 Earnings vs. Performance
  • 8.
    Earning Demographics Eventhe best designs can produce unexpected results Does your design inadvertently favor sales representatives with small territories over those with large territories? To analyze whether territory size impacts earning potential, plot incentive earnings in terms of gross dollars or percentage of target incentive pay against territory size % of Target Incentive Territory Size 3M 200% Target Incentive vs. Territory Size 2M 1M 4M 5M 7M 6M 100% 8M 10M 9M
  • 9.
    Turnover Ratios Theloss of key sales people, whether to your competitors or other industries, can quickly undermine your ability to meet and exceed sales targets. Measuring compensation across the sales force to ensure top performers are earning the highest compensation is one means by which to evaluate turnover ratios A second measure is to evaluate the performance of individuals that left the organization Compensation Tenure $200k Compensation for Top Performers $100k Michael Eric Julio Sathee Kristie Stacy James Tony
  • 10.
    Operating Expense Analyzingthe dynamics of a plan design, including concepts such as accelerators, qualifiers, and minimum performance thresholds, at an individual and aggregate level assists in understanding the budget expense associated with the plan Evaluation cycles should start once actual sales and payment results become available This information should then be used to validate results and explain variances Compensation Revenue $1,000k $2,000k $100k $200k 10% 5% 20% Compensation Cost
  • 11.
    Market Competitiveness Understandingmarket pay levels in terms of total cash compensation is critical to successfully recruiting, retaining, and motivating top sales executives Market benchmark information helps to identify potential turnover risks and the cost of retaining top performers Avg. Performance of People Who Left 0 - 25% Population 5 10 0% 25% - 50% 50% - 75% 50% - 75% 75% - 100% 100% - 125% 125% - 150% 150% - 175% 175% - 200% 200% -
  • 12.
    Session Theme Effectivesales incentive plans interpret business objectives accurately and use the information to assess individual or team performance metrics driving high performing organizations. Business Intelligence technologies, such as Callidus TrueAnalytics, transform data into valuable and useful information providing insight into whether the incentive plan designs are meeting stated business objectives and where improvements can be achieved.