Download as PDF, PPTX

![A day in the UK market - Fluctuations in electricity prices
Impact of demand and generation fluctuations on price
[UK half hourly spot prices, 27th Oct 2014, £/MWh]
66
225
69
2
3
0 50 100 150 200 250
£8-20
£20-50
£50-100
£100-200
Over £200
0
10
20
30
40
50
60
70
80
90
100
time
(half hourly
periods)
£MWh
£86/MWh
£17/MWh
Number of days
Difference between max and min prices in a day
[£, number of days, 2014]](https://image.slidesharecdn.com/15-151118170623-lva1-app6892/85/Unlocking-demand-flexibility-for-lower-electricity-bills-6-320.jpg)
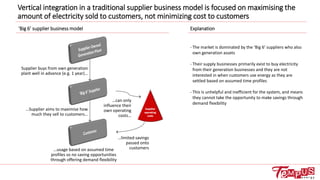
![Wholesale costs
Supplier operating costs
Supplier
profit
Environmental & Social
costs
VAT
Network costs
Demand flexibility can be used to optimise most elements that make up the bill
Minimised by
shifting flexible
demand to off-
peak periods
Reduced by
actively trading
and varying
demand to
match low price
periods
Household Bill Savings with demand flexibility
Balancing charges
also minimised by
managing usage in
real time
Wholesale costs, 39%
Supplier operating
costs, 13%
Supplier profit, 6%
Environmental & Social
costs, 11%
VAT, 5%
Network costs, 26%
Household Electricity Bill Breakdown (Ofgem 2015)
Government taxes,
regulations and
legislations Costs of running a supply business
[the only costs that traditional
suppliers can effectively control]
Transmission and
distribution costs
Cost of
electricity
trading
11Further opportunities can arise from raising revenue from participating in balancing services and capacity market](https://image.slidesharecdn.com/15-151118170623-lva1-app6892/85/Unlocking-demand-flexibility-for-lower-electricity-bills-11-320.jpg)
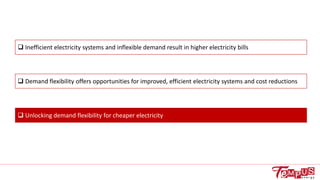

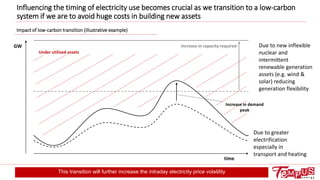
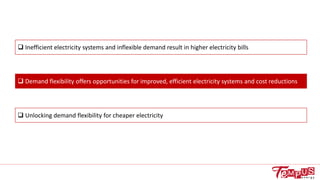
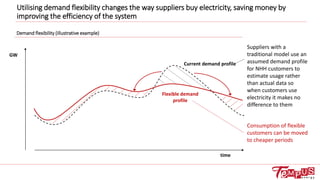
The document discusses how inefficient electricity systems and inflexible demand lead to higher electricity bills, while demand flexibility presents opportunities for reducing costs and improving system efficiency. It highlights the limitations of traditional supplier models and the potential benefits of adopting innovative approaches like those offered by Tempus, which utilizes customer flexibility to optimize energy usage and reduce costs. By integrating technology to manage real-time demand and offering competitive tariffs, companies can unlock significant savings for consumers.


