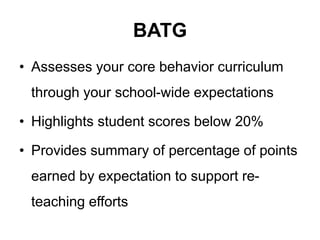
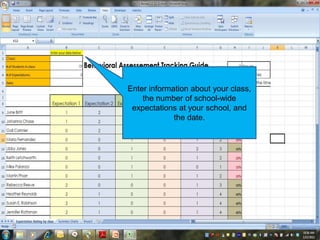
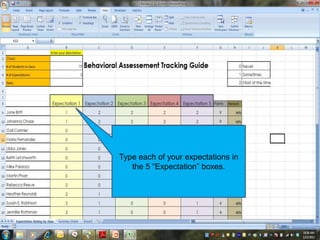
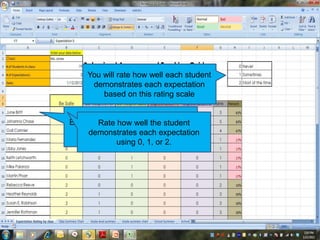
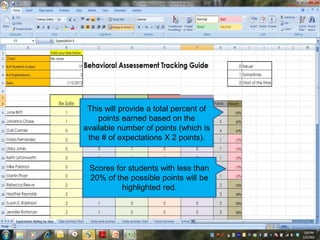
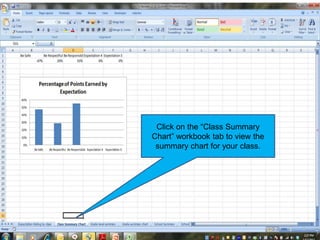
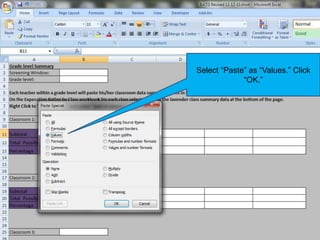
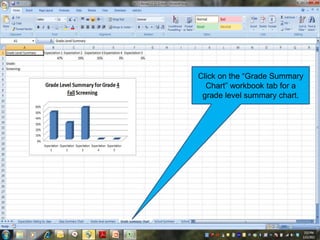
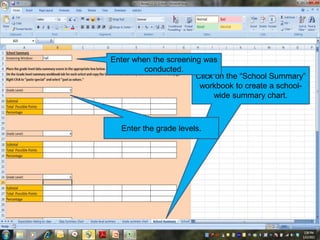
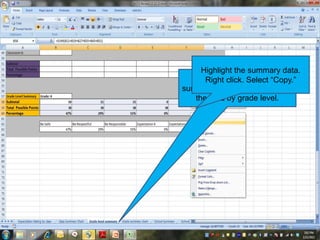
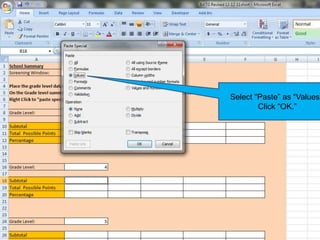
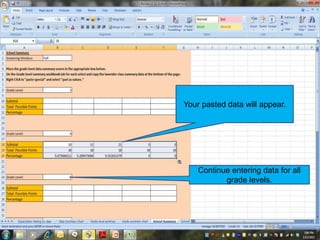
Universal Screener for
Behavior
Behavior Assessment Tracking
Guide
Universal Screening for Behavior
WHEN:
fall, winter, spring
during the screening window
WHO:
every classroom teacher evaluates his/her
classroom
BATG
• Assesses your core behavior curriculum
through your school-wide expectations
• Highlights student scores below 20%
• Provides summary of percentage of points
earned by expectation to support re-
teaching efforts
Enter information about your class,
the number of school-wide
expectations at your school, and
the date.
Type each of your expectations in
the 5 “Expectation” boxes.
You will rate how well each student
demonstrates each expectation
based on this rating scale
Enter the name for each student in
your class.
Rate how well the student
demonstrates each expectation
using 0, 1, or 2.
This will provide a total percent of
points earned based on the
available number of points (which is
the # of expectations X 2 points).
Scores for students with less than
20% of the possible points will be
highlighted red.
Scroll down the page to see the
total percentage by expectation.
Click on the “Class Summary
Chart” workbook tab to view the
summary chart for your class.
Click on the “Grade Level Summary
Chart” workbook tab to enter the
classroom data for your grade
level.
Copy the data from the
“Expectation Rating by Class”
workbook tab.
Highlight the data. Right click.
Select “Copy.”
Right click on the top box for the
classroom. Select “Paste Special.”
Select “Paste” as “Values.” Click
“OK.”
Enter the name of the class.
Be sure to enter when the
screening was conducted and
for which grade level.
Continue entering data for all
classes in the grade level.
Scroll down the page for a
summary of percentages for
the grade level.
Click on the “Grade Summary
Chart” workbook tab for a
grade level summary chart.
Click on the “School Summary”
workbook to create a school-
wide summary chart.
Enter when the screening was
conducted.
Enter the grade levels.
Click on the Grade level
summary workbook tab to copy
the data by grade level.
Highlight the summary data.
Right click. Select “Copy.”
Right click on the top box for
the grade level. Select “Paste
Special.”
Select “Paste” as “Values.
Click “OK.”
Your pasted data will appear.
Continue entering data for all
grade levels.
Scroll down the page for a
summary of percentages for
the whole school.
Click on the “School Summary
Chart” workbook tab for the
school summary chart.
Discussion
How will the data from each
class, grade level, and the
whole school inform your
problem-solving actions?
Questions?

Universal screener for behavior

  • 1.
  • 2.
    Universal Screening forBehavior WHEN: fall, winter, spring during the screening window WHO: every classroom teacher evaluates his/her classroom
  • 3.
    BATG • Assesses yourcore behavior curriculum through your school-wide expectations • Highlights student scores below 20% • Provides summary of percentage of points earned by expectation to support re- teaching efforts
  • 4.
    Enter information aboutyour class, the number of school-wide expectations at your school, and the date.
  • 5.
    Type each ofyour expectations in the 5 “Expectation” boxes.
  • 6.
    You will ratehow well each student demonstrates each expectation based on this rating scale Enter the name for each student in your class. Rate how well the student demonstrates each expectation using 0, 1, or 2.
  • 7.
    This will providea total percent of points earned based on the available number of points (which is the # of expectations X 2 points). Scores for students with less than 20% of the possible points will be highlighted red.
  • 8.
    Scroll down thepage to see the total percentage by expectation.
  • 9.
    Click on the“Class Summary Chart” workbook tab to view the summary chart for your class.
  • 10.
    Click on the“Grade Level Summary Chart” workbook tab to enter the classroom data for your grade level.
  • 11.
    Copy the datafrom the “Expectation Rating by Class” workbook tab. Highlight the data. Right click. Select “Copy.”
  • 12.
    Right click onthe top box for the classroom. Select “Paste Special.”
  • 13.
    Select “Paste” as“Values.” Click “OK.”
  • 14.
    Enter the nameof the class. Be sure to enter when the screening was conducted and for which grade level. Continue entering data for all classes in the grade level.
  • 15.
    Scroll down thepage for a summary of percentages for the grade level.
  • 16.
    Click on the“Grade Summary Chart” workbook tab for a grade level summary chart.
  • 17.
    Click on the“School Summary” workbook to create a school- wide summary chart. Enter when the screening was conducted. Enter the grade levels.
  • 18.
    Click on theGrade level summary workbook tab to copy the data by grade level. Highlight the summary data. Right click. Select “Copy.”
  • 19.
    Right click onthe top box for the grade level. Select “Paste Special.”
  • 20.
    Select “Paste” as“Values. Click “OK.”
  • 21.
    Your pasted datawill appear. Continue entering data for all grade levels.
  • 22.
    Scroll down thepage for a summary of percentages for the whole school.
  • 23.
    Click on the“School Summary Chart” workbook tab for the school summary chart.
  • 24.
    Discussion How will thedata from each class, grade level, and the whole school inform your problem-solving actions?
  • 25.