Download to read offline

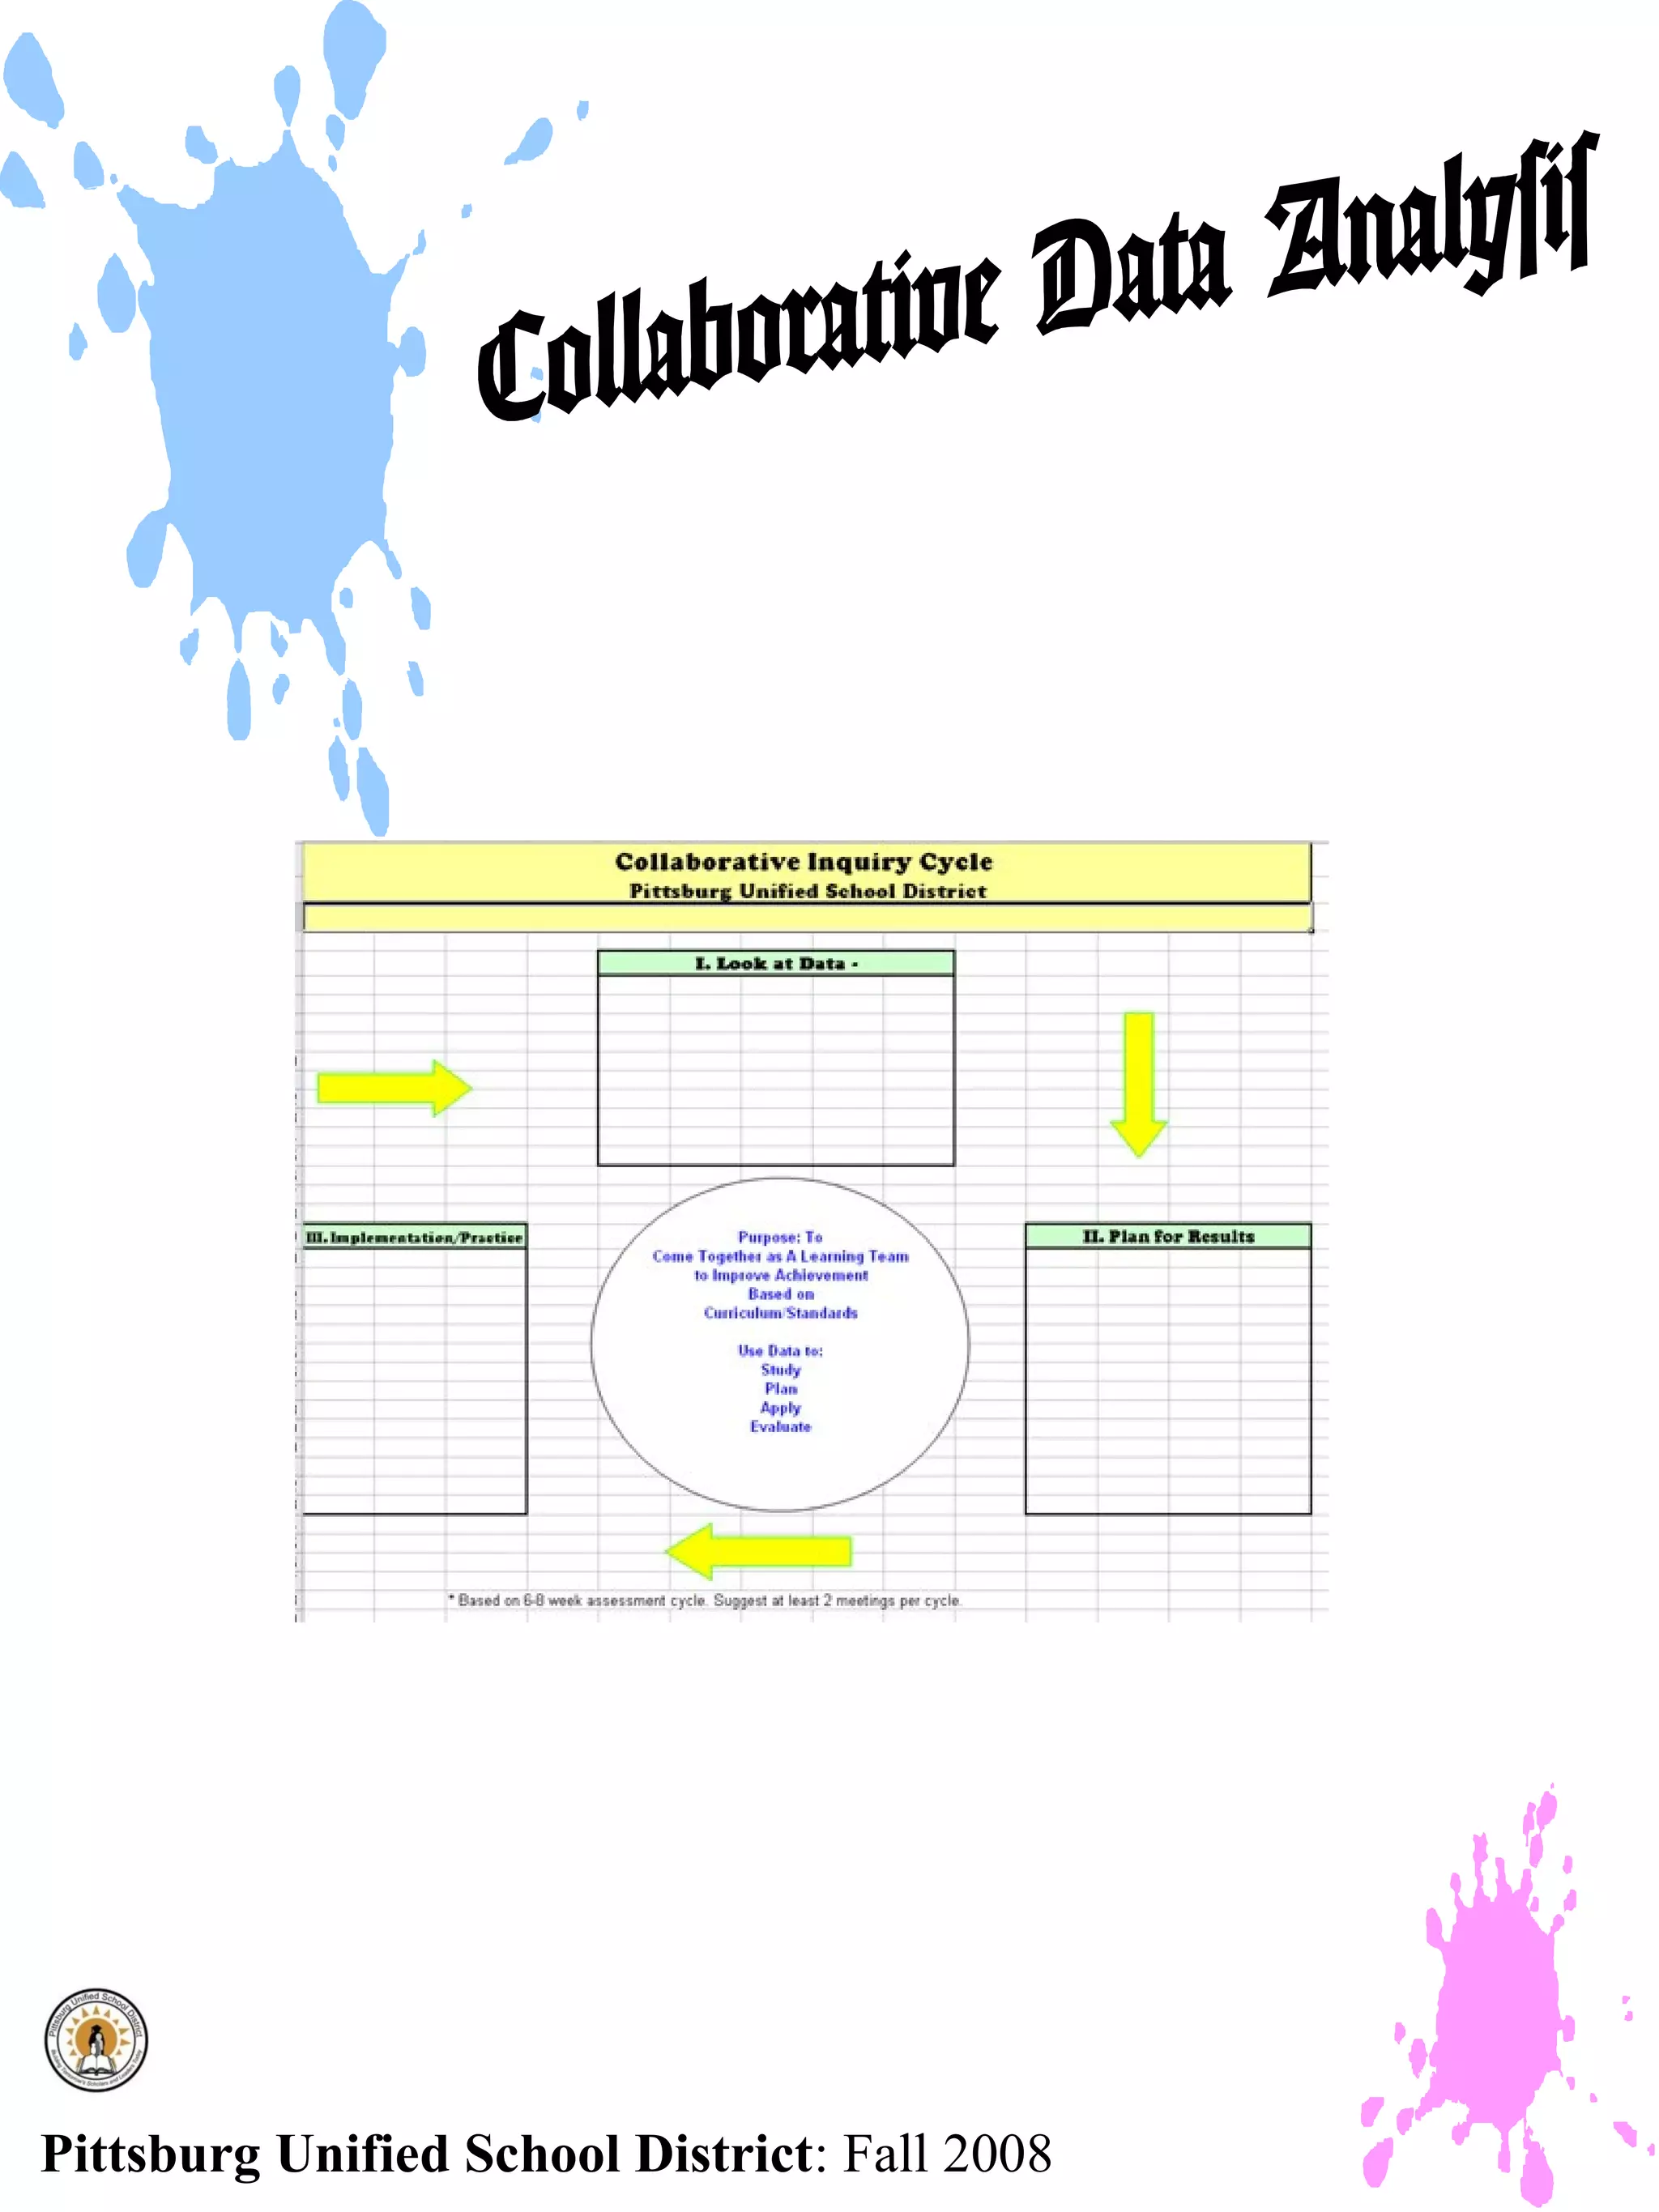
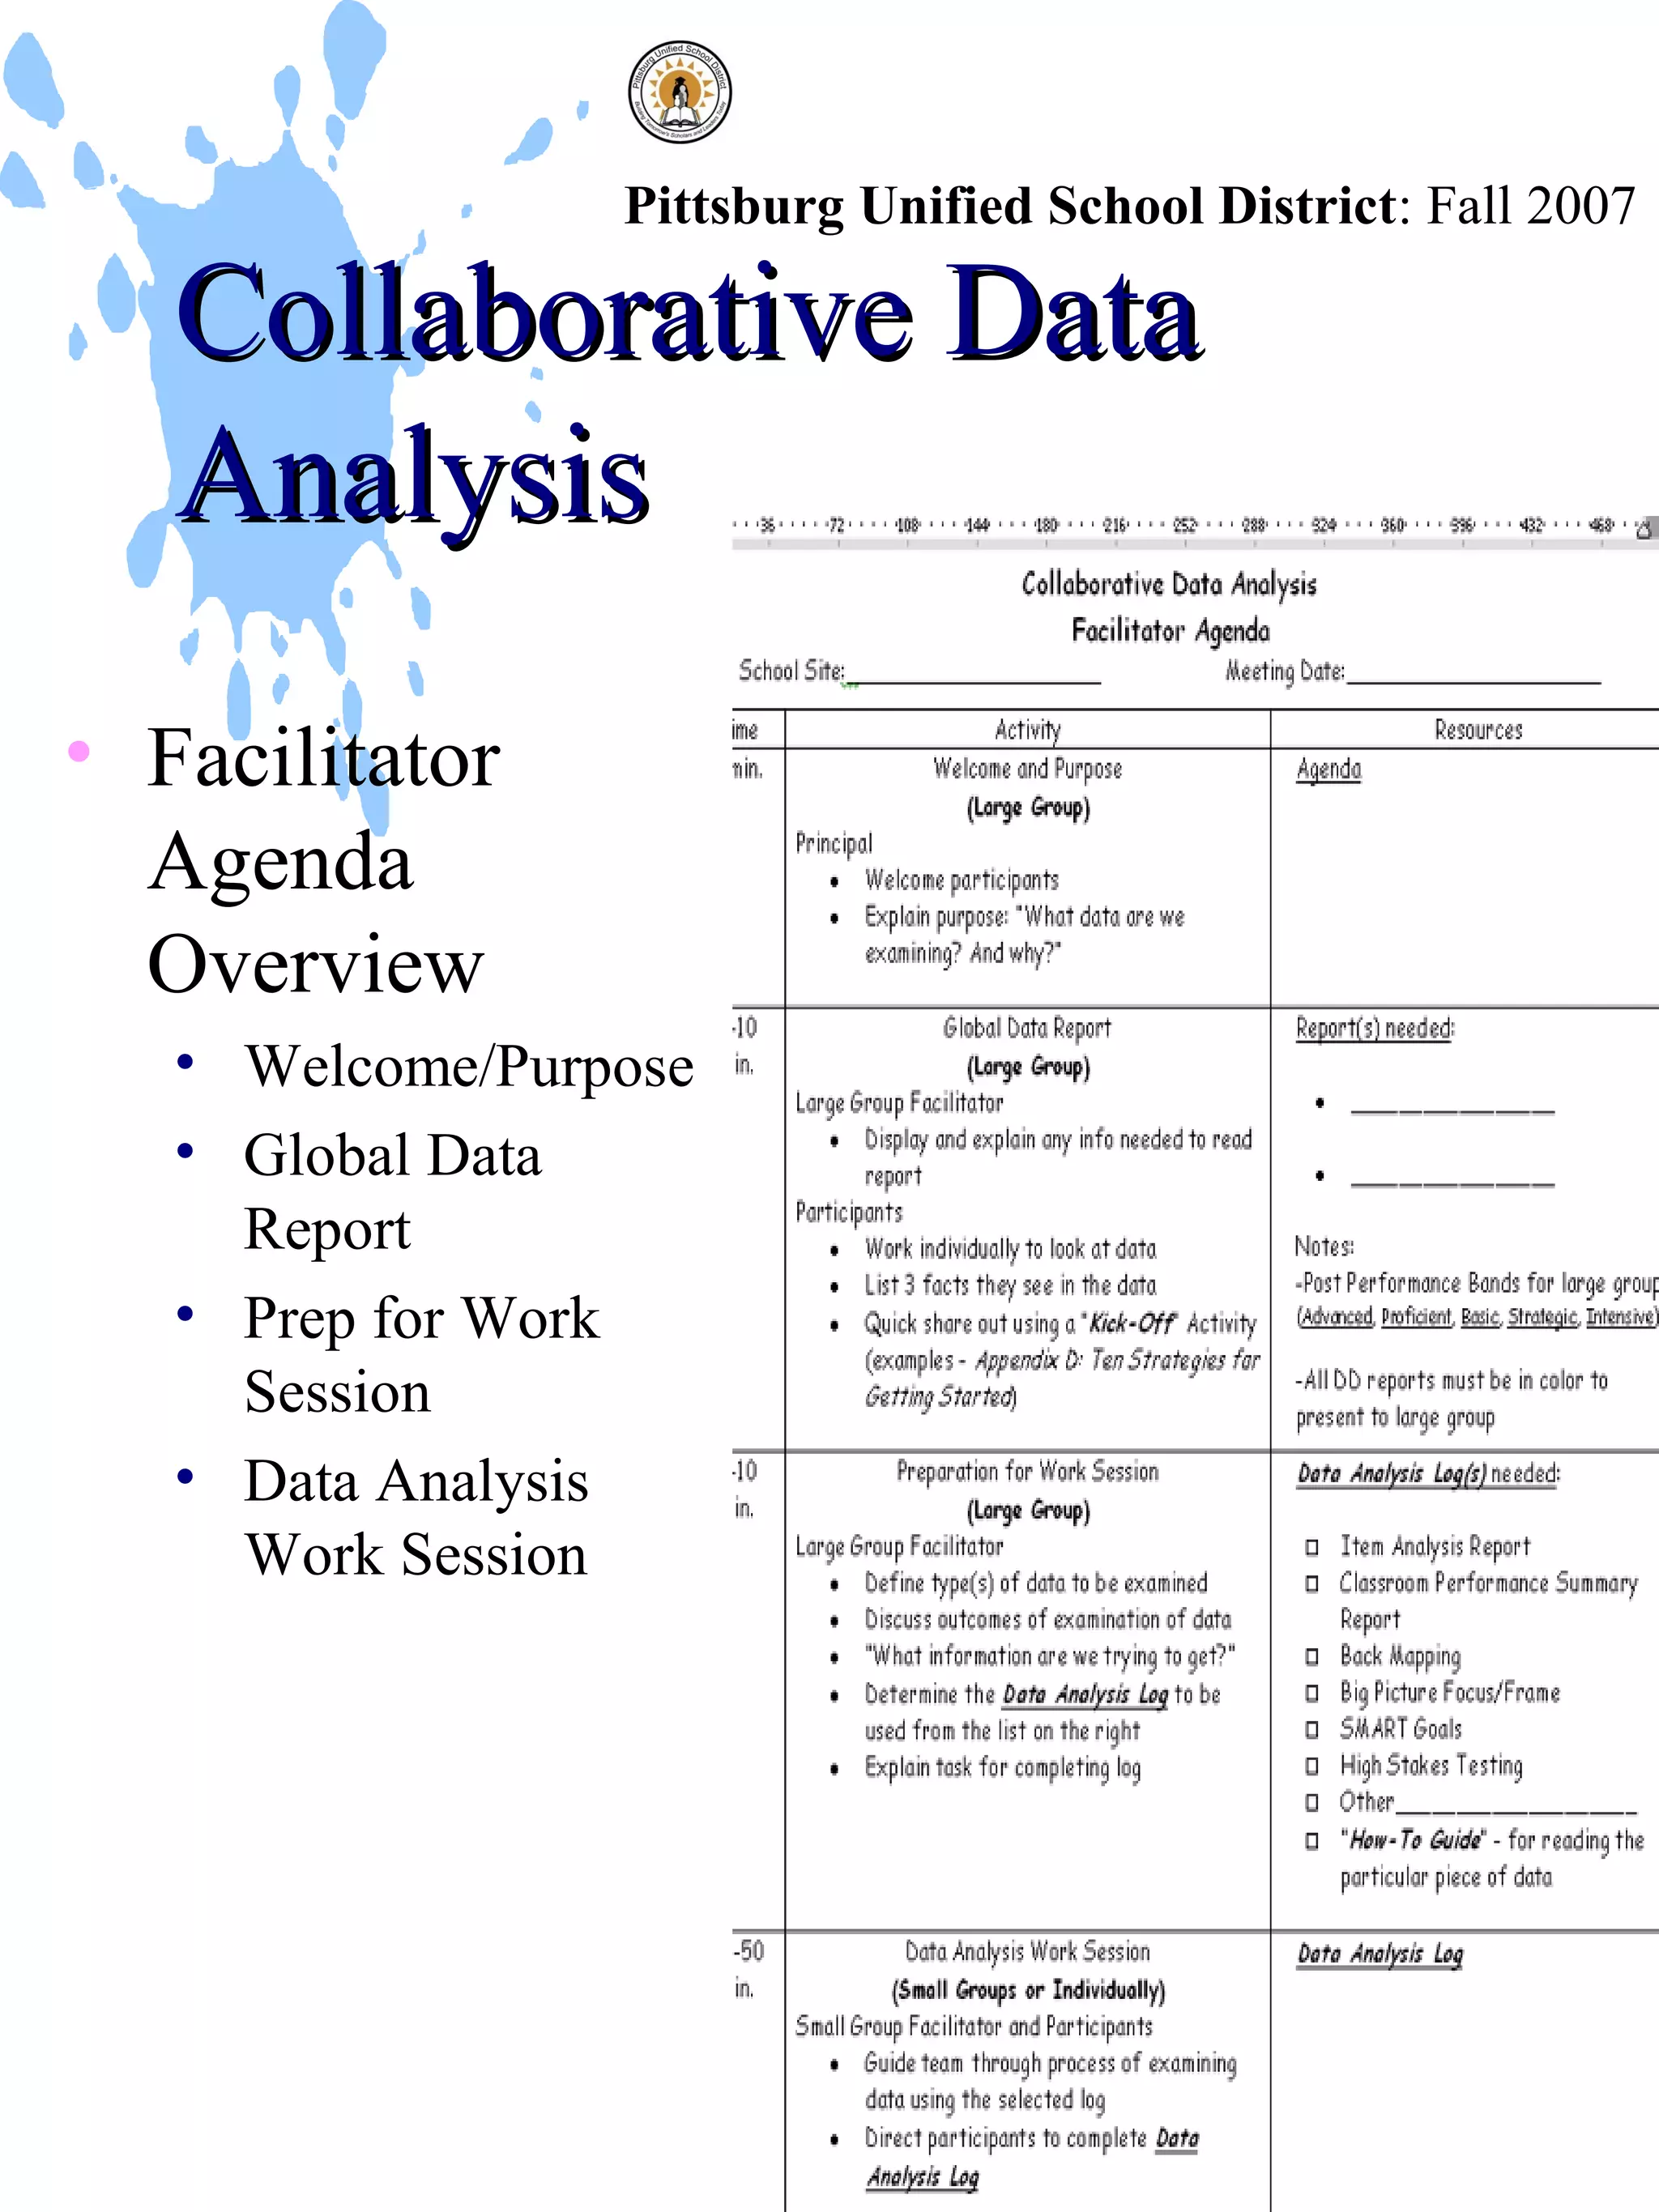

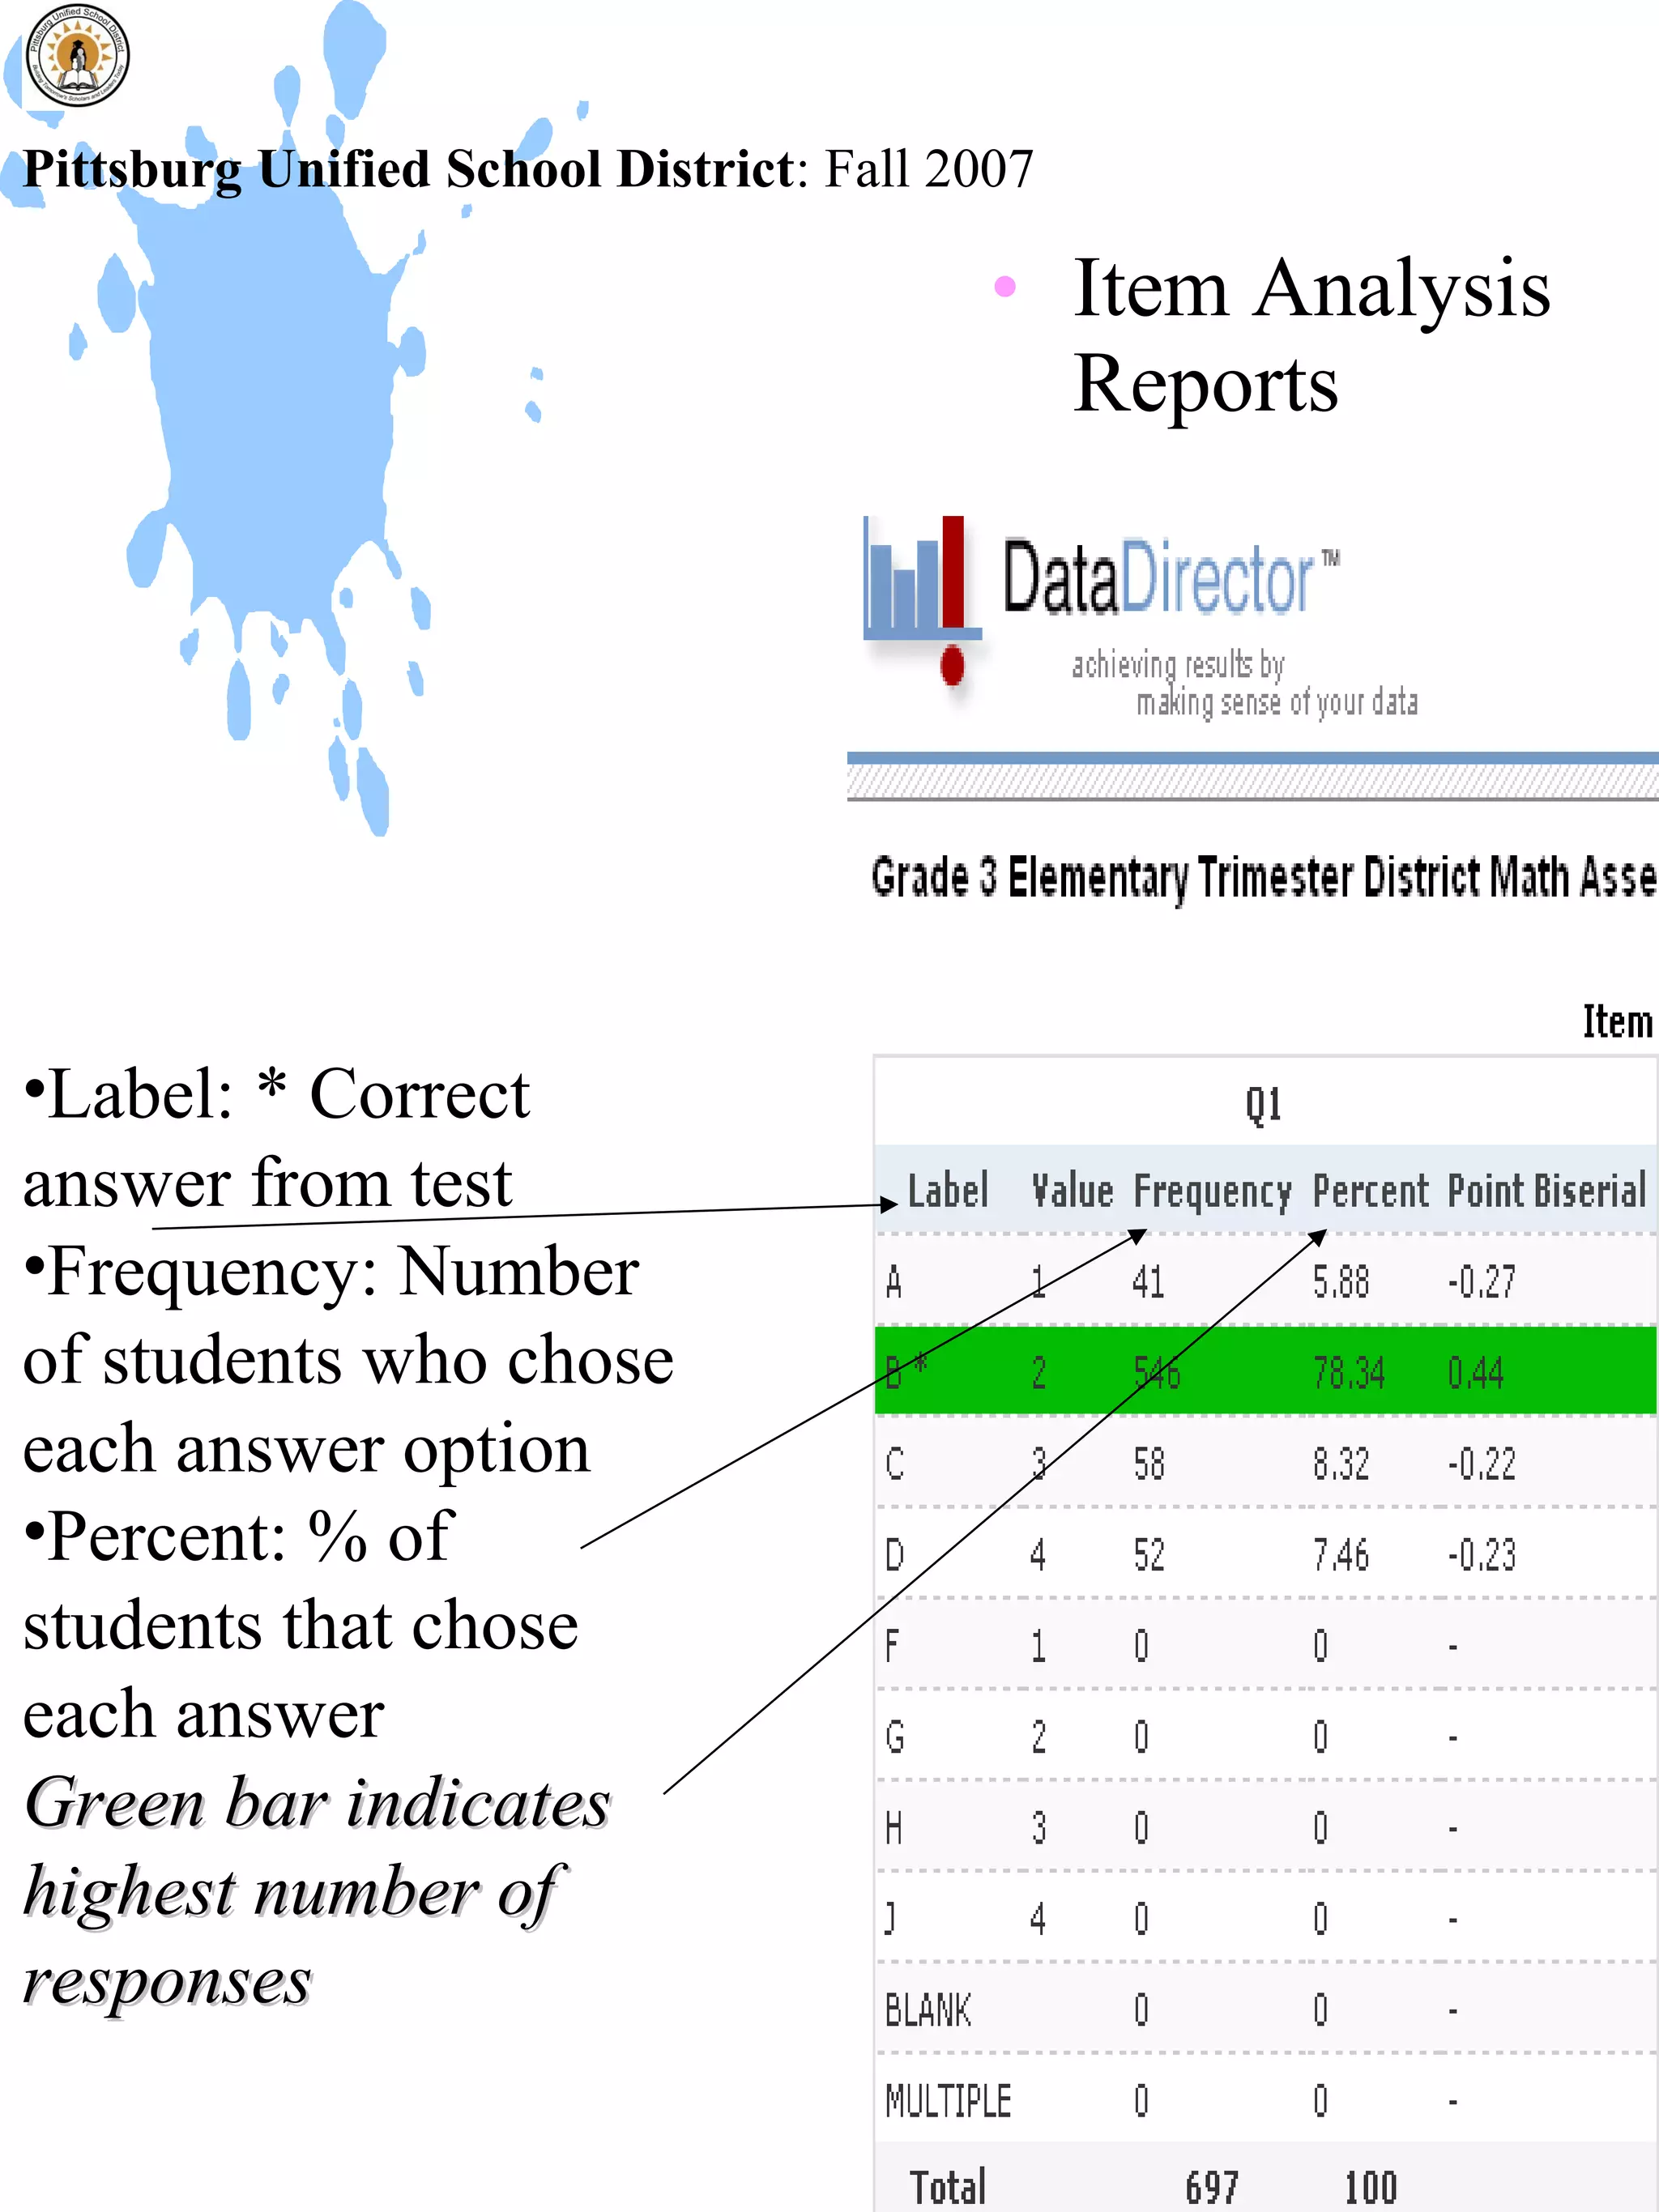
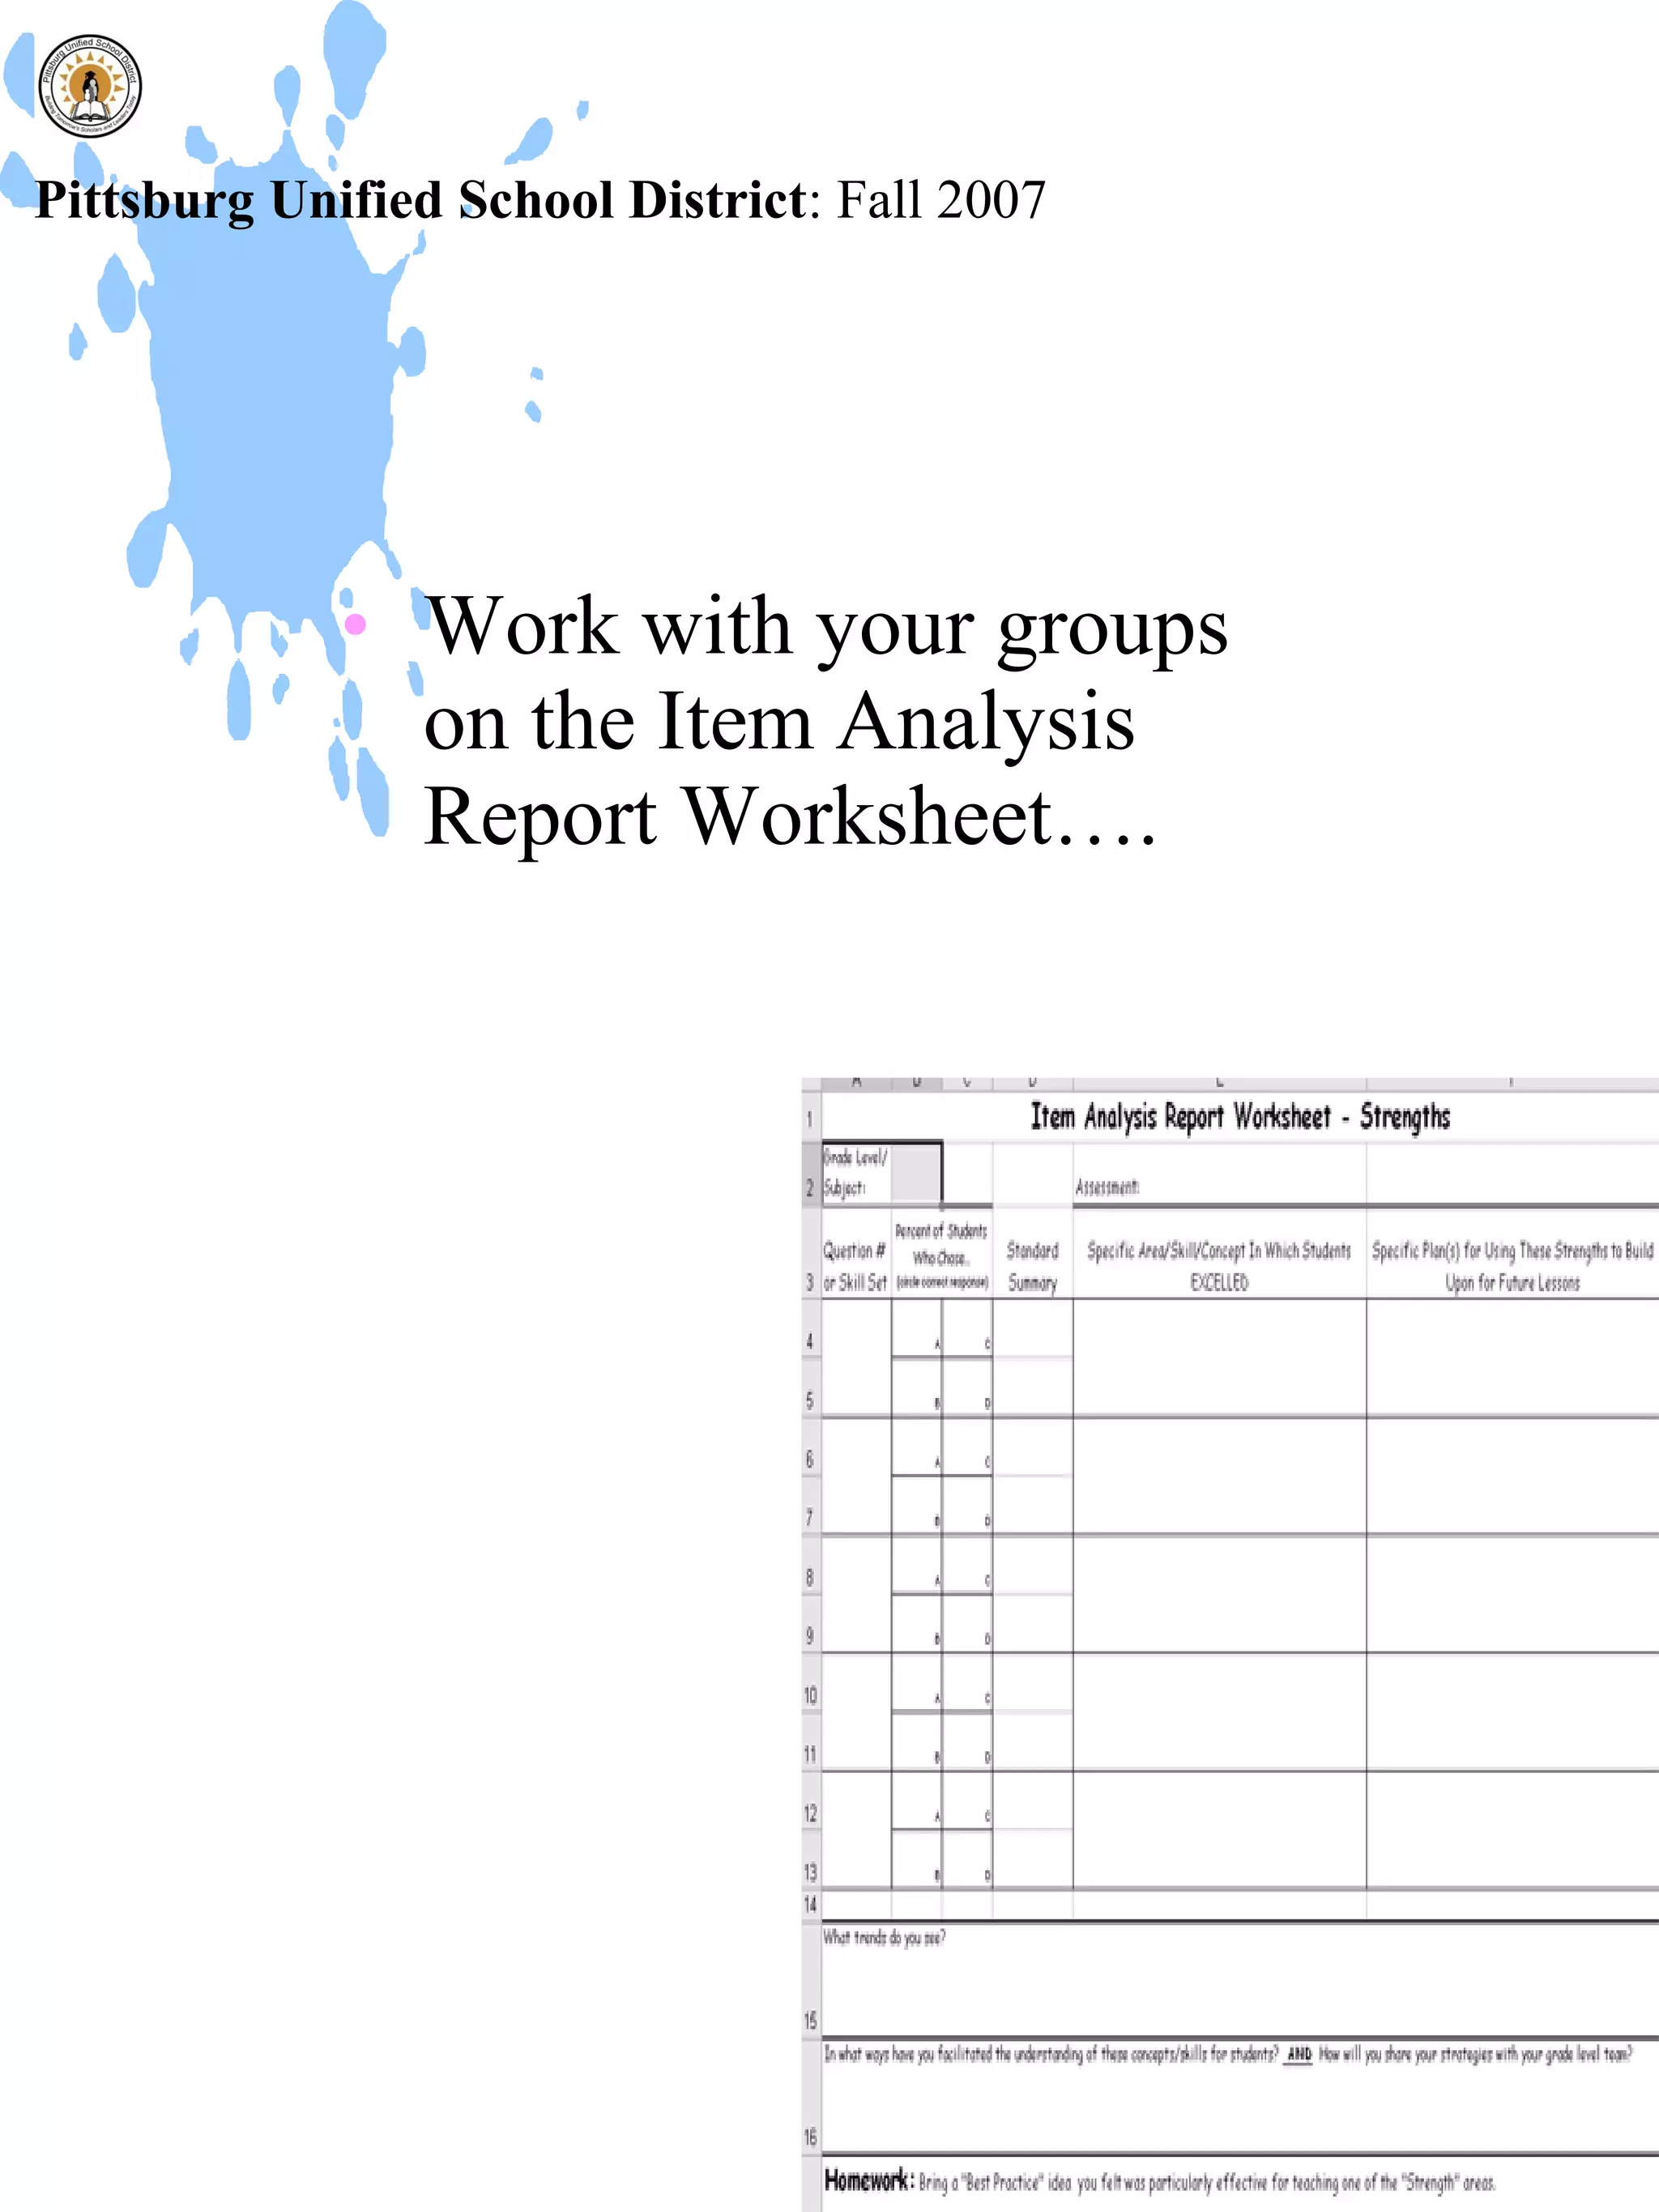
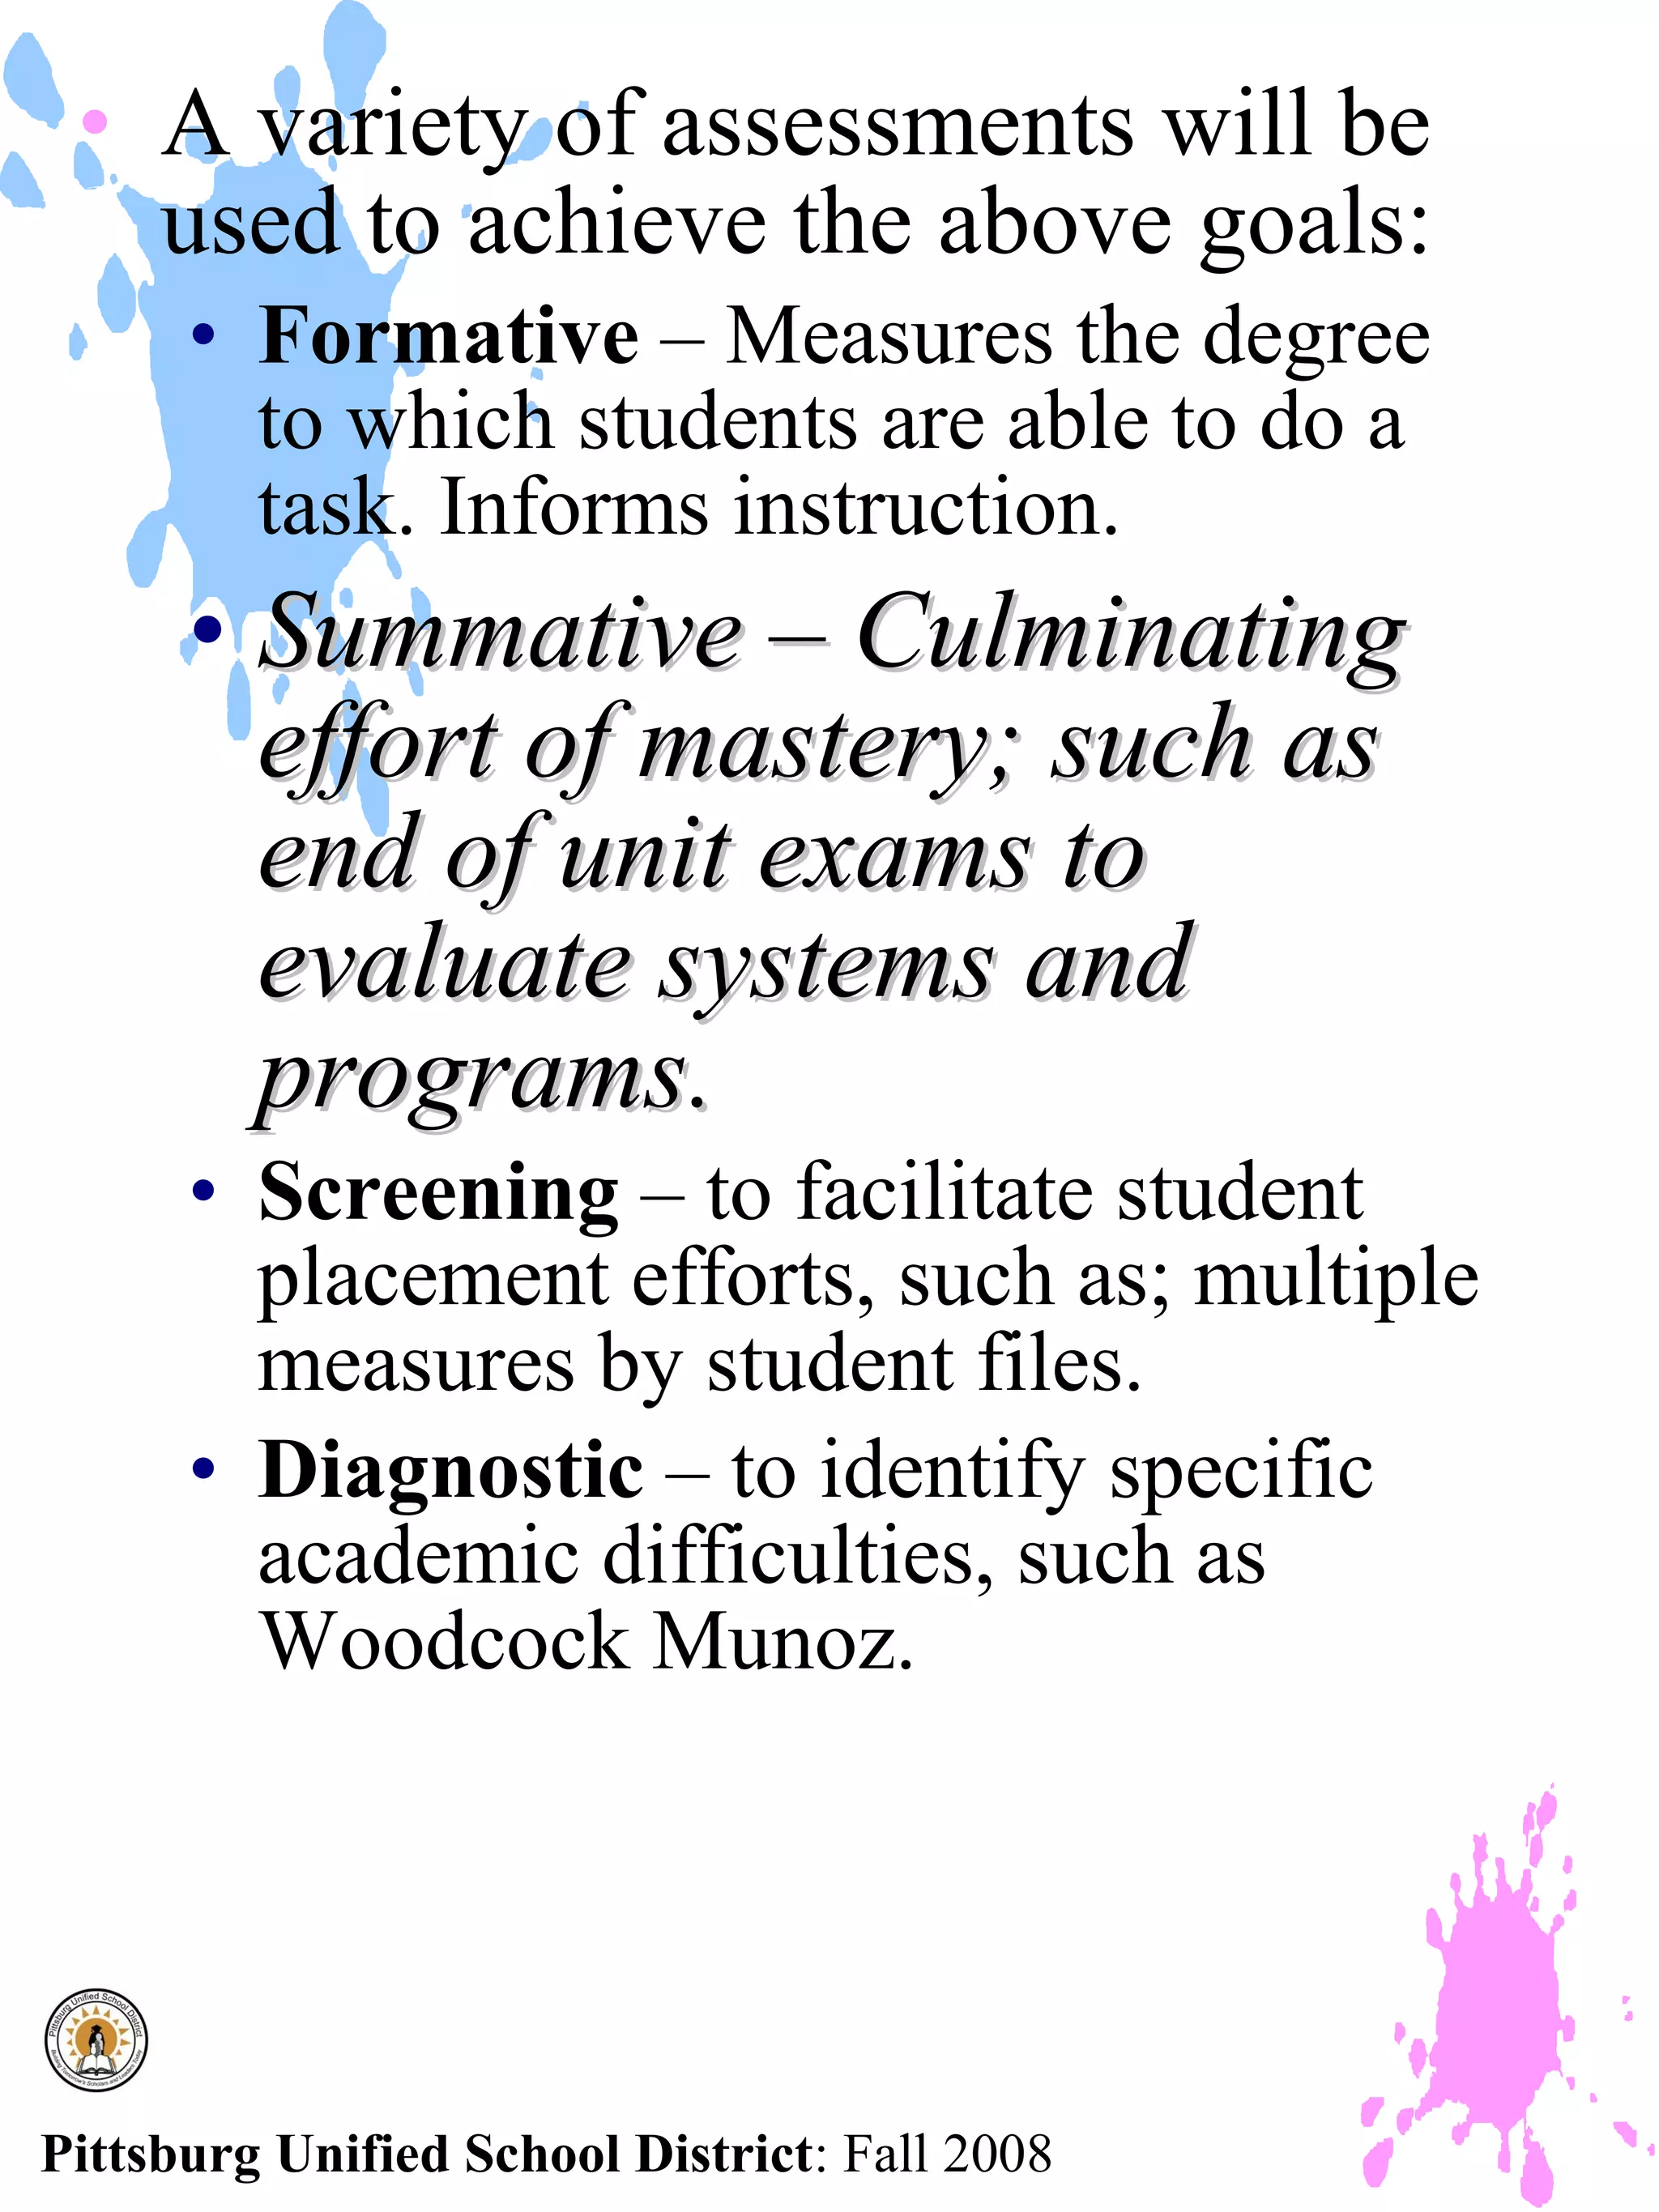
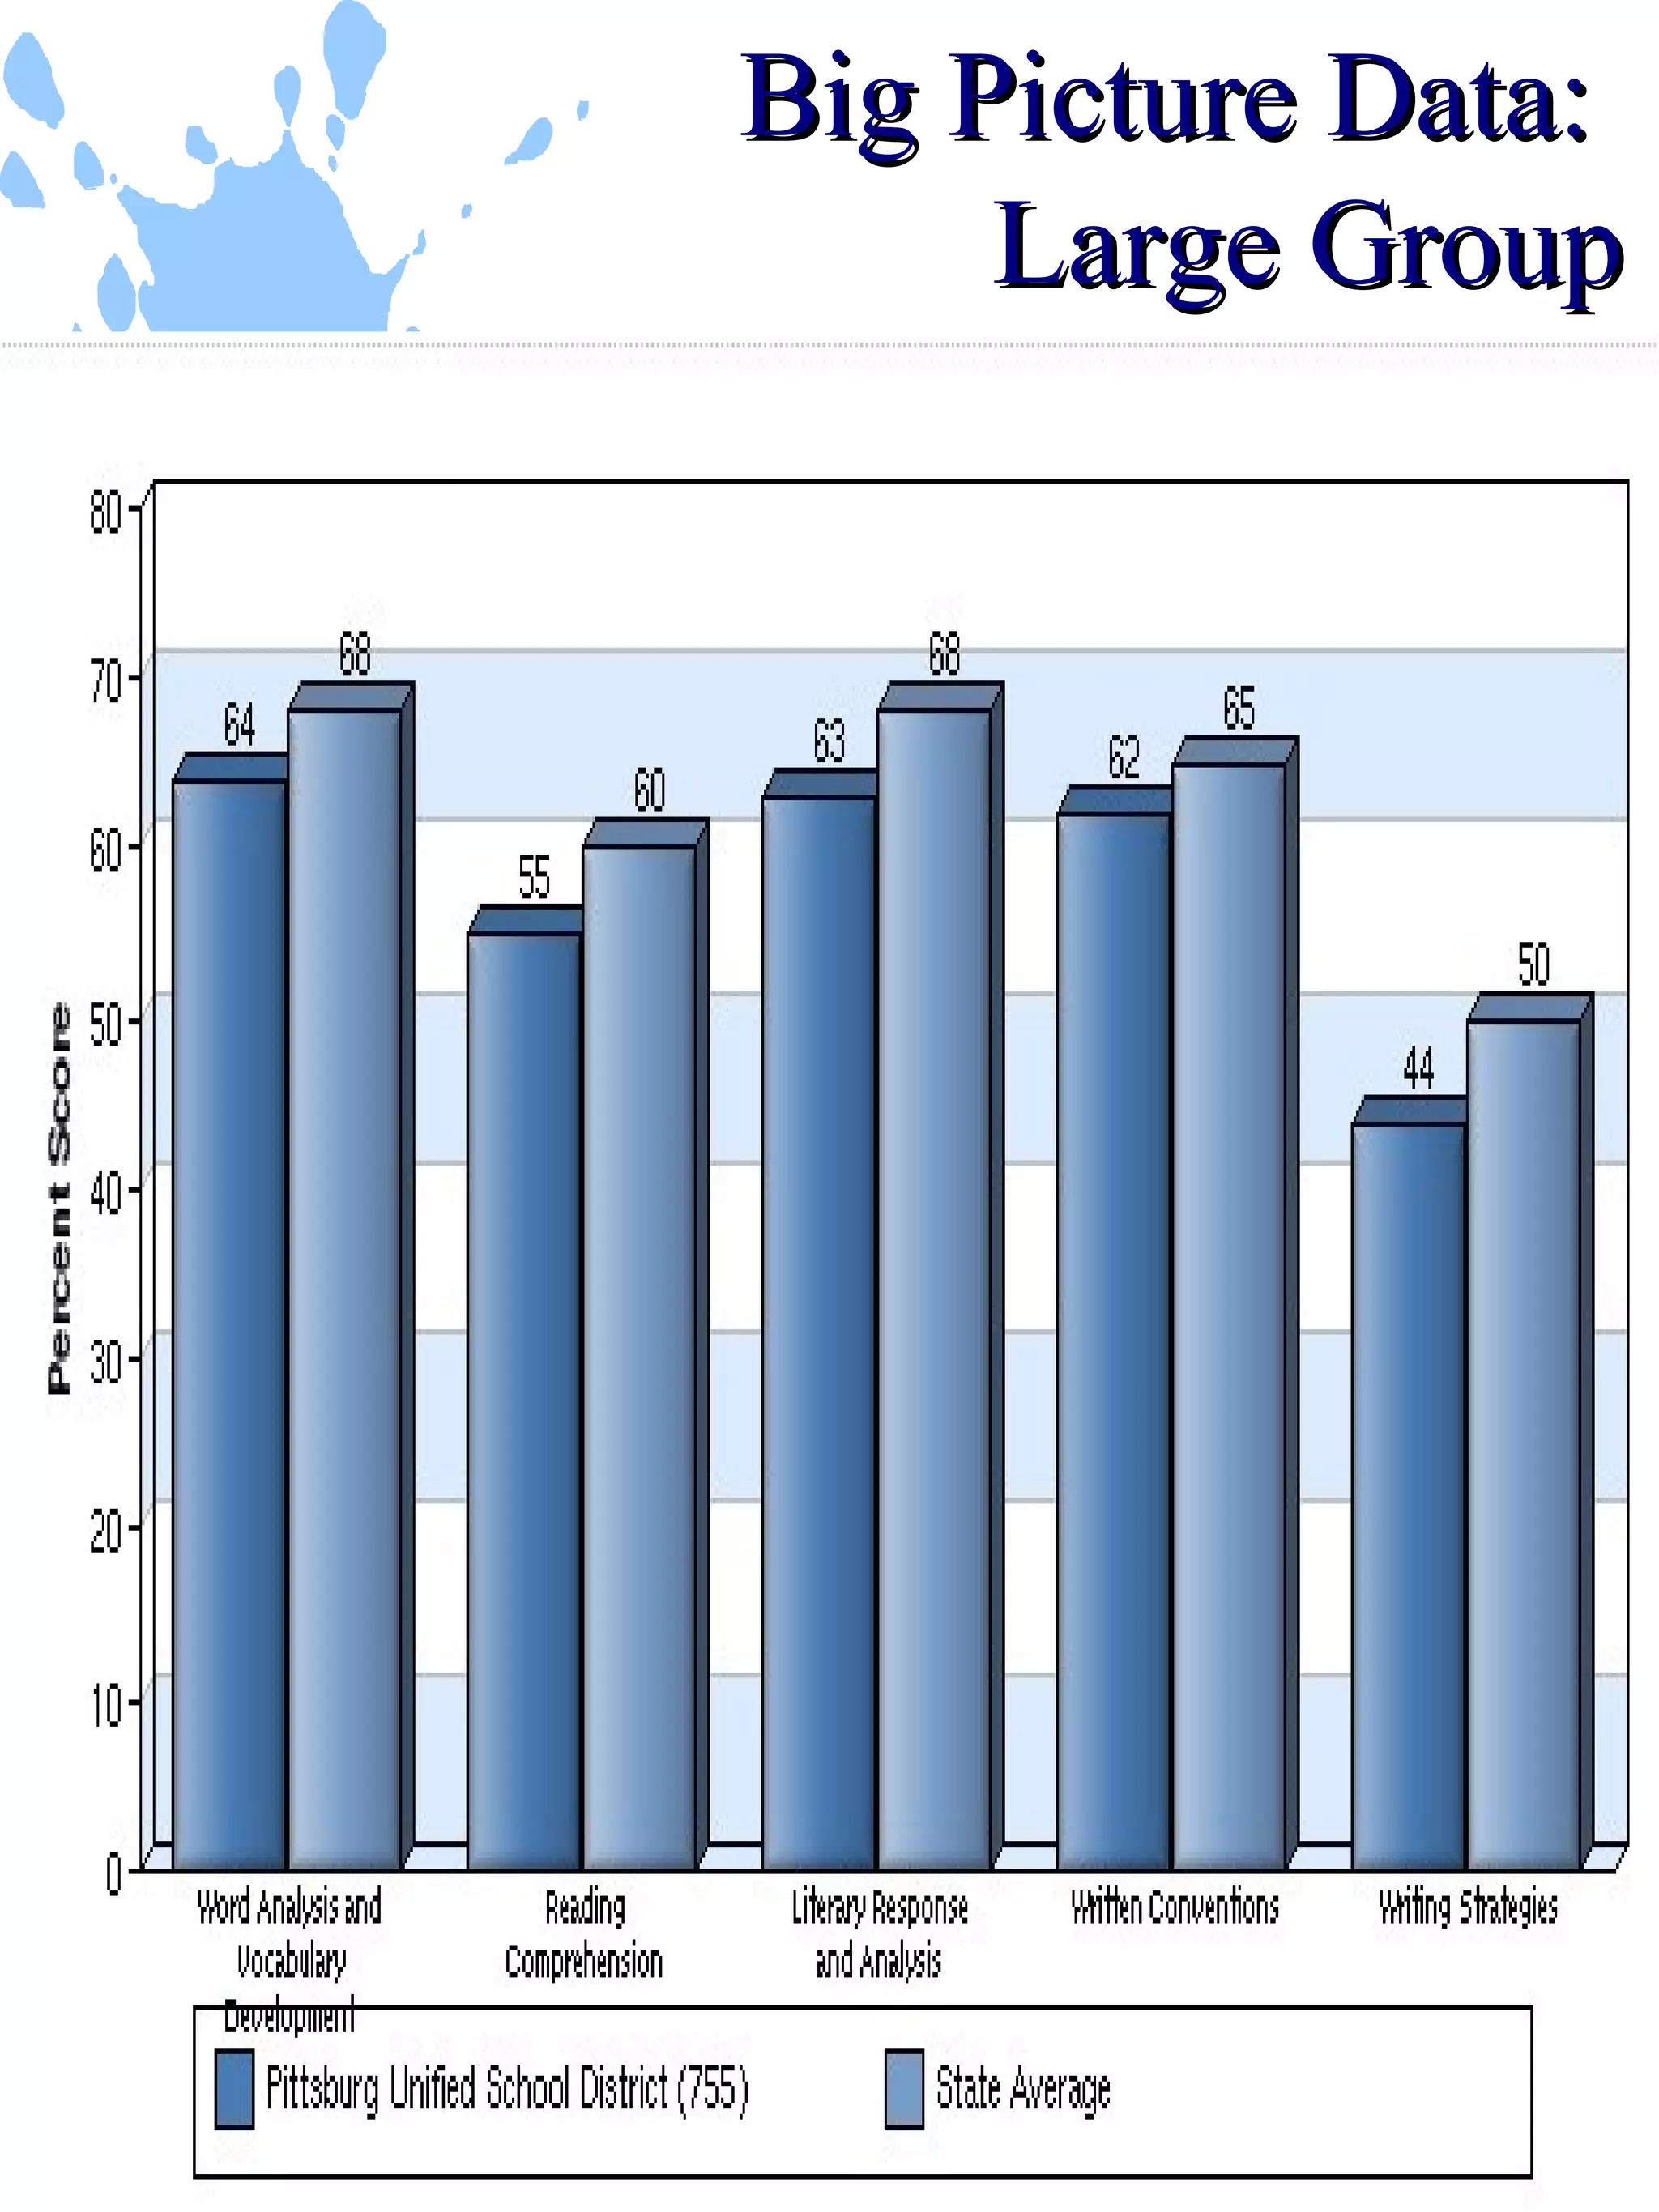
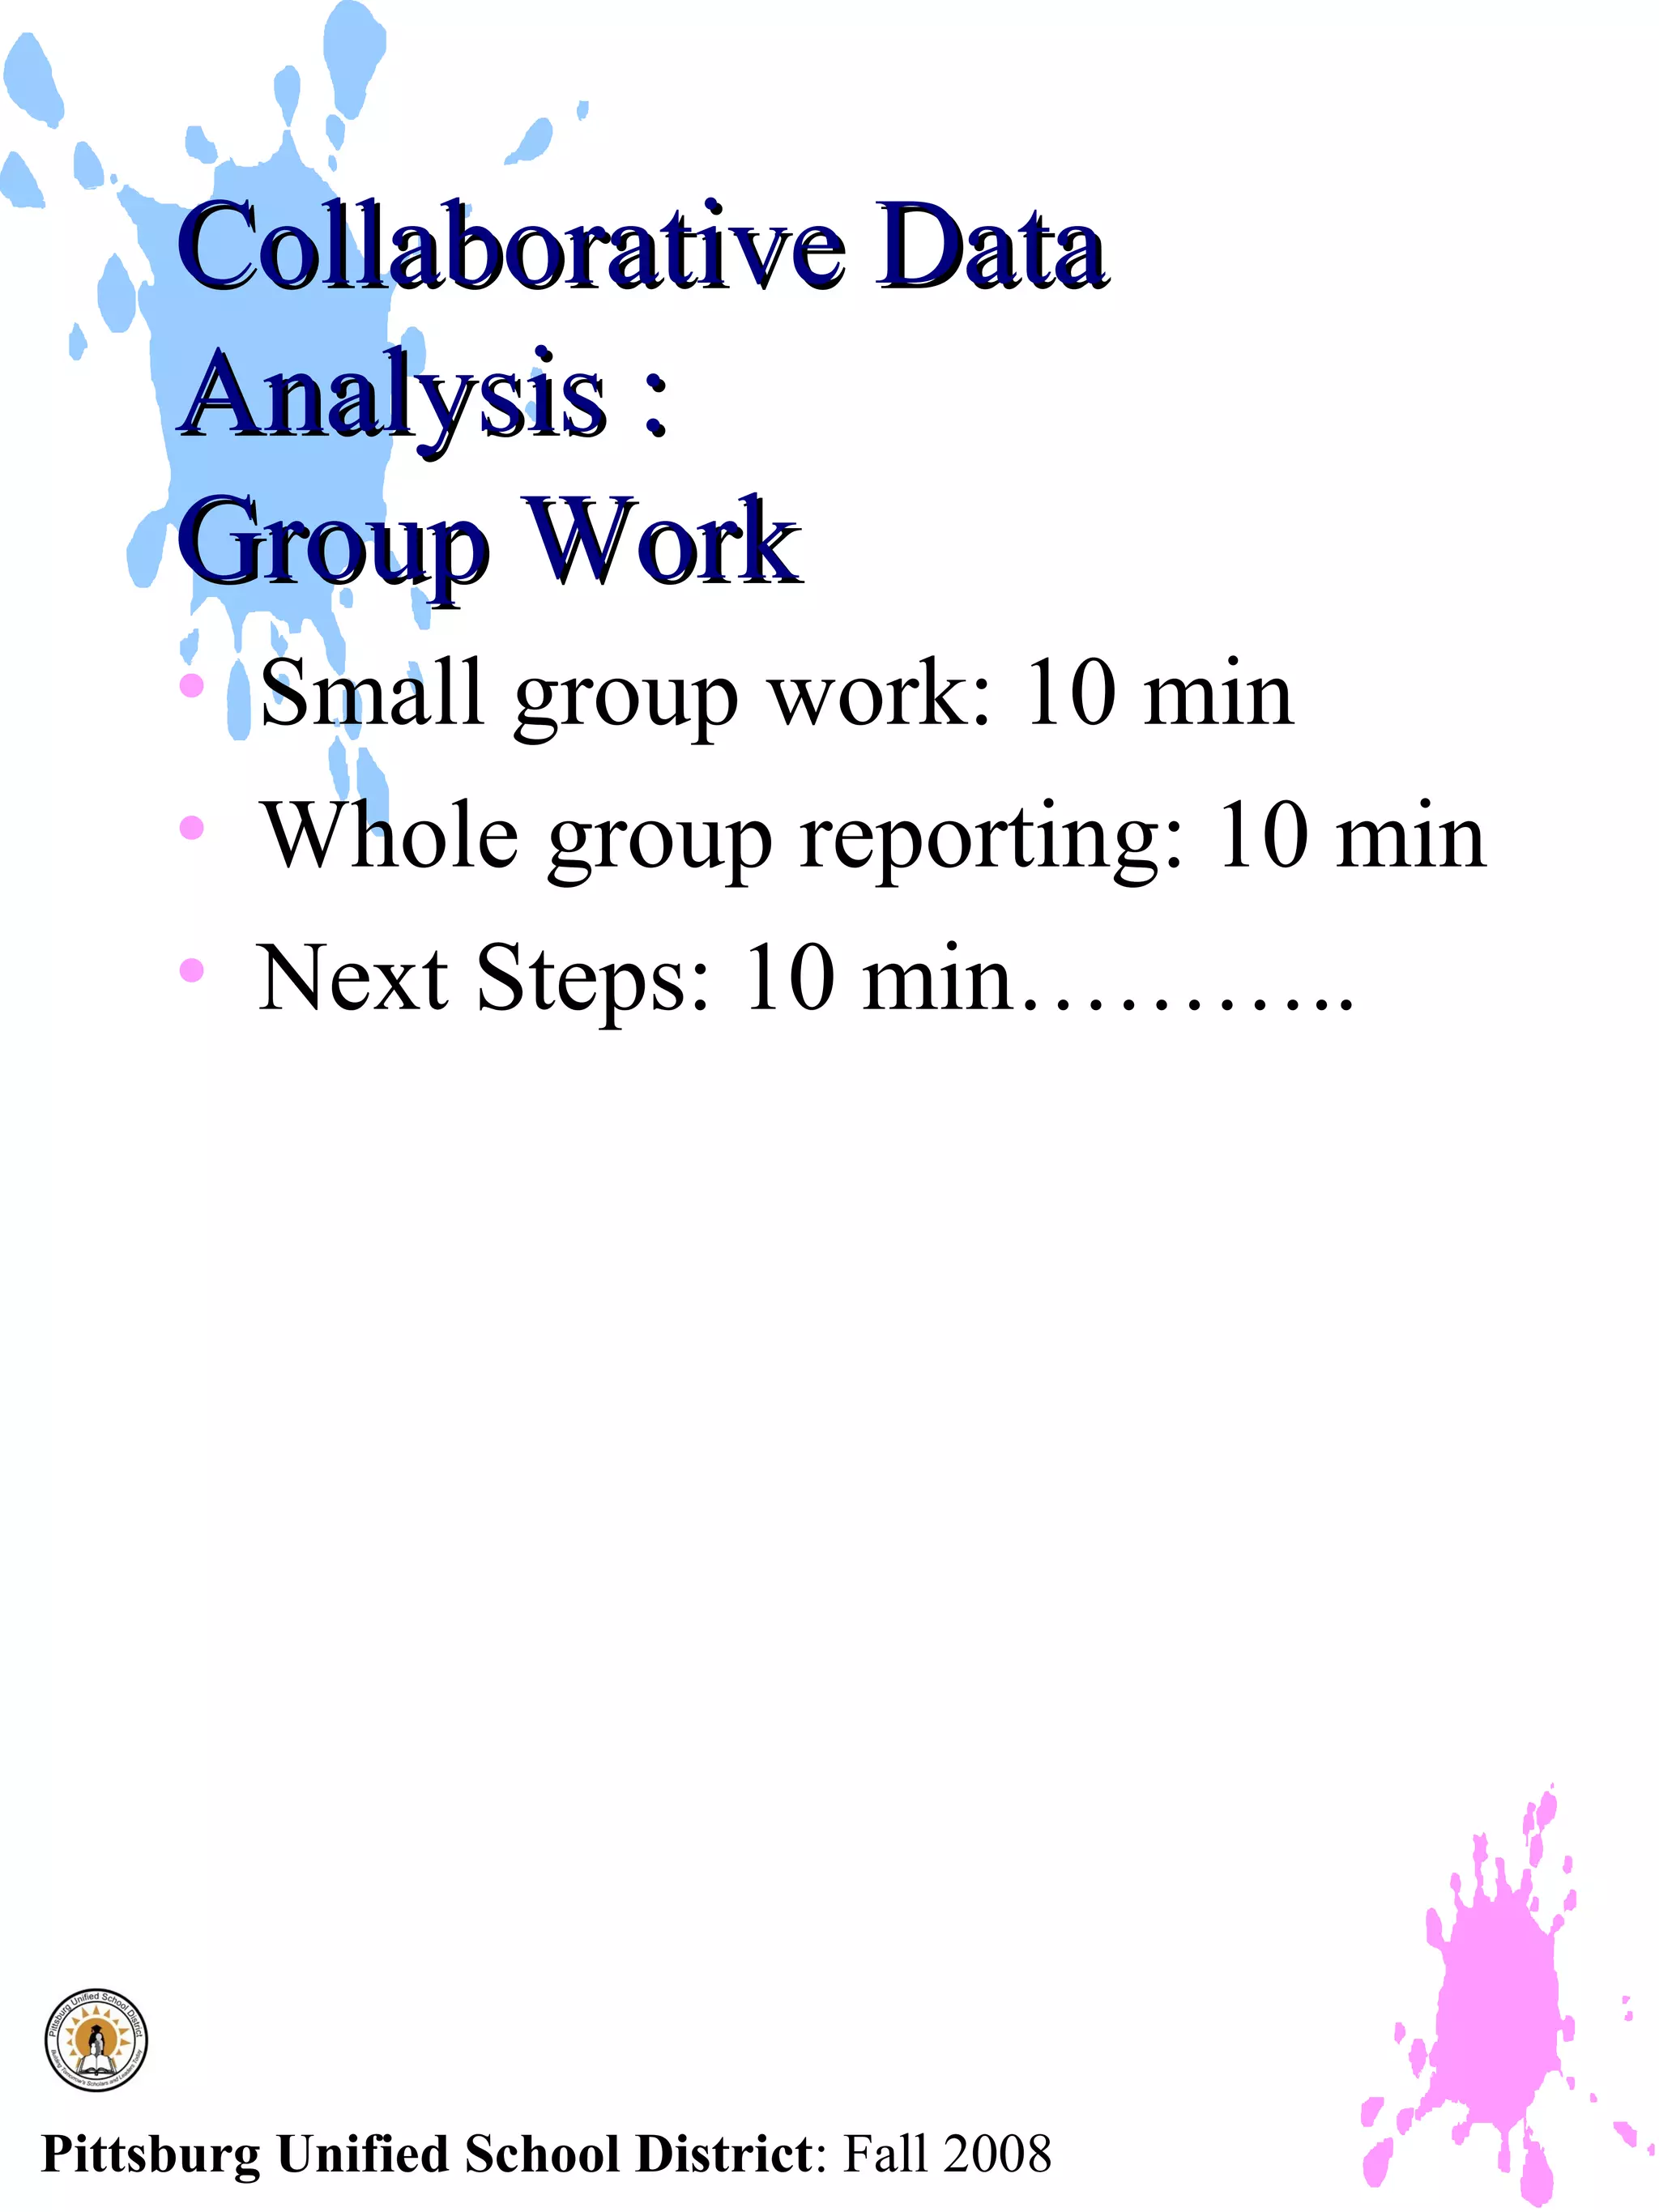

The document outlines an agenda and materials for a school district workshop on collaborative data analysis. The workshop introduces tools and reports in their online data system to help administrators and teachers analyze student performance data at the district, school, and classroom levels. Participants will work in groups to examine sample reports, discuss findings, and identify next steps for instructional improvement.


