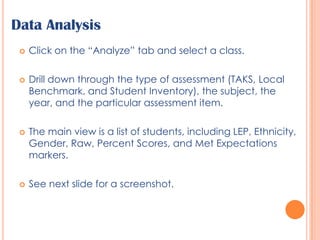
Basic Teacher Tasks in AwarePart 2: Testing and Data Analysis
Printing Answer DocumentsIf the “Test Available” button appears at the top of the classes list, then a teacher MAY print the answer documents for a class.Some campuses prefer to have the assessment coordinator print ALL the answer sheets, others may want teachers to do that.
To Print: Click on the “Test Available” buttonSelect the class periodClick the “Print Answer Sheets” button in the lower, right-hand corner.Note: If you do NOT have the “Print Answer Sheets” button, then teachers have not been given the rights to print answer sheets for this particular test.“Printing” in Eduphoria actually opens up a PDF document first. This is nice, because it allows the user to verify what they want to print is correct before actually sending it to the printer.Teachers can print all or select only the pages they want to print.
Each answer sheet is coded for the name of the student, the teacher, the course, or the test.Check the name of the test and make sure the answer sheet matches the test that is being given.
Data AnalysisClick on the “Analyze” tab and select a class.Drill down through the type of assessment (TAKS, Local Benchmark, and Student Inventory), the subject, the year, and the particular assessment item.The main view is a list of students, including LEP, Ethnicity, Gender, Raw, Percent Scores, and Met Expectations markers.See next slide for a screenshot.
This is a teacher viewing her current 3rd grader’s (1st period ELA), 2nd Grade EOY Benchmark scores from last year.
Data Analysis - Changing ViewsThere are four main data views for teachers. You can change between the main data views using the drop down list on the top toolbar. This will allow you to change between:Student ScoresStudent Objective BreakdownStudent SE BreakdownStudent Individual ResponsesOther data views below those 4 are views that have been created by campus or district staff and shared out with teachers.Click on a particular view to see how the report changes on your screen.
Data Analysis - Changing LevelsIn the right-hand corner, underneath the view title, you can adjust the scope of the data.There are two sections of options which allow you to change between:Depending on the level, you may see the columns change somewhat, as well. The data can easily be sorted per column, by clicking on a column header.Clicking again will sort the column in reverse order.
Viewing Student ProfilesIn the “Students” tab, you can search for a student in particular, or pull up your entire class list by clicking “Search” with no filters chosen.To view an individual student profile, click the student’s name in the list.The screen will automatically default to show the student’s class schedule.
Viewing Student ProfilesClick the “Tests and Scores” tab to view student testing information.TAKS SummaryStudent Subject InventoriesLocal BenchmarksCampus AssessmentsTAKS TestsYou can double-click any test to see more detailed information.
Detailed Testing InformationTo get back to the full list of testing information, click “Show All Tests” in the upper-right hand corner.
Student Testing InformationTAKS SummaryShows a graphical depiction of student testing achievement and the ability to look at scores over the years.TAKS TestsDisplays all student TAKS scores with the ability to link to further information.
Student Testing InformationStudent Subject InventoriesContains district testing information.Local BenchmarksDistrict-wide common assessments.Campus AssessmentsCampus common assessments.
Inputting Student Inventory ScoresThe only inventory scores available are the ones that have a status listed.In this screenshot, the student has a “Completed” 2008 Mathematics inventory and a 2009 Math Inventory that is “Not Set” but available to input scores into.Click the “Not Set” or “Enter Scores” label on the inventory to input scores.Next:Input scoresUpdate the student statusClick “Save”
Monitor ListsMonitor lists are used to view groups of students. In the “Analyze” tab, click “Create a Monitor List” at the bottom left-hand corner.Follow the prompts and name your new list (add a description, if necessary) and click “Next”.Search for students and add the appropriate students to the monitor list.Click “Next”, then Click “Finish”Principals will have to approve monitor lists. Once approved, the teacher can see student information for all students included in the list, even though he or she might not teach them.

Aware Teacher Basics Testing And Data Analysis

  • 1.
    Basic Teacher Tasksin AwarePart 2: Testing and Data Analysis
  • 2.
    Printing Answer DocumentsIfthe “Test Available” button appears at the top of the classes list, then a teacher MAY print the answer documents for a class.Some campuses prefer to have the assessment coordinator print ALL the answer sheets, others may want teachers to do that.
  • 3.
    To Print: Clickon the “Test Available” buttonSelect the class periodClick the “Print Answer Sheets” button in the lower, right-hand corner.Note: If you do NOT have the “Print Answer Sheets” button, then teachers have not been given the rights to print answer sheets for this particular test.“Printing” in Eduphoria actually opens up a PDF document first. This is nice, because it allows the user to verify what they want to print is correct before actually sending it to the printer.Teachers can print all or select only the pages they want to print.
  • 4.
    Each answer sheetis coded for the name of the student, the teacher, the course, or the test.Check the name of the test and make sure the answer sheet matches the test that is being given.
  • 5.
    Data AnalysisClick onthe “Analyze” tab and select a class.Drill down through the type of assessment (TAKS, Local Benchmark, and Student Inventory), the subject, the year, and the particular assessment item.The main view is a list of students, including LEP, Ethnicity, Gender, Raw, Percent Scores, and Met Expectations markers.See next slide for a screenshot.
  • 6.
    This is ateacher viewing her current 3rd grader’s (1st period ELA), 2nd Grade EOY Benchmark scores from last year.
  • 7.
    Data Analysis -Changing ViewsThere are four main data views for teachers. You can change between the main data views using the drop down list on the top toolbar. This will allow you to change between:Student ScoresStudent Objective BreakdownStudent SE BreakdownStudent Individual ResponsesOther data views below those 4 are views that have been created by campus or district staff and shared out with teachers.Click on a particular view to see how the report changes on your screen.
  • 8.
    Data Analysis -Changing LevelsIn the right-hand corner, underneath the view title, you can adjust the scope of the data.There are two sections of options which allow you to change between:Depending on the level, you may see the columns change somewhat, as well. The data can easily be sorted per column, by clicking on a column header.Clicking again will sort the column in reverse order.
  • 9.
    Viewing Student ProfilesInthe “Students” tab, you can search for a student in particular, or pull up your entire class list by clicking “Search” with no filters chosen.To view an individual student profile, click the student’s name in the list.The screen will automatically default to show the student’s class schedule.
  • 10.
    Viewing Student ProfilesClickthe “Tests and Scores” tab to view student testing information.TAKS SummaryStudent Subject InventoriesLocal BenchmarksCampus AssessmentsTAKS TestsYou can double-click any test to see more detailed information.
  • 11.
    Detailed Testing InformationToget back to the full list of testing information, click “Show All Tests” in the upper-right hand corner.
  • 12.
    Student Testing InformationTAKSSummaryShows a graphical depiction of student testing achievement and the ability to look at scores over the years.TAKS TestsDisplays all student TAKS scores with the ability to link to further information.
  • 13.
    Student Testing InformationStudentSubject InventoriesContains district testing information.Local BenchmarksDistrict-wide common assessments.Campus AssessmentsCampus common assessments.
  • 14.
    Inputting Student InventoryScoresThe only inventory scores available are the ones that have a status listed.In this screenshot, the student has a “Completed” 2008 Mathematics inventory and a 2009 Math Inventory that is “Not Set” but available to input scores into.Click the “Not Set” or “Enter Scores” label on the inventory to input scores.Next:Input scoresUpdate the student statusClick “Save”
  • 15.
    Monitor ListsMonitor listsare used to view groups of students. In the “Analyze” tab, click “Create a Monitor List” at the bottom left-hand corner.Follow the prompts and name your new list (add a description, if necessary) and click “Next”.Search for students and add the appropriate students to the monitor list.Click “Next”, then Click “Finish”Principals will have to approve monitor lists. Once approved, the teacher can see student information for all students included in the list, even though he or she might not teach them.