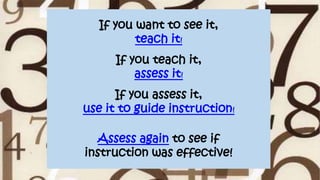
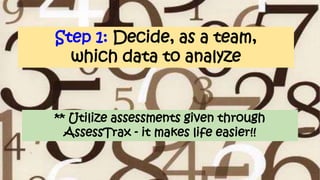
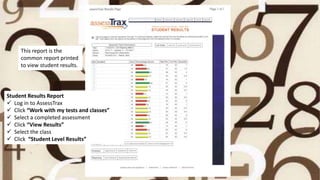
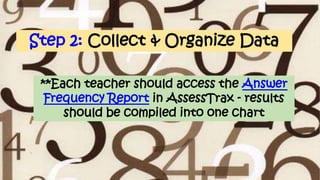
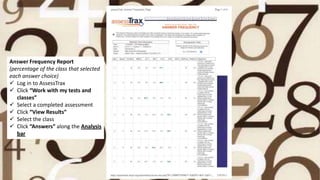
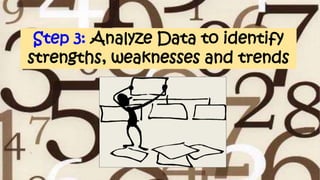
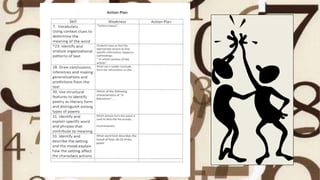
Catch them before
they fall
The Power of Data
By: Rani Baksh
If you want to see it,
teach it!
If you teach it,
assess it!
If you assess it,
use it to guide instruction!
Assess again to see if
instruction was effective!
Step 1: Decide, as a team,
which data to analyze
** Utilize assessments given through
AssessTrax - it makes life easier!!
This report is the
common report printed
to view student results.
Student Results Report
 Log in to AssessTrax
 Click “Work with my tests and classes”
 Select a completed assessment
 Click “View Results”
 Select the class
 Click “Student Level Results”
Step 2: Collect & Organize Data
**Each teacher should access the Answer
Frequency Report in AssessTrax - results
should be compiled into one chart
Answer Frequency Report
(percentage of the class that selected
each answer choice)
 Log in to AssessTrax
 Click “Work with my tests and
classes”
 Select a completed assessment
 Click “View Results”
 Select the class
 Click “Answers” along the Analysis
bar
Teachers should combine
frequency scores in one chart. The
chart should be saved on the
shared drive and each teacher can
in their own scores. A
 Any score below 70% should
be marked in red.
 Look for trends.
 Skills that indicate weakness
should be noted.
Step 3: Analyze Data to identify
strengths, weaknesses and trends
What other data can
AssessTrax give us?
AssessTrax can also give us reports called
Matrix Reports, which include:
1. Student Answers by Question Number
2. Student Scores by Objective
3. A Description of the Objectives addressed on
each assessment
4. Question Descriptions (not available for benchmarks)
5. The ability to group student results according to
assessment performance
 Log in to AssessTrax
 Click “Work with my tests and classes”
 Select a completed assessment
 Click “View Results”
 Select the class
 Click “Class Reports” along the Reporting bar
 Click on “Matrix Reports”
 Click “Continue”
 Select “Yes” and “Color” under Report Options
 You can select all students, or specific groups of students you’d like to analyze – you will
always get the same 4 reports
 Click “Continue”
 You will get a message box notifying you that the report may take several minutes to
generate – click “OK”
 Select “Get Printed Report”
Steps to Assess Matrix Reports
Identify and click on scores below 70%
Assesstraxs will group students and highlight which
questions students struggled on . Wrong answers
are marked in pink. Search for patterns!
Criteria: Students grouped by scored
and questions.
The on level group of students. Trends
start to emerge.
With students that scored high, you can target
specific questions.
Another option, analyze by two different
criteria. This report shows students grouped by
score and objective.
Middle group 70%- 80%
Students scoring >90%
When classroom instruction is not
enough….
strategically plan to do more!
Step 4: Create an Action Plan
** Share ideas, strategies and lesson plans
that have been successful
Good decisions are based on data.
Better decisions are made after
collecting and examining data,
reflecting on alternatives, and getting
feedback from others.

Data analysispp[2]

  • 1.
    Catch them before theyfall The Power of Data By: Rani Baksh
  • 2.
    If you wantto see it, teach it! If you teach it, assess it! If you assess it, use it to guide instruction! Assess again to see if instruction was effective!
  • 3.
    Step 1: Decide,as a team, which data to analyze ** Utilize assessments given through AssessTrax - it makes life easier!!
  • 4.
    This report isthe common report printed to view student results. Student Results Report  Log in to AssessTrax  Click “Work with my tests and classes”  Select a completed assessment  Click “View Results”  Select the class  Click “Student Level Results”
  • 5.
    Step 2: Collect& Organize Data **Each teacher should access the Answer Frequency Report in AssessTrax - results should be compiled into one chart
  • 6.
    Answer Frequency Report (percentageof the class that selected each answer choice)  Log in to AssessTrax  Click “Work with my tests and classes”  Select a completed assessment  Click “View Results”  Select the class  Click “Answers” along the Analysis bar
  • 7.
    Teachers should combine frequencyscores in one chart. The chart should be saved on the shared drive and each teacher can in their own scores. A  Any score below 70% should be marked in red.  Look for trends.  Skills that indicate weakness should be noted.
  • 10.
    Step 3: AnalyzeData to identify strengths, weaknesses and trends
  • 11.
    What other datacan AssessTrax give us?
  • 12.
    AssessTrax can alsogive us reports called Matrix Reports, which include: 1. Student Answers by Question Number 2. Student Scores by Objective 3. A Description of the Objectives addressed on each assessment 4. Question Descriptions (not available for benchmarks) 5. The ability to group student results according to assessment performance
  • 13.
     Log into AssessTrax  Click “Work with my tests and classes”  Select a completed assessment  Click “View Results”  Select the class  Click “Class Reports” along the Reporting bar  Click on “Matrix Reports”  Click “Continue”  Select “Yes” and “Color” under Report Options  You can select all students, or specific groups of students you’d like to analyze – you will always get the same 4 reports  Click “Continue”  You will get a message box notifying you that the report may take several minutes to generate – click “OK”  Select “Get Printed Report” Steps to Assess Matrix Reports
  • 14.
    Identify and clickon scores below 70% Assesstraxs will group students and highlight which questions students struggled on . Wrong answers are marked in pink. Search for patterns! Criteria: Students grouped by scored and questions.
  • 15.
    The on levelgroup of students. Trends start to emerge.
  • 16.
    With students thatscored high, you can target specific questions.
  • 17.
    Another option, analyzeby two different criteria. This report shows students grouped by score and objective.
  • 18.
  • 19.
  • 21.
    When classroom instructionis not enough…. strategically plan to do more!
  • 22.
    Step 4: Createan Action Plan ** Share ideas, strategies and lesson plans that have been successful
  • 24.
    Good decisions arebased on data. Better decisions are made after collecting and examining data, reflecting on alternatives, and getting feedback from others.