What is ANOVA?
-is a statistical method used to
compare the means of two or more
groups to determine if there's a
statistically significant difference
between them.
3.
Mathematically, ANOVA breaksdown
the total variability in the data into two
components:
Within-Group Variability:
Variability caused by differences within
individual groups, reflecting random
fluctuations.
5.
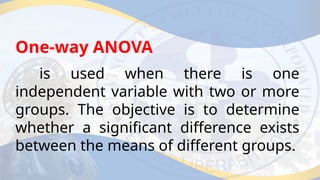
is used whenthere is one
independent variable with two or more
groups. The objective is to determine
whether a significant difference exists
between the means of different groups.
One-way ANOVA
6.
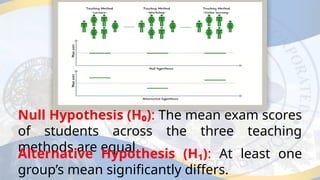
Null Hypothesis (H₀):The mean exam scores
of students across the three teaching
methods are equal
Alternative Hypothesis (H₁): At least one
group’s mean significantly differs.
7.
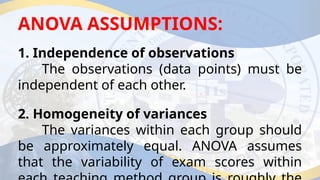
ANOVA ASSUMPTIONS:
1. Independenceof observations
The observations (data points) must be
independent of each other.
2. Homogeneity of variances
The variances within each group should
be approximately equal. ANOVA assumes
that the variability of exam scores within
8.
3. Normal distribution
Thedata within each group should follow
a normal distribution.
Note: If any assumptions are violated,
the test results may be invalid.
9.
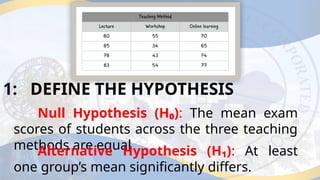
1: DEFINE THEHYPOTHESIS
Null Hypothesis (H₀): The mean exam
scores of students across the three teaching
methods are equal
Alternative Hypothesis (H₁): At least
one group’s mean significantly differs.
10.
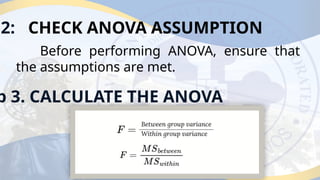
2: CHECK ANOVAASSUMPTION
Before performing ANOVA, ensure that
the assumptions are met.
p 3. CALCULATE THE ANOVA
11.
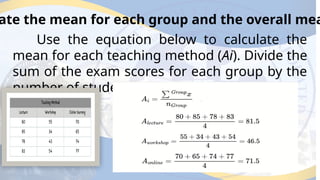
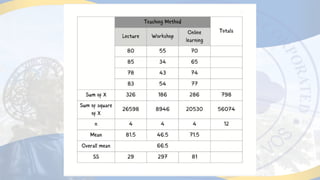
ate the meanfor each group and the overall mea
Use the equation below to calculate the
mean for each teaching method (Ai). Divide the
sum of the exam scores for each group by the
number of students in each group.
12.
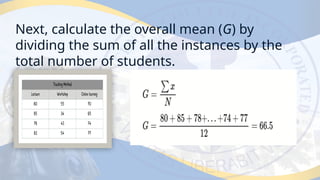
Next, calculate theoverall mean (G) by
dividing the sum of all the instances by the
total number of students.
13.
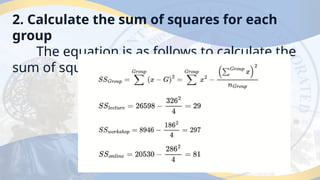
2. Calculate thesum of squares for each
group
The equation is as follows to calculate the
sum of squares for each group.
15.
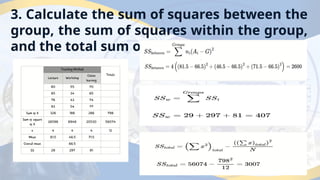
3. Calculate thesum of squares between the
group, the sum of squares within the group,
and the total sum of squares.
16.
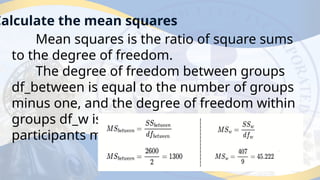
Calculate the meansquares
Mean squares is the ratio of square sums
to the degree of freedom.
The degree of freedom between groups
df_between is equal to the number of groups
minus one, and the degree of freedom within
groups df_w is equal to the total number of
participants minus the number of groups.
17.
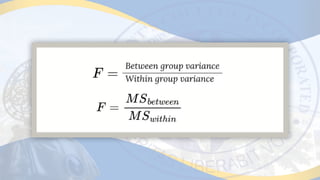
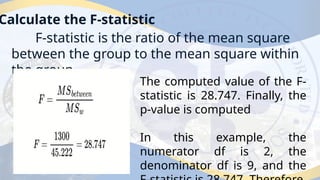
Calculate the F-statistic
F-statisticis the ratio of the mean square
between the group to the mean square within
the group.
The computed value of the F-
statistic is 28.747. Finally, the
p-value is computed
In this example, the
numerator df is 2, the
denominator df is 9, and the
18.
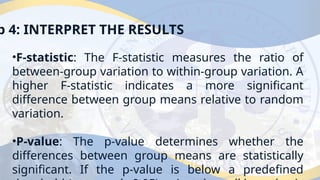
p 4: INTERPRETTHE RESULTS
•F-statistic: The F-statistic measures the ratio of
between-group variation to within-group variation. A
higher F-statistic indicates a more significant
difference between group means relative to random
variation.
•P-value: The p-value determines whether the
differences between group means are statistically
significant. If the p-value is below a predefined
19.
The p-value is0.000123, and we would
reject the null hypothesis to conclude that
the teaching method significantly affects
exam scores.
CONCLUSI
ON:
20.
What is aPOST-HOC TEST?
are statistical procedures used after an
ANOVA (Analysis of Variance) to determine
which specific group means differ
significantly from each other.
21.
When to use?
theyare used when an ANOVA test is
conducted on three or more groups, and the
F-Test is statistically significant.
Why they are needed?
ANOVA tests whether there's a significant
difference among multiple group means, but
it doesn't specify which specific means
differ. Post hoc tests are designed to address