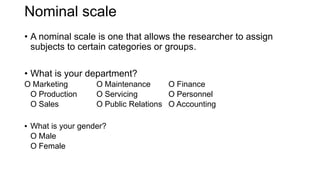
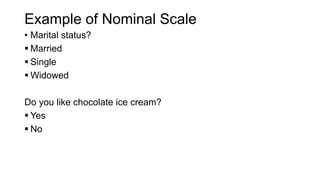
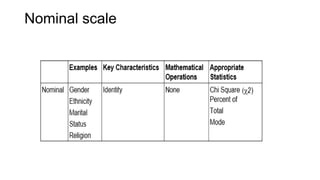
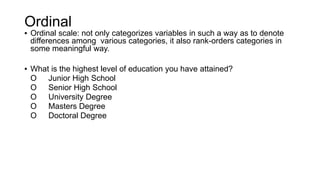
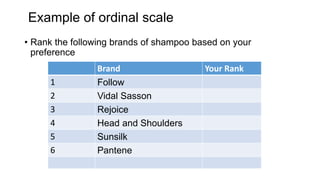
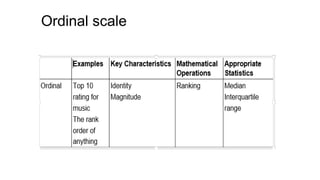
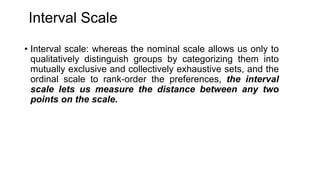
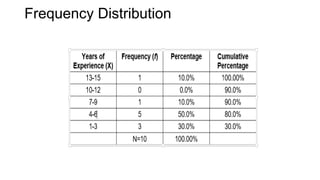
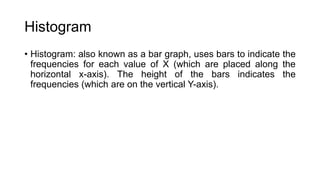
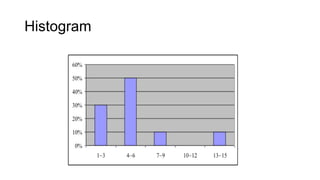
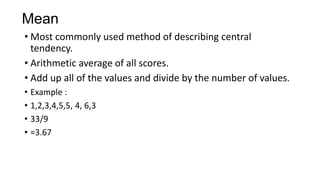
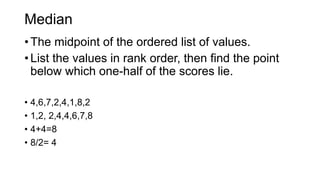
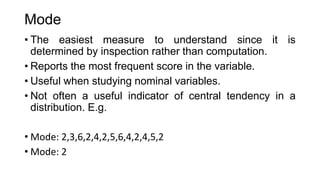
International Business Research
Measurement of Variables: Scaling, Reliability,
Validity
Joseph Owusu, PhD
Department of Marketing and Corporate Strategy
Ksb-Knust
Objectives
• To understand how research variables are measured
• Discuss types of scales
• Discuss the basic descriptive statistics in research
Measurement
• To measure is to assign a value (number) to objects, events or
outcomes of an event according to specified rules.
• In a research project, the researcher does not measure the
respondent but measures the characteristics of the respondent
• The characteristics of interest for the study are called variables.
measurement
• Example: consumer preferences towards certain food
outlets, the researcher does not measure consumer but the
variables such as consumer
• Age
• Gender
• Preference
• Perception
• Attitude
• Amount of purchase
Measurement
• The researcher assigns numbers to objects of the study
according to certain pre-specified rules.
• The specification rules for assigning numbers or values to the
characteristics of the objects are the most important aspect of
measurement.
• That is, the assignment of values or numbers to the object must
be isomorphic.
• Isomorphic means that there must be a one- to- one
correspondence (relationship) between the figure and the
characteristic being measured
Example: measurement of growth
• Compared to other similar firms in the industry, our
business over the past 3 years…..
1. Constantly experience increase in sales
2. Has employed more people
3. Has opened more branches
4. Has acquired sufficient assets
5. Constantly increased its market share
•
Scale
• Scale: tool or mechanism by which individuals
are distinguished as to how they differ from one
another on the variables of interest to our study.
Types of measurement scale
Four Levels of Measurement scales
1. Nominal
2. Ordinal
3. Interval
4. Ratio
Nominal scale
• A nominal scale is one that allows the researcher to assign
subjects to certain categories or groups.
• What is your department?
O Marketing O Maintenance O Finance
O Production O Servicing O Personnel
O Sales O Public Relations O Accounting
▪ What is your gender?
O Male
O Female
Example of Nominal Scale
• Marital status?
 Married
 Single
 Widowed
Do you like chocolate ice cream?
 Yes
 No
Nominal Scale
Nominal scale
Ordinal
▪ Ordinal scale: not only categorizes variables in such a way as to denote
differences among various categories, it also rank-orders categories in
some meaningful way.
▪ What is the highest level of education you have attained?
O Junior High School
O Senior High School
O University Degree
O Masters Degree
O Doctoral Degree
Ordinal
Example of ordinal scale
• Rank the following brands of shampoo based on your
preference
Brand Your Rank
1 Follow
2 Vidal Sasson
3 Rejoice
4 Head and Shoulders
5 Sunsilk
6 Pantene
Ordinal scale
Interval Scale
• Interval scale: whereas the nominal scale allows us only to
qualitatively distinguish groups by categorizing them into
mutually exclusive and collectively exhaustive sets, and the
ordinal scale to rank-order the preferences, the interval
scale lets us measure the distance between any two
points on the scale.
Interval Scale
Circle the number that represents your feelings at this particular moment
best. There are no right or wrong answers. Please answer every question.
1.I invest more in my work than I get out of it
I strongly disagree 1 2 3 4 5 I strongly agree
2. I exert myself too much considering what I get back in return
I strongly disagree 1 2 3 4 5 I strongly agree
3. For the efforts I put into the organization, I get much in return
I strongly disagree 1 2 3 4 5 I strongly agree
The numbers represent opinion
1. Strongly Disagree
2. Disagree
3. Not Sure
4. Agree
5. Strongly Agree
Interval Scale
Interval
Ratio Scale
The ratio scale describe variables that have equal intervals
between them but also have absolute zeros.
Meaning that they are variables for which one possible value is
zero.
Ratio scales assign absolute rather than relatives quantities.
Ratio scale is the highest level of measurement among the
four scales.
However in behavioural research interval scale is typically the
appropriate measurements.
Example of ratio scale
• How much do you pay for your rent?
• How long does it take you to drive to the office everyday?
• How many school-going children are there in your family?
Ratio Scale
Ratio
Classification of scale
• There are so many ways of classifying scale of an object in the
study. However most researchers employ 3 types
• Categorical scale (voting scale)
• Comparative scale (ranking scale)
• Rating scale
• Categorical scale (voting scale)
• Dichotomous scale e.g., Do you like pizza? (Yes, No)
• Category scale e.g., please state your gender ( male and
female)
• Likert scale by Rensis Likert. Designed to examine how
strongly respondents agree or disagree with a given statement.
Validity
• Validity: Is the measure, measuring what it
supposed to measure.
• Validity: Are we measuring the right thing?
• Validity: The extent to which a test measures
the construct is intended to measure.
Reliability
• Reliability of measure indicates extent to which it is without bias
and hence ensures consistent measurement across time
(stability) and across the various items in the instrument
(internal consistency).
Descriptive Statistics
• Descriptive Statistics are used to describe the basic
features of the data in a study including what the
data are or what they show.
• The Frequency Distribution is a summary of the
frequency of individual values or ranges of values for a
variable.
Frequency Distribution
Histogram
• Histogram: also known as a bar graph, uses bars to indicate the
frequencies for each value of X (which are placed along the
horizontal x-axis). The height of the bars indicates the
frequencies (which are on the vertical Y-axis).
Histogram
Measures of Central Tendency
• There are several common methods to estimate
measure of central tendency.
• Intended to describe the most average scores in
the distribution.
• Most common measures are the mean, the
median, and the mode.
Mean
• Most commonly used method of describing central
tendency.
• Arithmetic average of all scores.
• Add up all of the values and divide by the number of values.
• Example :
• 1,2,3,4,5,5, 4, 6,3
• 33/9
• =3.67
Median
• The midpoint of the ordered list of values.
• List the values in rank order, then find the point
below which one-half of the scores lie.
• 4,6,7,2,4,1,8,2
• 1,2, 2,4,4,6,7,8
• 4+4=8
• 8/2= 4
Mode
• The easiest measure to understand since it is
determined by inspection rather than computation.
• Reports the most frequent score in the variable.
• Useful when studying nominal variables.
• Not often a useful indicator of central tendency in a
distribution. E.g.
• Mode: 2,3,6,2,4,2,5,6,4,2,4,5,2
• Mode: 2
IBR 5.pptx

IBR 5.pptx

  • 1.
    International Business Research Measurementof Variables: Scaling, Reliability, Validity Joseph Owusu, PhD Department of Marketing and Corporate Strategy Ksb-Knust
  • 2.
    Objectives • To understandhow research variables are measured • Discuss types of scales • Discuss the basic descriptive statistics in research
  • 3.
    Measurement • To measureis to assign a value (number) to objects, events or outcomes of an event according to specified rules. • In a research project, the researcher does not measure the respondent but measures the characteristics of the respondent • The characteristics of interest for the study are called variables.
  • 4.
    measurement • Example: consumerpreferences towards certain food outlets, the researcher does not measure consumer but the variables such as consumer • Age • Gender • Preference • Perception • Attitude • Amount of purchase
  • 5.
    Measurement • The researcherassigns numbers to objects of the study according to certain pre-specified rules. • The specification rules for assigning numbers or values to the characteristics of the objects are the most important aspect of measurement. • That is, the assignment of values or numbers to the object must be isomorphic. • Isomorphic means that there must be a one- to- one correspondence (relationship) between the figure and the characteristic being measured
  • 6.
    Example: measurement ofgrowth • Compared to other similar firms in the industry, our business over the past 3 years….. 1. Constantly experience increase in sales 2. Has employed more people 3. Has opened more branches 4. Has acquired sufficient assets 5. Constantly increased its market share •
  • 7.
    Scale • Scale: toolor mechanism by which individuals are distinguished as to how they differ from one another on the variables of interest to our study.
  • 8.
    Types of measurementscale Four Levels of Measurement scales 1. Nominal 2. Ordinal 3. Interval 4. Ratio
  • 9.
    Nominal scale • Anominal scale is one that allows the researcher to assign subjects to certain categories or groups. • What is your department? O Marketing O Maintenance O Finance O Production O Servicing O Personnel O Sales O Public Relations O Accounting ▪ What is your gender? O Male O Female
  • 10.
    Example of NominalScale • Marital status?  Married  Single  Widowed Do you like chocolate ice cream?  Yes  No
  • 11.
  • 12.
  • 13.
    Ordinal ▪ Ordinal scale:not only categorizes variables in such a way as to denote differences among various categories, it also rank-orders categories in some meaningful way. ▪ What is the highest level of education you have attained? O Junior High School O Senior High School O University Degree O Masters Degree O Doctoral Degree
  • 14.
  • 15.
    Example of ordinalscale • Rank the following brands of shampoo based on your preference Brand Your Rank 1 Follow 2 Vidal Sasson 3 Rejoice 4 Head and Shoulders 5 Sunsilk 6 Pantene
  • 16.
  • 17.
    Interval Scale • Intervalscale: whereas the nominal scale allows us only to qualitatively distinguish groups by categorizing them into mutually exclusive and collectively exhaustive sets, and the ordinal scale to rank-order the preferences, the interval scale lets us measure the distance between any two points on the scale.
  • 18.
    Interval Scale Circle thenumber that represents your feelings at this particular moment best. There are no right or wrong answers. Please answer every question. 1.I invest more in my work than I get out of it I strongly disagree 1 2 3 4 5 I strongly agree 2. I exert myself too much considering what I get back in return I strongly disagree 1 2 3 4 5 I strongly agree 3. For the efforts I put into the organization, I get much in return I strongly disagree 1 2 3 4 5 I strongly agree
  • 19.
    The numbers representopinion 1. Strongly Disagree 2. Disagree 3. Not Sure 4. Agree 5. Strongly Agree
  • 20.
  • 21.
  • 22.
    Ratio Scale The ratioscale describe variables that have equal intervals between them but also have absolute zeros. Meaning that they are variables for which one possible value is zero. Ratio scales assign absolute rather than relatives quantities. Ratio scale is the highest level of measurement among the four scales. However in behavioural research interval scale is typically the appropriate measurements.
  • 23.
    Example of ratioscale • How much do you pay for your rent? • How long does it take you to drive to the office everyday? • How many school-going children are there in your family?
  • 24.
  • 25.
  • 26.
    Classification of scale •There are so many ways of classifying scale of an object in the study. However most researchers employ 3 types • Categorical scale (voting scale) • Comparative scale (ranking scale) • Rating scale • Categorical scale (voting scale) • Dichotomous scale e.g., Do you like pizza? (Yes, No) • Category scale e.g., please state your gender ( male and female) • Likert scale by Rensis Likert. Designed to examine how strongly respondents agree or disagree with a given statement.
  • 27.
    Validity • Validity: Isthe measure, measuring what it supposed to measure. • Validity: Are we measuring the right thing? • Validity: The extent to which a test measures the construct is intended to measure.
  • 28.
    Reliability • Reliability ofmeasure indicates extent to which it is without bias and hence ensures consistent measurement across time (stability) and across the various items in the instrument (internal consistency).
  • 29.
    Descriptive Statistics • DescriptiveStatistics are used to describe the basic features of the data in a study including what the data are or what they show. • The Frequency Distribution is a summary of the frequency of individual values or ranges of values for a variable.
  • 30.
  • 31.
    Histogram • Histogram: alsoknown as a bar graph, uses bars to indicate the frequencies for each value of X (which are placed along the horizontal x-axis). The height of the bars indicates the frequencies (which are on the vertical Y-axis).
  • 32.
  • 33.
    Measures of CentralTendency • There are several common methods to estimate measure of central tendency. • Intended to describe the most average scores in the distribution. • Most common measures are the mean, the median, and the mode.
  • 34.
    Mean • Most commonlyused method of describing central tendency. • Arithmetic average of all scores. • Add up all of the values and divide by the number of values. • Example : • 1,2,3,4,5,5, 4, 6,3 • 33/9 • =3.67
  • 35.
    Median • The midpointof the ordered list of values. • List the values in rank order, then find the point below which one-half of the scores lie. • 4,6,7,2,4,1,8,2 • 1,2, 2,4,4,6,7,8 • 4+4=8 • 8/2= 4
  • 36.
    Mode • The easiestmeasure to understand since it is determined by inspection rather than computation. • Reports the most frequent score in the variable. • Useful when studying nominal variables. • Not often a useful indicator of central tendency in a distribution. E.g. • Mode: 2,3,6,2,4,2,5,6,4,2,4,5,2 • Mode: 2