
Recommended
More Related Content
Similar to Unit 12 lesson 1 2 statistics dot plots
Similar to Unit 12 lesson 1 2 statistics dot plots (20)
More from mlabuski
More from mlabuski (20)
Unit 12 lesson 1 2 statistics dot plots
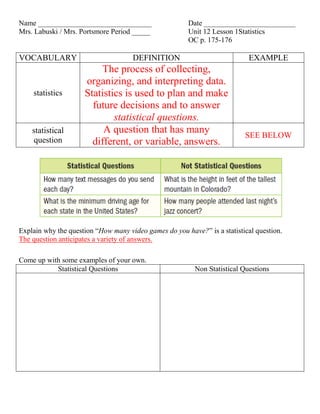
- 1. Name _______________________________ Date _________________________ Mrs. Labuski / Mrs. Portsmore Period _____ Unit 12 Lesson 1Statistics OC p. 175-176 VOCABULARY DEFINITION EXAMPLE statistics The process of collecting, organizing, and interpreting data. Statistics is used to plan and make future decisions and to answer statistical questions. statistical question A question that has many different, or variable, answers. SEE BELOW Explain why the question “How many video games do you have?” is a statistical question. The question anticipates a variety of answers. Come up with some examples of your own. Statistical Questions Non Statistical Questions
- 2. VOCABULARY DEFINITION EXAMPLE dot plots A visual display in which each piece of data is represented by a dot above a number line. Tina asked her friends how many songs they downloaded this week and the results are shown in the table. Number of Songs Downloaded 1, 3, 1, 4, 2, 3, 2, 6, 3, 3 How many songs were downloaded?10 What was the least number of downloads? 1 What was the greatest number of downloads? 6 Label the number line from the least number of downloads to the great number of downloads. For each data value, draw a dot above the appropriate number. If a value repeats, draw a second dot directly about the previous dot. How does a dot plot help you describe a data set? A dot plot can show where data are clustered and where there are peaks/gaps in the data. The dot plot above shows a cluster at 1, 2, 3 with a peak at three so most of Tina’s friends downloaded three songs. There’s a gap between 4 and 6. The frequency of a data value is the number of times it occurs in a data set. How can you tell the frequency of a data value by looking at a dot plot? Count the number of dots above the data value.
- 3. Name _______________________________ Date _________________________ Mrs. Labuski / Mrs. Portsmore Period _____ Unit 12 Lesson 1Statistics OC p. 175-176 VOCABULARY DEFINITION EXAMPLE statistics statistical question SEE BELOW Explain why the question “How many video games do you have?” is a statistical question. _____________________________________________________________________________ _____________________________________________________________________________ Come up with some examples of your own. Statistical Questions Non Statistical Questions
- 4. VOCABULARY DEFINITION EXAMPLE dot plots Tina asked her friends how many songs they downloaded this week and the results are shown in the table. Number of Songs Downloaded 1, 3, 1, 4, 2, 3, 2, 6, 3, 3 How many songs were downloaded? _____________________________________ What was the least number of downloads? _______________________________________ What was the greatest number of downloads? ____________________________________ Label the number line from the least number of downloads to the great number of downloads. For each data value, draw a dot above the appropriate number. If a value repeats, draw a second dot directly about the previous dot. How does a dot plot help you describe a data set? _____________________________________________________________________________ _____________________________________________________________________________ _____________________________________________________________________________ The frequency of a data value is the number of times it occurs in a data set. How can you tell the frequency of a data value by looking at a dot plot? __________________________________________________________________________