1. Name: ____________________________________
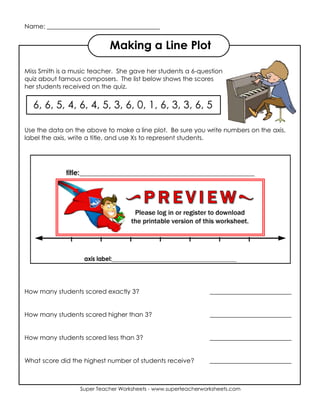
Making a Line Plot
Miss Smith is a music teacher. She gave her students a 6-question
quiz about famous composers. The list below shows the scores
her students received on the quiz.
6, 6, 5, 4, 6, 4, 5, 3, 6, 0, 1, 6, 3, 3, 6, 5
Use the data on the above to make a line plot. Be sure you write numbers on the axis,
label the axis, write a title, and use Xs to represent students.
How many students scored exactly 3? __________________________
How many students scored higher than 3? __________________________
How many students scored less than 3? __________________________
What score did the highest number of students receive? __________________________
Super Teacher Worksheets - www.superteacherworksheets.com
2. ANSWER KEY
Making a Line Plot
Miss Smith is a music teacher. She gave her students a 6-question
quiz about famous composers. The list below shows the scores
her students received on the quiz.
6, 6, 5, 4, 6, 4, 5, 3, 6, 0, 1, 6, 3, 3, 6, 5
Use the data on the above to make a line plot. Be sure you write numbers on the axis,
label the axis, write a title, and use Xs to represent students.
How many students scored exactly 3? 3 students
How many students scored higher than 3? 11 students
How many students scored less than 3? 2 students
What score did the highest number of students receive? 6 points
Super Teacher Worksheets - www.superteacherworksheets.com