SlideShare a Scribd company logo
1 of 12
Download to read offline
CAPITAL ONE FINANCIAL CORPORATION (COF)
                                                            FINANCIAL & STATISTICAL SUMMARY
                                                                     REPORTED BASIS
                                                                       2008                   2008                  2008                    2008                       2007
                                                                       Q4                     Q3                    Q2                      Q1                         Q4
(in millions, except per share data and as noted)
Earnings (Reported Basis)
Net Interest Income                                                $    1,802.4           $    1,806.6          $    1,727.8            $    1,811.9               $    1,762.3
                                                                        1,368.3 (2)            1,696.9 (2)           1,622.3 (2),(10)        2,056.5 (2),(7),(8)        2,158.3 (6)
Non-Interest Income
Total Revenue (1)                                                       3,170.7                3,503.5               3,350.1                 3,868.4                    3,920.6
Provision for Loan Losses                                               2,098.9                1,093.9                 829.1                 1,079.1                    1,294.2
Marketing Expenses                                                        264.9                  267.4                 288.1                   297.8                      358.2
Restructuring Expenses                                                     52.8                   15.3                  13.6                    52.8                       27.8
                                                                          810.9 (12)
Goodwill Impairment Charge                                                                         -                     -                       -                          -
Operating Expenses (3)                                                                                                                       1,471.7 (4)                1,749.2 (4)
                                                                        1,629.3                1,527.5               1,517.9
Income (Loss) Before Taxes                                             (1,686.1)                 599.4                 701.4                   967.0                      491.2
Tax Rate                                                                   17.2 %                 35.6 %                34.1 %                  34.6 %                     34.5 %
Income (Loss) From Continuing Operations, Net of Tax               $   (1,396.3)          $      385.8          $      462.5            $      632.6               $      321.6
Loss From Discontinued Operations, Net of Tax (5)                                                                                              (84.1) (9)
                                                                          (25.2)                 (11.7)                 (9.6)                                             (95.0)
Net Income (Loss)                                                  $   (1,421.5)          $      374.1          $      452.9            $      548.5               $      226.6
Net Income (Loss) Available to Common Shareholders (F)             $   (1,454.3)          $      374.1          $      452.9            $      548.5               $      226.6

Common Share Statistics
Basic EPS: (G)
  Income (Loss) From Continuing Operations                         $        (3.67)        $         1.03        $         1.24          $         1.71             $       0.85
  Loss From Discontinued Operations                                $        (0.07)        $        (0.03)       $        (0.03)         $        (0.23)            $      (0.25)
  Net Income (Loss)                                                $        (3.74)        $         1.00        $         1.21          $         1.48             $       0.60
Diluted EPS: (G)
  Income (Loss) From Continuing Operations                         $      (3.67)          $       1.03          $       1.24            $       1.70               $       0.85
  Loss From Discontinued Operations                                $      (0.07)          $      (0.03)         $      (0.03)           $      (0.23)              $      (0.25)
  Net Income (Loss)                                                $      (3.74)          $       1.00          $       1.21            $       1.47               $       0.60
Dividends Per Common Share                                         $      0.375           $      0.375          $      0.375            $      0.375               $       0.03
Tangible Book Value Per Common Share (period end)                  $      28.24           $      31.63          $      30.77            $      29.94               $      29.00
Stock Price Per Common Share (period end)                          $      31.89           $      51.00          $      38.01            $      49.22               $      47.26
Total Market Capitalization (period end)                           $   12,411.6           $   19,833.9          $   14,280.4            $   18,442.7               $   17,623.3
Common Shares Outstanding (period end)                                    389.2                  388.9                 375.7                   374.7                      372.9
Shares Used to Compute Basic EPS                                          389.0                  372.9                 372.3                   370.7                      375.6
Shares Used to Compute Diluted EPS                                        389.0                  374.3                 373.7                   372.3                      378.4

Reported Balance Sheet Statistics (period average) (A)
Average Loans Held for Investment                                  $     99,335           $     98,778          $     97,950            $     99,819               $    97,785
Average Earning Assets                                             $    137,799           $    133,277          $    131,629            $    127,820               $   127,242
Average Assets                                                     $    161,976           $    156,958          $    154,288            $    149,460               $   150,926
Average Interest Bearing Deposits                                  $     93,144           $     84,655          $     78,675            $     74,167               $    72,074
Total Average Deposits                                             $    104,093           $     95,328          $     89,522            $     84,779               $    83,813
                                                                         26,658 (14)
Average Equity                                                     $                      $     25,046          $     24,839            $     24,569               $    24,733
Return on Average Assets (ROA)                                            (3.45) %                0.98 %                1.20 %                  1.69 %                    0.85 %
Return on Average Equity (ROE)                                           (20.95) %                6.16 %                7.45 %                 10.30 %                    5.20 %

Reported Balance Sheet Statistics (period end) (A)
Loans Held for Investment                                          $    101,018           $     97,965          $     97,065            $     98,356               $   101,805
Total Assets                                                       $    165,945           $    154,783          $    150,978            $    150,428               $   150,202
Interest Bearing Deposits                                          $     97,327           $     88,248          $     81,655            $     76,624               $    71,715
Total Deposits                                                     $    108,621           $     98,913          $     92,407            $     87,695               $    82,761

Performance Statistics (Reported) (A)
Net Interest Income Growth (annualized)                                         (1)   %             18      %            (19)     %               11      %                 34     %
Non Interest Income Growth (annualized)                                        (77)   %             18      %            (84)     %              (19)     %                  2     %
Revenue Growth (annualized)                                                    (38)   %             18      %            (54)     %               (5)     %                 16     %
Net Interest Margin                                                           5.23    %           5.42      %           5.25      %             5.67      %               5.54     %
Revenue Margin                                                                9.20    %          10.51      %          10.18      %            12.11      %              12.32     %
Risk Adjusted Margin (B)                                                      6.17    %           7.90      %           7.77      %             9.71      %              10.28     %
Non Interest Expense as a % of Average Loans Held for Investment
                                                                                  (13)
(annualized)                                                               7.84 %                 7.33 %                7.43 %                  7.30 %                    8.73 %
Efficiency Ratio (C)                                                              (13)
                                                                          59.74 %                51.23 %               53.91 %                 45.74 %                   53.75 %

Asset Quality Statistics (Reported) (A)
Allowance                                                          $      4,524           $      3,520          $      3,311            $      3,273               $     2,963
Allowance as a % of Reported Loans Held for Investment                     4.48 %                 3.59 %                3.41 %                  3.33 %                    2.91 %
Net Charge-Offs                                                    $      1,045           $        872          $        793            $        767               $       650
Net Charge-Off Rate                                                        4.21 %                 3.53 %                3.24 %                  3.07 %                    2.66 %
Delinquency Rate (30+ days)                                                4.37 %                 3.85 %                3.43 %                  3.26 %                    3.66 %

Full-time equivalent employees (in thousands)                                 23.7                   23.5                  24.0                    25.4                     27.0
CAPITAL ONE FINANCIAL CORPORATION (COF)
                                                     FINANCIAL & STATISTICAL SUMMARY
                                                             MANAGED BASIS (*)

                                                                        2008                   2008                  2008                    2008                      2007
                                                                         Q4                     Q3                    Q2                     Q1                        Q4
(in millions)
Earnings (Managed Basis)
Net Interest Income                                                 $    2,767.9           $    2,889.3          $    2,788.0            $   2,976.8               $   3,000.5
                                                                         1,183.2 (2)            1,325.6 (2)           1,302.0 (2),(10)       1,606.7 (2),(7),(8)       1,566.2 (6)
Non-Interest Income
Total Revenue (1)                                                        3,951.1                4,214.9               4,090.0                4,583.5                   4,566.7
Provision for Loan Losses                                                2,879.3                1,805.3               1,569.0                1,794.2                   1,940.3
Marketing Expenses                                                         264.9                  267.4                 288.1                  297.8                     358.2
Restructuring Expenses                                                      52.8                   15.3                  13.6                   52.8                      27.8
                                                                           810.9 (12)
Goodwill Impairment Charge                                                                          -                     -                      -                         -
Operating Expenses (3)                                                                                                                       1,471.7 (4)               1,749.2 (4)
                                                                         1,629.3                1,527.5               1,517.9
Income (Loss) Before Taxes                                              (1,686.1)                 599.4                 701.4                  967.0                     491.2
Tax Rate                                                                    17.2 %                 35.6 %                34.1 %                 34.6 %                    34.5 %
Income (Loss) From Continuing Operations, Net of Tax                $   (1,396.3)          $      385.8          $      462.5            $     632.6               $     321.6
Loss From Discontinued Operations, Net of Tax (5)                                                                                              (84.1) (9)
                                                                           (25.2)                 (11.7)                 (9.6)                                           (95.0)
Net Income (Loss)                                                   $   (1,421.5)          $      374.1          $      452.9            $     548.5               $     226.6
Net Income (Loss) Available to Common Shareholders (F)              $   (1,454.3)          $      374.1          $      452.9            $     548.5               $     226.6

Managed Balance Sheet Statistics (period average) (A)
Average Loans Held for Investment                                   $    146,586           $   147,247           $    147,716            $   149,719               $   148,362
Average Earning Assets                                              $    182,660           $   179,753           $    179,421            $   175,709               $   175,652
Average Assets                                                      $    207,240           $   204,694           $    203,308            $   198,516               $   200,658
Return on Average Assets (ROA)                                             (2.70) %               0.75 %                 0.91 %                 1.27 %                    0.64 %

Managed Balance Sheet Statistics (period end) (A)
Loans Held for Investment                                           $    146,937           $   147,346           $    147,247            $   148,037               $   151,362
Total Assets                                                        $    209,907           $   203,452           $    200,420            $   199,362               $   198,908
Tangible Assets(D)                                                  $    197,404           $   190,141           $    187,059            $   185,962               $   185,428
Tangible Common Equity (E)                                          $     10,990           $    12,301           $     11,560            $    11,220               $    10,814
                                                                                                         (11)
                                                                                                  6.47 %
Tangible Common Equity to Tangible Assets Ratio                             5.57 %                                       6.18 %                 6.03 %                    5.83 %
% Off-Balance Sheet Securitizations                                           31 %                  34 %                   34 %                   34 %                      33 %

Performance Statistics (Managed) (A)
Net Interest Income Growth (annualized)                                        (17)   %                15   %               (25)   %              (3)   %                   28   %
Non Interest Income Growth (annualized)                                        (43)   %                 7   %               (76)   %              10    %                   13   %
Revenue Growth (annualized)                                                    (25)   %                12   %               (43)   %               1    %                   23   %
Net Interest Margin                                                           6.06    %              6.43   %              6.22    %            6.78    %                 6.83   %
Revenue Margin                                                                8.65    %              9.38   %              9.12    %           10.43    %                10.40   %
Risk Adjusted Margin (B)                                                      4.65    %              5.86   %              5.70    %            7.06    %                 7.45   %
Non Interest Expense as a % of Average Loans Held for
                                                                                   (13)
Investment (annualized)                                                     5.31 %                 4.92 %                4.93 %                 4.87 %                    5.76 %
Efficiency Ratio (C)                                                               (13)
                                                                           47.94 %                42.58 %               44.16 %                38.61 %                   46.15 %

Asset Quality Statistics (Managed) (A)
Net Charge-Offs                                                     $      1,826           $      1,583          $      1,533            $     1,482               $     1,296
Net Charge-Off Rate                                                         4.98 %                 4.30 %                4.15 %                 3.96 %                    3.49 %
Delinquency Rate (30+ days)                                                 4.49 %                 3.99 %                3.64 %                 3.56 %                    3.87 %


(*) The information in this statistical summary reflects the adjustment to add back the effect of securitization transactions qualifying as sales
 under generally accepted accounting principles. See accompanying schedule - quot;Reconciliation to GAAP Financial Measuresquot;.
CAPITAL ONE FINANCIAL CORPORATION (COF)
                                              FINANCIAL & STATISTICAL SUMMARY NOTES
 (1) In accordance with the Company's finance charge and fee revenue recognition policy, the amounts billed to customers but not recognized as revenue
     were as follows: Q4 2008 - $591.0 million, Q3 2008 - $445.7 million, Q2 2008 - $476.0 million, Q1 2008 - $407.6 million, and Q4 2007 - $379.4 million.

 (2) Includes the impact from the decrease in fair value of the interest-only strips of $131.0 million in Q4 2008, $66.7 million in Q3 2008 and $71.0 million in Q2 2008.
      In Q1 2008 the Company recorded an increase of $42.8 million to its interest-only strips.

 (3) Includes core deposit intangible amortization expense of $46.0 million in Q4 2008, $47.3 million in Q3 2008, $48.5 million in Q2 2008, $49.8 million in Q1 2008,
     and $51.1 million in Q4 2007 and integration costs of $3.2 million in Q4 2008, $10.3million in Q3 2008, $27.4 million in Q2 2008, $28.9 million in Q1 2008,
     and $28.6 million in Q4 2007.

 (4) In Q4 2007, the Company recognized a pre-tax charge of approximately $140 million for liabilities in connection with the Visa antitrust lawsuit
     settlement with American Express and estimated possible damages in connection with other pending Visa litigation. In Q1 2008, the Company,
     in connection with the Visa initial public offering (IPO), reversed approximately $91 million of these legal liabilities.

 (5) In Q3 2007, the Company shutdown the mortgage origination operations of its wholesale mortgage banking unit, GreenPoint Mortgage, realizing an
     after tax loss of $898.0 million. The results of the mortgage origination operation of GreenPoint have been accounted for as a discontinued operation
     and have been removed from the Company's results of continuing operations for all periods presented. The results of GreenPoint's mortgage
     servicing business are reported in continuing operations for all periods presented. Effective Q4 2007, GreenPoint's held for investment commercial and
     consumer loan portfolio results are included in continuing operations.

 (6) During the fourth quarter 2007, the Company completed the sale of its interest in a relationship agreement to develop and market consumer credit products
     in the Spanish Market and recorded a gain related to this sale of approximately $30 million in non-interest income.

 (7) In Q1 2008 the Company recorded a gain of $109.0 million in non-interest income from the redemption of 2.5 million shares related to the Visa IPO.

 (8) In Q1 2008 the Company repurchased approximately $1.0 billion of certain senior unsecured debt, recognizing a gain of $52.0 million in non-interest income.
     The Company initiated the repurchases to take advantage of the current rate environment and replaced the borrowings with lower-rate unsecured funding.

 (9) In Q1 2008 the Company recorded a pre-tax expense of $104.2 million in discontinued operations to cover expected future claims made under representations
     and warranties provided by the Company on loans previously sold to third parties by GreenPoint's mortgage origination operation. See also note (5) above.

(10) In Q2 2008 the Company elected to convert and sell 154,991 shares of MasterCard class B common stock. The Company recognized gains of $44.9 million in
     non-interest income from this transaction.

(11) The Q3 2008 TCE ratio reflects the issuance of 15,527,000 shares on September 30, 2008 at $49 per share.

(12) In Q4 2008 the Company recorded impairment of goodwill in its Auto Finance sub-segment of $810.9 million.

(13) Excludes the impact of the goodwill impairment of $810.9 million.

(14) Average equity includes the impact of the Company's participation in the U.S. Treasury's Capital Purchase Program. The Company issued 3,555,199 preferred
     shares and 12,657,960 warrants to purchase common shares, while receiving proceeds of $3.56 billion. The allocated fair value for the preferred shares and
     the warrants to purchase common shares was $3.06 billion and $491.5 million, respectively. The warrants to purchase common shares are included in
     paid-in capital on the balance sheet.

    STATISTICS / METRIC DEFINITIONS

(A) Based on continuing operations. Average equity and return on equity are based on the Company's stockholders' equity.

(B) Risk adjusted margin equals total revenue less net charge-offs as a percentage of average earning assets.

(C) Efficiency ratio equals non-interest expense less restructuring expense divided by total revenue.

(D) Tangible assets include managed assets less intangible assets.

(E) Includes stockholders' equity less preferred shares less intangible assets and related deferred tax liabilities. Tangible Common Equity on
    a reported and managed basis is the same.

(F) Net income (loss) available to common shareholders equals net income (loss) less dividends on preferred shares.

(G) Earnings per share is based on net income (loss) available to common shareholders.
CAPITAL ONE FINANCIAL CORPORATION (COF)
                                     SEGMENT FINANCIAL & STATISTICAL SUMMARY FOR CONTINUING OPERATIONS
                                                              MANAGED BASIS (1)
                                                                          2008                       2008                2008                2008                2007
                                                                                                                                                                 Q4 (6)
                                                                           Q4                         Q3                  Q2                  Q1
(in thousands)

Local Banking:
 Interest Income                                                     $     1,512,139            $     1,519,217     $     1,489,612     $     1,575,325     $     1,707,377
 Interest Expense                                                            869,723                    895,481             899,907           1,008,371           1,122,841
 Net interest income                                                 $       642,416            $       623,736     $       589,705     $       566,954     $       584,536
 Non-interest income                                                         189,814                    215,701             192,758             215,469             206,002
 Provision for loan losses                                                   214,154                     81,052              92,043              60,394              42,665
 Other non-interest expenses                                                 628,110                    622,697             587,211             605,351             589,943
 Income tax provision                                                         (3,512)                    47,491              36,123              40,837              54,328
 Net income (loss)                                                   $        (6,522)           $        88,197     $        67,086     $        75,841     $       103,602
 Loans Held for Investment                                           $    45,082,981            $    44,662,818     $    44,270,734     $    44,197,085     $    43,972,795
 Average Loans Held for Investment                                   $    44,810,117            $    44,319,475     $    44,250,451     $    43,887,387     $    43,128,767
 Core Deposits(2)                                                    $    67,546,102            $    64,386,336     $    63,407,571     $    62,811,696     $    62,977,637
 Total Deposits                                                      $    78,938,391            $    75,045,812     $    74,245,677     $    73,387,227     $    73,089,284
 Loans Held for Investment Yield                                              6.08%                      6.25%               6.35%               6.75%                7.02%
 Net Interest Margin - Loans (3)                                              2.11%                      1.98%               1.99%               1.92%                1.87%
 Net Interest Margin - Deposits (4)                                           2.12%                      2.18%               2.04%               1.93%                2.05%
 Efficiency Ratio (5)                                                        75.47%                     74.18%              75.05%              77.37%               74.63%
 Net charge-off rate                                                          0.90%                      0.46%               0.34%               0.31%                0.29%
 Non Performing Loans                                                $      565,791             $      430,211      $      359,017      $      249,055      $       178,385
 Foreclosed Assets                                                           63,970                     41,290              29,607              24,790               14,058
 Non Performing Assets (9)                                           $      629,761             $      471,501      $      388,624      $      273,845      $       192,443
 Non Performing Loans as a % of Loans Held for Investment                     1.25%                      0.96%               0.81%               0.56%                0.41%
 Non Performing Asset Rate (9)                                                1.40%                      1.06%               0.88%               0.62%                0.44%
 Non-Interest Expenses as a % of Average Loans Held for Investment            5.61%                      5.62%               5.31%               5.52%                5.47%
 Number of Active ATMs                                                           1,311                      1,310               1,303               1,297                 1,288
 Number of Locations                                                               738                        739                 740                 745                   742


National Lending (8) :
 Interest Income                                                     $     3,104,769            $     3,251,446     $     3,181,773     $     3,530,017     $     3,670,404
 Interest Expense                                                            921,542                  1,019,911           1,014,244           1,121,434           1,231,978
 Net interest income                                                 $     2,183,227            $     2,231,535     $     2,167,529     $     2,408,583     $     2,438,426
 Non-interest income                                                       1,151,066                  1,195,622           1,164,810           1,226,114           1,370,655
 Provision for loan losses                                                 2,602,101                  1,678,513           1,470,642           1,677,220           1,777,327
                                                                                         (10)
 Goodwill impairment charge                                                  810,876                        -                   -                   -                   -
 Other non-interest expenses                                               1,201,764                  1,176,396           1,236,567           1,279,171           1,361,709
 Income tax provision                                                       (169,060)                   200,626             217,496             236,203             229,084
 Net income (loss)                                                   $    (1,111,388)           $       371,622     $       407,634     $       442,103     $       440,961
 Loans Held for Investment                                           $   101,147,134            $   101,922,850     $   102,201,802     $   103,003,402     $   106,508,443
 Average Loans Held for Investment                                   $   101,038,849            $   102,142,752     $   102,629,246     $   104,973,633     $   104,321,485
 Core Deposits(2)                                                    $         2,219            $         2,171     $         1,954     $         2,171     $         1,599
 Total Deposits                                                      $     1,459,131            $     1,650,507     $     1,644,241     $     1,774,690     $     2,050,861
 Loans Held for Investment Yield                                             12.29%                     12.73%              12.40%              13.45%                14.07%
 Net Interest Margin                                                          8.64%                      8.74%               8.45%               9.18%                 9.35%
 Revenue Margin                                                              13.20%                     13.42%              12.99%              13.85%                14.61%
 Risk Adjusted Margin                                                         6.54%                      7.57%               7.31%               8.51%                 9.88%
                                                                                         (11)
 Non-Interest Expenses as a % of Average Loans Held for Investment            4.76%                      4.61%               4.82%               4.87%                 5.22%
 Efficiency Ratio (5)                                                                    (11)
                                                                             36.04%                     34.33%              37.11%              35.19%                35.75%
 Net charge-off rate                                                          6.66%                      5.85%               5.67%               5.34%                 4.73%
 Delinquency Rate (30+ days)                                                  5.93%                      5.43%               4.87%               4.73%                 5.17%
 Number of Loan Accounts (000s)                                              44,816                     45,314              45,812              48,065                48,537


Other:
 Net interest income                                                 $       (57,763)           $        34,059     $        30,761     $         1,313     $       (22,449)
 Non-interest income                                                        (157,700)                   (85,764)            (55,594)            165,102             (10,425)
 Provision for loan losses                                                    63,043                     45,705               6,342              56,598             120,376
 Restructuring expenses                                                       52,839                     15,306              13,560              52,759              27,809
 Other non-interest expenses                                                  64,354                     (4,193)            (17,737)           (115,004)            155,746
 Income tax provision (benefit)                                             (117,284)                   (34,493)            (14,776)             57,451            (113,854)
 Net income (loss)                                                   $      (278,415)           $       (74,030)    $       (12,222)    $       114,611     $      (222,951)

 Loans Held for Investment                                           $       706,639            $       760,078     $       774,724     $       836,041     $       881,179
 Core Deposits(2)                                                    $    27,067,784            $    20,800,890     $    14,800,701     $    10,729,004     $     6,107,779
 Total Deposits                                                      $    28,223,267            $    22,216,655     $    16,517,143     $    12,533,025     $     7,621,031


Total:
 Interest Income                                                     $     4,205,821            $     4,346,261     $     4,270,572     $     4,628,257     $     4,863,246
 Interest Expense                                                          1,437,941                  1,456,931           1,482,577           1,651,407           1,862,733
 Net interest income                                                 $     2,767,880            $     2,889,330     $     2,787,995     $     2,976,850     $     3,000,513
 Non-interest income                                                       1,183,180                  1,325,559           1,301,974           1,606,685           1,566,232
 Provision for loan losses                                                 2,879,298                  1,805,270           1,569,027           1,794,212           1,940,368
 Restructuring expenses                                                       52,839                     15,306              13,560              52,759              27,809
 Goodwill impairment charge                                                  810,876                        -                   -                   -                   -
 Other non-interest expenses                                               1,894,228                  1,794,900           1,806,041           1,769,518           2,107,398
 Income tax provision                                                       (289,856)                   213,624             238,843             334,491             169,558
 Net income (loss)                                                   $    (1,396,325)           $       385,789     $       462,498     $       632,555     $       321,612

 Loans Held for Investment                                           $   146,936,754            $   147,345,746     $   147,247,260     $   148,036,528     $   151,362,417
 Core Deposits(2)                                                    $    94,616,105            $    85,189,397     $    78,210,226     $    73,542,871     $    69,087,015
 Total Deposits                                                      $   108,620,789            $    98,912,974     $    92,407,061     $    87,694,942     $    82,761,176
CAPITAL ONE FINANCIAL CORPORATION (COF)
                                    LOCAL BANKING SEGMENT FINANCIAL & STATISTICAL INFORMATION


                                                    2008               2008               2008                 2008               2007
                                                     Q4                 Q3                 Q2                   Q1                 Q4
(in thousands)

Loans Held for Investment:
  Commercial Lending
    Commercial and Multi-Family Real Estate     $   13,382,909     $   13,043,369     $   12,948,037       $   12,655,900     $   12,414,263
    Middle Market                                   10,081,823          9,768,420          8,923,233            8,695,171          8,288,476
    Small Ticket Commercial Real Estate              2,609,123          2,695,570          2,746,931            2,840,594          2,948,402
    Specialty Lending                                3,547,287          3,634,212          3,693,532            3,546,200          3,396,100
       Total Commercial Lending                 $   29,621,142     $   29,141,571     $   28,311,733       $   27,737,865     $   27,047,241

  Small Business Lending                        $    4,747,783     $    4,580,299     $    4,555,432       $    4,588,500     $    4,612,500

  Consumer Lending
    Mortgages                                   $    7,187,805     $    7,402,290     $    7,803,032       $    8,214,624     $    8,513,216
    Branch Based Home Equity & Other Consumer        3,773,397          3,782,342          3,887,936            3,938,849          4,095,228
       Total Consumer Lending                   $   10,961,202     $   11,184,632     $   11,690,968       $   12,153,473     $   12,608,444

     Other                                      $     (247,146)    $     (243,684)    $     (287,399)      $     (282,753)    $     (295,390)

  Total Loans Held for Investment               $   45,082,981     $   44,662,818     $   44,270,734       $   44,197,085     $   43,972,795


Non Performing Asset Rates (9):

  Commercial Lending
    Commercial and Multi-Family Real Estate                1.20%              1.06%               0.87%               0.46%              0.24%
    Middle Market                                          0.43%              0.26%               0.31%               0.42%              0.41%
    Small Ticket Commercial Real Estate                    6.67%              4.49%               2.74%               1.62%              0.54%
    Specialty Lending                                      1.05%              0.38%               0.25%               0.18%              0.18%
       Total Commercial Lending                            1.40%              1.03%               0.79%               0.53%              0.32%

  Small Business Lending                                   1.79%              1.14%               1.17%               1.00%              1.06%

  Consumer Lending
    Mortgages                                              1.55%              1.41%               1.22%               0.81%              0.54%
    Branch Based Home Equity & Other Consumer              0.46%              0.40%               0.39%               0.35%              0.30%
       Total Consumer Lending                              1.18%              1.07%               0.95%               0.66%              0.46%

  Total Non Performing Asset Rate                          1.40%              1.06%               0.88%               0.62%              0.44%

Net Charge Off Rates:

  Commercial Lending
    Commercial and Multi-Family Real Estate                1.15%              0.14%                0.10%              0.02%              0.02%
    Middle Market                                          0.48%              0.15%                0.05%              0.15%              0.12%
    Small Ticket Commercial Real Estate                    0.90%              0.10%              (0.03)%              0.30%              0.21%
    Specialty Lending                                      0.47%              0.26%                0.16%              0.05%              0.15%
       Total Commercial Lending                            0.82%              0.16%                0.08%              0.09%              0.09%

  Small Business Lending                                   1.12%              1.17%               0.91%               0.97%              0.63%

  Consumer Lending
    Mortgages                                              0.48%              0.50%               0.35%               0.11%              0.19%
    Branch Based Home Equity & Other Consumer              1.34%              1.01%               1.02%               1.21%              1.04%
       Total Consumer Lending                              0.78%              0.67%               0.57%               0.46%              0.46%

  Total Net Charge Off Rate                                0.90%              0.46%               0.34%               0.31%              0.29%
CAPITAL ONE FINANCIAL CORPORATION (COF)
                 NATIONAL LENDING SUB-SEGMENT FINANCIAL & STATISTICAL SUMMARY FOR CONTINUING OPERATIONS
                                                   MANAGED BASIS (1), (8)
                                                                         2008                     2008             2008             2008             2007
                                                                                                                                                     Q4 (6)
                                                                          Q4                       Q3               Q2               Q1
(in thousands)

US Card:
 Interest Income                                                     $    2,179,456           $    2,240,896   $    2,132,284   $    2,433,665   $    2,548,929
 Interest Expense                                                           570,751                  624,858          608,655          689,951          780,985
 Net interest income                                                 $    1,608,705           $    1,616,038   $    1,523,629   $    1,743,714   $    1,767,944
 Non-interest income                                                      1,018,689                1,027,918        1,010,177        1,070,831        1,163,795
 Provision for loan losses                                                2,000,928                1,240,580        1,099,453        1,120,025        1,195,469
 Non-interest expenses                                                      896,572                  872,588          910,619          938,860          976,118
 Income tax provision                                                       (94,537)                 185,775          183,307          264,481          261,492
 Net income (loss)                                                   $     (175,569)          $      345,013   $      340,427   $      491,179   $      498,660
 Loans Held for Investment                                           $   70,944,581           $   69,361,743   $   68,059,998   $   67,382,004   $   69,723,169
 Average Loans Held for Investment                                   $   69,643,290           $   68,581,983   $   67,762,384   $   68,544,190   $   67,727,632
 Loans Held for Investment Yield                                            12.52%                   13.07%           12.59%           14.20%             15.05%
 Net Interest Margin                                                         9.24%                    9.43%            8.99%           10.18%             10.44%
 Revenue Margin                                                             15.09%                   15.42%           14.96%           16.42%             17.31%
 Risk Adjusted Margin                                                        8.01%                    9.29%            8.70%           10.58%             12.47%
 Non-Interest Expenses as a % of Average Loans Held for Investment           5.15%                    5.09%            5.38%            5.48%              5.76%
                  (5)
 Efficiency Ratio                                                           34.12%                   33.00%           35.94%           33.36%             33.29%
 Net charge-off rate                                                         7.08%                    6.13%            6.26%            5.85%              4.84%
 Delinquency Rate (30+ days)                                                 4.78%                    4.20%            3.85%            4.04%              4.28%
                   (7)
 Purchase Volume                                                     $   25,217,781           $   26,536,070   $   26,738,213   $   24,543,082   $   28,230,725
 Number of Loan Accounts (000s)                                              37,436                   37,916           38,415           40,611           41,044
Auto Finance:
 Interest Income                                                     $      622,244           $     635,305    $     666,499    $     690,919    $      687,389
 Interest Expense                                                           255,501                 265,804          276,911          289,357           300,133
 Net interest income                                                 $      366,743           $     369,501    $     389,588    $     401,562    $      387,256
 Non-interest income                                                         12,846                  14,607           15,672           16,110            14,888
 Provision for loan losses                                                  437,572                 244,078          230,614          408,251           429,247
                                                                                       (10)
 Goodwill impairment charge                                                 810,876                     -                -                -                 -
 Non-interest expenses                                                      127,075                 117,677          123,021          136,169           144,301
 Income tax (benefit) provision                                             (71,290)                  7,824           18,069          (44,362)          (58,963)
 Net income (loss)                                                   $     (924,644)          $      14,529    $      33,556    $     (82,386)   $     (112,441)
 Loans Held for Investment                                           $   21,481,911           $   22,306,394   $   23,401,160   $   24,633,665   $   25,128,352
 Average Loans Held for Investment                                   $   21,954,587           $   22,857,540   $   24,098,881   $   25,047,501   $   24,920,380
 Loans Held for Investment Yield                                            11.34%                   11.12%           11.06%           11.03%             11.03%
 Net Interest Margin                                                         6.68%                    6.47%            6.47%            6.41%              6.22%
 Revenue Margin                                                              6.92%                    6.72%            6.73%            6.67%              6.45%
 Risk Adjusted Margin                                                        1.24%                    1.73%            2.88%            2.69%              2.46%
                                                                                       (11)
 Non-Interest Expenses as a % of Average Loans Held for Investment           2.32%                    2.06%            2.04%            2.17%              2.32%
                  (5)                                                                  (11)
 Efficiency Ratio                                                           33.48%                   30.64%           30.36%           32.60%             35.88%
 Net charge-off rate                                                         5.67%                    5.00%            3.84%            3.98%              4.00%
 Delinquency Rate (30+ days)                                                 9.91%                    9.32%            7.62%            6.42%              7.84%
 Auto Loan Originations                                              $    1,476,136           $    1,444,291   $    1,513,686   $    2,440,227   $    3,623,491
 Number of Loan Accounts (000s)                                               1,634                    1,665            1,710            1,763            1,771
International:
 Interest Income                                                     $     303,069            $     375,245    $     382,990    $     405,433    $      434,086
 Interest Expense                                                           95,290                  129,249          128,678          142,126           150,860
 Net interest income                                                 $     207,779            $     245,996    $     254,312    $     263,307    $      283,226
 Non-interest income                                                       119,531                  153,097          138,961          139,173           191,972
 Provision for loan losses                                                 163,601                  193,855          140,575          148,944           152,611
 Non-interest expenses                                                     178,117                  186,131          202,927          204,142           241,290
 Income tax provision                                                       (3,233)                   7,027           16,120           16,084            26,555
 Net income (loss)                                                   $     (11,175)           $      12,080    $      33,651    $      33,310    $       54,742
 Loans Held for Investment                                           $    8,720,642           $   10,254,713   $   10,740,644   $   10,987,733   $   11,656,922
 Average Loans Held for Investment                                   $    9,440,972           $   10,703,229   $   10,767,981   $   11,381,942   $   11,673,473
 Loans Held for Investment Yield                                            12.84%                   14.02%           14.23%           14.25%             14.87%
 Net Interest Margin                                                         8.80%                    9.19%            9.45%            9.25%              9.70%
 Revenue Margin                                                             13.87%                   14.91%           14.61%           14.14%             16.28%
 Risk Adjusted Margin                                                        8.02%                    9.01%            8.54%            8.84%             10.67%
 Non-Interest Expenses as a % of Average Loans Held for Investment           7.55%                    6.96%            7.54%            7.17%              8.27%
                  (5)
 Efficiency Ratio                                                           54.42%                   46.64%           51.60%           50.72%             50.78%
 Net charge-off rate                                                         5.84%                    5.90%            6.07%            5.30%              5.61%
 Delinquency Rate (30+ days)                                                 5.51%                    5.24%            5.35%            5.12%              4.79%
                   (7)
 Purchase Volume                                                     $    2,346,969           $    2,857,975   $    2,879,223   $    2,716,060   $    2,966,350
 Number of Loan Accounts (000s)                                               5,747                    5,733            5,687            5,691            5,722
CAPITAL ONE FINANCIAL CORPORATION (COF)
                                   SEGMENT AND NATIONAL LENDING SUB-SEGMENT
                        FINANCIAL & STATISTICAL SUMMARY FOR CONTINUING OPERATIONS NOTES
 (1) The information in this financial and statistical summary reflects the adjustment to add back the effect of securitization transactions qualifying as sales
     under generally accepted accounting principles. See accompanying schedule - quot;Reconciliation to GAAP Financial Measures.quot; In Q3 2007, the
     Company shutdown the mortgage origination operations of its wholesale mortgage banking unit, GreenPoint Mortgage. The results of the mortgage
     origination operation of GreenPoint have been accounted for as a discontinued operation and have been removed from the Company's results of
     continuing operations for all periods presented. The results of GreenPoint's mortgage servicing business are reported in continuing operations
     for all periods presented. Effective Q4 2007, GreenPoint's held for investment commercial and consumer loan portfolio results are included in
     continuing operations.

 (2) Includes domestic non-interest bearing deposits, NOW accounts, money market deposit accounts, savings accounts, certificates of deposit of
     less than $100,000 and other consumer time deposits.

 (3) Net Interest Margin - Loans equals net interest income earned on loans divided by average managed loans.

 (4) Net Interest Margin - Deposits equals net interest income earned on deposits divided by average deposits.

 (5) Efficiency Ratio equals non-interest expenses divided by total managed revenue.

 (6) Certain prior period amounts have been reclassified to conform with current period presentation.

 (7) Includes all purchase transactions net of returns and excludes cash advance transactions.

 (8) In Q1 2008 the Company reorganized its National Lending sub-segments from U.S. Card, Auto Finance and Global Financial Services to U.S. Card
     and Other National Lending. The U.S. Card sub-segment contains the results of the Company's domestic credit card business, small business
     lending and the installment loan business. The Other National Lending subsegment contains the results of the Company's auto finance business
     and the Company's international lending businesses. Components of the Other National Lending sub-segment are separately disclosed.
     Segment and sub-segment results have been restated for all periods presented.

 (9) Non performing assets is comprised of non performing loans and foreclosed assets. The non performing asset rate equals
     non performing assets divided by the sum of loans held for investment plus foreclosed assets.

(10) In Q4 2008 the Company recorded impairment of goodwill in its Auto Finance sub-segment of $810.9 million.

(11) Excludes the impact of the goodwill impairment of $810.9 million recorded in the Auto Finance component of National Lending.
CAPITAL ONE FINANCIAL CORPORATION
Reconciliation to GAAP Financial Measures
For the Three Months Ended December 31, 2008
(dollars in thousands)(unaudited)

The Company's consolidated financial statements prepared in accordance with generally accepted accounting principles
(quot;GAAPquot;) are referred to as its quot;reportedquot; financial statements. Loans included in securitization transactions which
qualified as sales under GAAP have been removed from the Company's quot;reportedquot; balance sheet. However, servicing
fees, finance charges, and other fees, net of charge-offs, and interest paid to investors of securitizations are recognized
as servicing and securitizations income on the quot;reportedquot; income statement.

The Company's quot;managedquot; consolidated financial statements reflect adjustments made related to effects of
securitization transactions qualifying as sales under GAAP. The Company generates earnings from its quot;managedquot; loan
portfolio which includes both the on-balance sheet loans and off-balance sheet loans. The Company's quot;managedquot;
income statement takes the components of the servicing and securitizations income generated from the securitized
portfolio and distributes the revenue and expense to appropriate income statement line items from which it originated.
For this reason the Company believes the quot;managedquot; consolidated financial statements and related managed metrics to
be useful to stakeholders.

                                                                          Adjustments(1)              Total Managed(2)
                                             Total Reported
                                 (3)
Income Statement Measures
Net interest income                     $             1,802,397      $               965,483      $             2,767,880
Non-interest income                                   1,368,286                     (185,106)                   1,183,180
Total revenue                                         3,170,683                      780,377                    3,951,060
Provision for loan and lease losses                   2,098,921                      780,377                    2,879,298
Net charge-offs                         $             1,045,912      $               780,377      $             1,826,289
Balance Sheet Measures
Loans held for investment               $           101,017,771      $            45,918,983      $          146,936,754
Total assets                            $           165,980,505      $            43,961,156      $          209,941,661
Average loans held for investment       $            99,334,890      $            47,251,262      $          146,586,152
Average earning assets                  $           137,818,202      $            44,861,288      $          182,679,490
Average total assets                    $           162,035,538      $            45,264,163      $          207,299,701
Delinquencies                           $             4,417,823      $             2,178,400      $            6,596,223

(1)
  Income statement adjustments reclassify the net of finance charges of $1,285.1 million, past-due fees of $200.1
million, other interest income of $(48.2) million and interest expense of $471.5 million; and net charge-offs of $780.4
million from non-interest income to net interest income and provision for loan and lease losses, respectively.

(2)
  The managed loan portfolio does not include auto loans which have been sold in whole loan sale transactions where
the Company has retained servicing rights.

(3)
      Based on continuing operations.
CAPITAL ONE FINANCIAL CORPORATION
Consolidated Balance Sheets
(in thousands)(unaudited)

                                                                    As of             As of             As of
                                                                   Dec 31            Sept 30           Dec 31
                                                                    2008              2008              2007

Assets:
Cash and due from banks                                       $   2,047,839     $   3,511,558     $   2,377,287
Federal funds sold and resale agreements                            636,752         1,435,521         1,766,762
Interest-bearing deposits at other banks                          4,806,752           673,662           677,360
   Cash and cash equivalents                                      7,491,343         5,620,741         4,821,409
Securities available for sale                                    31,003,271        26,969,471        19,781,587
Mortgage loans held for sale                                         68,462            98,900           315,863
Loans held for investment                                       101,017,771        97,965,351       101,805,027
   Less: Allowance for loan and lease losses                     (4,523,960)       (3,519,610)       (2,963,000)
Net loans held for investment                                    96,493,811        94,445,741        98,842,027
Accounts receivable from securitizations                          6,342,754         4,980,823         4,717,879
Premises and equipment, net                                       2,313,106         2,305,286         2,299,603
Interest receivable                                                 827,909           750,717           839,317
Goodwill                                                         12,022,577        12,815,642        12,830,740
Other                                                             9,417,272         6,815,792         6,141,944
   Total assets                                               $ 165,980,505     $ 154,803,113     $ 150,590,369


Liabilities:
Non-interest-bearing deposits                                 $    11,293,852   $    10,665,286   $    11,046,549
Interest-bearing deposits                                          97,326,937        88,247,688        71,714,627
Senior and subordinated notes                                       8,308,843         8,278,856        10,712,706
Other borrowings                                                   14,869,648        15,962,072        26,812,969
Interest payable                                                      676,398           508,091           631,609
Other                                                               6,892,394         5,529,580         5,377,797
   Total liabilities                                              139,368,072       129,191,573       126,296,257

Stockholders' Equity:
Preferred stock                                                   3,096,466               -                 -
Common stock                                                          4,384             4,383             4,192
Paid-in capital, net                                             17,278,102        16,752,078        15,860,490
Retained earnings and cumulative other comprehensive income       9,399,368        12,020,490        11,582,816
  Less: Treasury stock, at cost                                  (3,165,887)       (3,165,411)       (3,153,386)
  Total stockholders' equity                                     26,612,433        25,611,540        24,294,112
  Total liabilities and stockholders' equity                  $ 165,980,505     $ 154,803,113     $ 150,590,369
CAPITAL ONE FINANCIAL CORPORATION
Consolidated Statements of Income
(in thousands, except per share data)(unaudited)


                                                                                   Three Months Ended                               Year Ended
                                                                       Dec 31            Sept 30        Dec 31             Dec 31                 Dec 31
                                                                                                         2007
                                                                        2008              2008                              2008                   2007


Interest Income:
Loans held for investment, including past-due fees                 $   2,306,796 $       2,347,480 $    2,536,779     $    9,460,378      $       9,500,128
Securities available for sale                                            367,902           317,274        256,364          1,224,012                950,972
Other                                                                     94,123           107,042        167,051            427,609                627,056
    Total interest income                                              2,768,821         2,771,796      2,960,194         11,111,999             11,078,156

Interest Expense:
Deposits                                                                 684,756           624,319        686,174          2,512,040              2,906,351
Senior and subordinated notes                                             92,519            96,568        159,878            444,854                577,128
Other borrowings                                                         189,149           244,264        351,895          1,006,390              1,064,832
    Total interest expense                                               966,424           965,151      1,197,947          3,963,284              4,548,311
Net interest income                                                    1,802,397         1,806,645      1,762,247          7,148,715              6,529,845
Provision for loan and lease losses                                    2,098,921         1,093,917      1,294,210          5,101,040              2,636,502
Net interest income (loss) after provision for loan and lease losses    (296,524)          712,728        468,037          2,047,675              3,893,343

Non-Interest Income:
Servicing and securitizations                                            590,948           875,718      1,271,396          3,384,468              4,840,677
Service charges and other customer-related fees                          557,331           576,762        573,034          2,232,363              2,057,854
Mortgage servicing and other                                              14,048            39,183         (5,700)           105,038                166,776
Interchange                                                              129,409           148,076        152,595            562,117                500,484
Other                                                                     76,550            57,152        167,015            459,985                488,432
    Total non-interest income                                          1,368,286         1,696,891      2,158,340          6,743,971              8,054,223

Non-Interest Expense:
Salaries and associate benefits                                           574,199          571,686        622,101          2,335,737              2,592,534
Marketing                                                                 264,943          267,372        358,182          1,118,208              1,347,836
Communications and data processing                                        196,924          176,720        189,415            755,989                758,820
Supplies and equipment                                                    130,038          126,781        146,267            519,687                531,238
Occupancy                                                                 112,492           96,483         91,675            377,192                322,510
Restructuring expense                                                      52,839           15,306         27,809            134,464                138,237
Goodwill impairment charge                                                810,876              -              -              810,876                    -
Other                                                                     615,632          555,858        699,758          2,157,874              2,386,835
    Total non-interest expense                                          2,757,943        1,810,206      2,135,207          8,210,027              8,078,010
Income (loss) from continuing operations before Income taxes           (1,686,181)         599,413        491,170            581,619              3,869,556
Income taxes                                                             (289,856)         213,624        169,558            497,102              1,277,837
Income (loss) from continuing operations, net of tax                   (1,396,325)         385,789        321,612             84,517              2,591,719
Loss from discontinued operations, net of tax (1)                         (25,221)         (11,650)       (95,044)          (130,515)            (1,021,387)
Net income (loss)                                                  $   (1,421,546) $       374,139 $      226,568     $      (45,998)     $       1,570,332
Net income (loss) available to common shareholders                 $   (1,454,269) $       374,139 $      226,568     $      (78,721)     $       1,570,332


Basic earnings per common share
Income (loss) from continuing operations                           $        (3.67) $          1.03 $         0.85     $          0.14      $            6.64
Loss from discontinued operations                                           (0.07)           (0.03)         (0.25)              (0.35)                (2.62)
Net Income (loss) per common share                                 $        (3.74) $          1.00 $         0.60     $         (0.21)     $            4.02

Diluted earnings per common share
Income (loss) from continuing operations                           $        (3.67) $          1.03 $         0.85     $          0.14     $             6.55
Loss from discontinued operations                                           (0.07)           (0.03)         (0.25)              (0.35)                (2.58)
Net Income (loss) per common share                                 $        (3.74) $          1.00 $         0.60     $         (0.21)    $             3.97

Dividends paid per common share                                    $        0.375 $          0.375 $         0.03     $          1.50      $           0.11


(1) In Q3 2007, the Company shutdown the mortgage origination operations of its wholesale mortgage banking unit, GreenPoint Mortgage.
    The results of the mortgage origination operation of GreenPoint have been accounted for as a discontinued operation and have been
    removed from the Company's results of continuing operations for all periods presented.
CAPITAL ONE FINANCIAL CORPORATION
Statements of Average Balances, Income and Expense, Yields and Rates (1)
(dollars in thousands)(unaudited)

                                                                                                                                                 Quarter Ended 12/31/07
Reported                                                Quarter Ended 12/31/08                         Quarter Ended 9/30/08
                                                     Average       Income/     Yield/             Average         Income/       Yield/       Average        Income/     Yield/
                                                     Balance       Expense     Rate               Balance        Expense        Rate         Balance       Expense      Rate
Earning assets:

 Loans held for investment                       $  99,334,890   $ 2,306,796    9.29%       $      98,778,393   $   2,347,480   9.51%    $  97,784,813    $ 2,536,779   10.38%
 Securities available for sale                      28,961,247       367,902    5.08%              25,780,669         317,274   4.92%       20,102,440        256,364    5.10%
 Other                                               9,502,781        94,123    3.96%               8,717,921         107,042   4.91%        9,355,161        167,051    7.14%
Total earning assets                             $ 137,798,918   $ 2,768,821    8.04%       $     133,276,983   $   2,771,796   8.32%    $ 127,242,414    $ 2,960,194    9.31%

Interest-bearing liabilities:
 Interest-bearing deposits
    NOW accounts                                 $   9,874,696   $    28,460    1.15%       $       9,292,819   $     30,263    1.30%    $   4,674,490    $    30,443    2.61%
    Money market deposit accounts                   28,556,264       171,891    2.41%              26,914,607        187,740    2.79%       28,745,701        270,943    3.77%
    Savings accounts                                 7,275,816        11,774    0.65%               7,759,024         16,243    0.84%        8,172,510         32,520    1.59%
    Other consumer time deposits                    33,712,504       337,651    4.01%              26,733,531        262,101    3.92%       16,374,958        183,570    4.48%
    Public fund CD's of $100,000 or more             1,213,364         7,323    2.41%               1,305,438          8,233    2.52%        1,902,442         23,126    4.86%
    CD's of $100,000 or more                         9,508,463       104,134    4.38%               9,084,740         89,192    3.93%        8,335,941         97,335    4.67%
    Foreign time deposits                            3,002,402        23,523    3.13%               3,564,449         30,547    3.43%        3,868,444         48,237    4.99%
 Total interest-bearing deposits                 $ 93,143,509    $   684,756    2.94%       $      84,654,608   $    624,319    2.95%    $ 72,074,486     $ 686,174      3.81%
 Senior and subordinated notes                       8,034,423        92,519    4.61%               8,282,536         96,568    4.66%       10,682,635        159,878    5.99%
 Other borrowings                                   16,428,096       189,149    4.61%              22,368,976        244,264    4.37%       26,671,101        351,895    5.28%
Total interest-bearing liabilities               $ 117,606,028   $   966,424    3.29%       $     115,306,120   $    965,151    3.35%    $ 109,428,222    $ 1,197,947    4.38%

Net interest spread                                                             4.75%                                           4.97%                                    4.93%

Interest income to average earning assets                                       8.04%                                           8.32%                                    9.31%
Interest expense to average earning assets                                      2.81%                                           2.90%                                    3.77%
Net interest margin                                                             5.23%                                           5.42%                                    5.54%

(1) Average balances, income and expenses, yields and rates are based on continuing operations.
CAPITAL ONE FINANCIAL CORPORATION
Statements of Average Balances, Income and Expense, Yields and Rates (2)
(dollars in thousands)(unaudited)

          (1)
Managed                                                 Quarter Ended 12/31/08                          Quarter Ended 9/30/08                   Quarter Ended 12/31/07
                                                    Average       Income/      Yield/              Average       Income/      Yield/        Average       Income/      Yield/
                                                    Balance       Expense      Rate                Balance       Expense      Rate          Balance       Expense      Rate
Earning assets:

 Loans held for investment                      $ 146,586,152    $ 3,808,363       10.39%      $ 147,247,398   $ 3,974,375    10.80%    $ 148,362,338   $ 4,512,219    12.17%
 Securities available for sale                     28,961,247        367,902        5.08%         25,780,669       317,274     4.92%       20,102,440       256,364     5.10%
 Other                                              7,112,807         29,558        1.66%          6,724,730        54,612     3.25%        7,186,892        94,663     5.27%
Total earning assets                            $ 182,660,206    $ 4,205,823        9.21%      $ 179,752,797   $ 4,346,261     9.67%    $ 175,651,670   $ 4,863,246    11.07%

Interest-bearing liabilities:
 Interest-bearing deposits
    NOW accounts                                $   9,874,696    $    28,460        1.15%      $   9,292,819   $    30,263      1.30%   $   4,674,490   $    30,443      2.61%
    Money market deposit accounts                  28,556,264        171,891        2.41%         26,914,607       187,740      2.79%      28,745,701       270,943      3.77%
    Savings accounts                                7,275,816         11,774        0.65%          7,759,024        16,243      0.84%       8,172,510        32,520      1.59%
    Other consumer time deposits                   33,712,504        337,651        4.01%         26,733,531       262,101      3.92%      16,374,958       183,570      4.48%
    Public fund CD's of $100,000 or more            1,213,364          7,323        2.41%          1,305,438         8,233      2.52%       1,902,442        23,126      4.86%
    CD's of $100,000 or more                        9,508,463        104,134        4.38%          9,084,740        89,192      3.93%       8,335,941        97,335      4.67%
    Foreign time deposits                           3,002,402         23,523        3.13%          3,564,449        30,547      3.43%       3,868,444        48,237      4.99%
 Total interest-bearing deposits                $ 93,143,509     $ 684,756          2.94%      $ 84,654,608    $ 624,319        2.95%   $ 72,074,486    $ 686,174        3.81%
 Senior and subordinated notes                      8,034,423         92,519        4.61%          8,282,536        96,568      4.66%      10,682,635       159,878      5.99%
 Other borrowings                                  16,428,096        189,149        4.61%         22,368,976       244,264      4.37%      26,671,101       351,895      5.28%
 Securitization liability                          45,610,272        471,517        4.14%         48,069,177       491,780      4.09%      49,847,555       664,786      5.33%
Total interest-bearing liabilities              $ 163,216,300    $ 1,437,941        3.52%      $ 163,375,297   $ 1,456,931      3.57%   $ 159,275,777   $ 1,862,733      4.68%

Net interest spread                                                                 5.69%                                      6.10%                                    6.40%

Interest income to average earning assets                                           9.21%                                      9.67%                                   11.07%
Interest expense to average earning assets                                          3.15%                                      3.24%                                    4.24%
Net interest margin                                                                 6.06%                                      6.43%                                    6.83%


(1) The information in this table reflects the adjustment to add back the effect of securitized loans.
(2) Average balances, income and expenses, yields and rates are based on continuing operations.

More Related Content

What's hot

ual Annual Report2001
ual Annual Report2001ual Annual Report2001
ual Annual Report2001finance13
 
fluor annual reports 2003
fluor annual reports 2003fluor annual reports 2003
fluor annual reports 2003finance15
 
ual 1998 Annual Report - Low-Res (1.9Mb)
ual 1998 Annual Report - Low-Res (1.9Mb)ual 1998 Annual Report - Low-Res (1.9Mb)
ual 1998 Annual Report - Low-Res (1.9Mb)finance13
 
Big_Lots_AR2007
Big_Lots_AR2007Big_Lots_AR2007
Big_Lots_AR2007finance50
 
Reconciliations and Financial Slides from Safeway Investor Conference
	Reconciliations and Financial Slides from Safeway Investor Conference	Reconciliations and Financial Slides from Safeway Investor Conference
Reconciliations and Financial Slides from Safeway Investor Conferencefinance6
 
BBTfq4 2008 Fourth Quarter 2008_Financial_Tables
BBTfq4 2008 Fourth Quarter 2008_Financial_TablesBBTfq4 2008 Fourth Quarter 2008_Financial_Tables
BBTfq4 2008 Fourth Quarter 2008_Financial_Tablesfinance25
 
danaher 07_4Q_Release
danaher 07_4Q_Releasedanaher 07_4Q_Release
danaher 07_4Q_Releasefinance24
 
AR BBT Annual2005
AR BBT Annual2005AR BBT Annual2005
AR BBT Annual2005finance25
 
omnicom group Q4 2004 Earnings Release (pdf)
omnicom group  Q4 2004 Earnings Release (pdf)omnicom group  Q4 2004 Earnings Release (pdf)
omnicom group Q4 2004 Earnings Release (pdf)finance22
 
PEABODY ENERGY BTUQuarterlyData-website
PEABODY ENERGY BTUQuarterlyData-websitePEABODY ENERGY BTUQuarterlyData-website
PEABODY ENERGY BTUQuarterlyData-websitefinance37
 
state street corp stt_finrev02
state street corp stt_finrev02state street corp stt_finrev02
state street corp stt_finrev02finance23
 
avery denninson2008AnnualReport_financials
avery denninson2008AnnualReport_financialsavery denninson2008AnnualReport_financials
avery denninson2008AnnualReport_financialsfinance45
 
alltel 3q 07_highlights
alltel  3q 07_highlightsalltel  3q 07_highlights
alltel 3q 07_highlightsfinance27
 
fProgressive 2003 review
fProgressive  2003 reviewfProgressive  2003 review
fProgressive 2003 reviewfinance18
 
RYDERFINAL 2Q05TablesFinal
RYDERFINAL 2Q05TablesFinalRYDERFINAL 2Q05TablesFinal
RYDERFINAL 2Q05TablesFinalfinance44
 
CLX0503SegInfo-159159
CLX0503SegInfo-159159CLX0503SegInfo-159159
CLX0503SegInfo-159159finance48
 
viacom FINAL%20Q108%20Web%20Deck
viacom FINAL%20Q108%20Web%20Deckviacom FINAL%20Q108%20Web%20Deck
viacom FINAL%20Q108%20Web%20Deckfinance20
 

What's hot (17)

ual Annual Report2001
ual Annual Report2001ual Annual Report2001
ual Annual Report2001
 
fluor annual reports 2003
fluor annual reports 2003fluor annual reports 2003
fluor annual reports 2003
 
ual 1998 Annual Report - Low-Res (1.9Mb)
ual 1998 Annual Report - Low-Res (1.9Mb)ual 1998 Annual Report - Low-Res (1.9Mb)
ual 1998 Annual Report - Low-Res (1.9Mb)
 
Big_Lots_AR2007
Big_Lots_AR2007Big_Lots_AR2007
Big_Lots_AR2007
 
Reconciliations and Financial Slides from Safeway Investor Conference
	Reconciliations and Financial Slides from Safeway Investor Conference	Reconciliations and Financial Slides from Safeway Investor Conference
Reconciliations and Financial Slides from Safeway Investor Conference
 
BBTfq4 2008 Fourth Quarter 2008_Financial_Tables
BBTfq4 2008 Fourth Quarter 2008_Financial_TablesBBTfq4 2008 Fourth Quarter 2008_Financial_Tables
BBTfq4 2008 Fourth Quarter 2008_Financial_Tables
 
danaher 07_4Q_Release
danaher 07_4Q_Releasedanaher 07_4Q_Release
danaher 07_4Q_Release
 
AR BBT Annual2005
AR BBT Annual2005AR BBT Annual2005
AR BBT Annual2005
 
omnicom group Q4 2004 Earnings Release (pdf)
omnicom group  Q4 2004 Earnings Release (pdf)omnicom group  Q4 2004 Earnings Release (pdf)
omnicom group Q4 2004 Earnings Release (pdf)
 
PEABODY ENERGY BTUQuarterlyData-website
PEABODY ENERGY BTUQuarterlyData-websitePEABODY ENERGY BTUQuarterlyData-website
PEABODY ENERGY BTUQuarterlyData-website
 
state street corp stt_finrev02
state street corp stt_finrev02state street corp stt_finrev02
state street corp stt_finrev02
 
avery denninson2008AnnualReport_financials
avery denninson2008AnnualReport_financialsavery denninson2008AnnualReport_financials
avery denninson2008AnnualReport_financials
 
alltel 3q 07_highlights
alltel  3q 07_highlightsalltel  3q 07_highlights
alltel 3q 07_highlights
 
fProgressive 2003 review
fProgressive  2003 reviewfProgressive  2003 review
fProgressive 2003 review
 
RYDERFINAL 2Q05TablesFinal
RYDERFINAL 2Q05TablesFinalRYDERFINAL 2Q05TablesFinal
RYDERFINAL 2Q05TablesFinal
 
CLX0503SegInfo-159159
CLX0503SegInfo-159159CLX0503SegInfo-159159
CLX0503SegInfo-159159
 
viacom FINAL%20Q108%20Web%20Deck
viacom FINAL%20Q108%20Web%20Deckviacom FINAL%20Q108%20Web%20Deck
viacom FINAL%20Q108%20Web%20Deck
 

Viewers also liked

whirlpool The Whirlpool Strategy
whirlpool The Whirlpool Strategywhirlpool The Whirlpool Strategy
whirlpool The Whirlpool Strategyfinance13
 
staples Annual Report 2002
staples Annual Report 2002staples Annual Report 2002
staples Annual Report 2002finance13
 
capital oneSanford C. Bernstein & Co. Strategic Decisions Conference Presenta...
capital oneSanford C. Bernstein & Co. Strategic Decisions Conference Presenta...capital oneSanford C. Bernstein & Co. Strategic Decisions Conference Presenta...
capital oneSanford C. Bernstein & Co. Strategic Decisions Conference Presenta...finance13
 
capital one Lehman Conference Presentation
capital one Lehman Conference Presentationcapital one Lehman Conference Presentation
capital one Lehman Conference Presentationfinance13
 
capital one Annual Report2002
capital one  Annual Report2002capital one  Annual Report2002
capital one Annual Report2002finance13
 
delta air line 2008 Investor Day
delta air line 2008 Investor Daydelta air line 2008 Investor Day
delta air line 2008 Investor Dayfinance13
 
capital one Annual Report2003
capital one  Annual Report2003capital one  Annual Report2003
capital one Annual Report2003finance13
 
delta air line 2008 1st
delta air line 2008 1stdelta air line 2008 1st
delta air line 2008 1stfinance13
 
whirlpool Annual Report2000
whirlpool Annual Report2000whirlpool Annual Report2000
whirlpool Annual Report2000finance13
 
capital one Annual Report1999
capital one  Annual Report1999capital one  Annual Report1999
capital one Annual Report1999finance13
 
capital one Q3 2008 Capital One Financial Earnings Conference Call Presentation
capital one Q3 2008 Capital One Financial Earnings Conference Call Presentationcapital one Q3 2008 Capital One Financial Earnings Conference Call Presentation
capital one Q3 2008 Capital One Financial Earnings Conference Call Presentationfinance13
 
capital one 2007 Policy Affairs Group Annual Report
capital one 2007 Policy Affairs Group Annual Reportcapital one 2007 Policy Affairs Group Annual Report
capital one 2007 Policy Affairs Group Annual Reportfinance13
 
delta air line 2007 4th
 delta air line 2007 4th delta air line 2007 4th
delta air line 2007 4thfinance13
 
capital one Annual Report1996
capital one  Annual Report1996capital one  Annual Report1996
capital one Annual Report1996finance13
 
delta air line 2007 mar
delta air line 2007 mardelta air line 2007 mar
delta air line 2007 marfinance13
 
capital one Annual Report2001
capital one  Annual Report2001capital one  Annual Report2001
capital one Annual Report2001finance13
 
capital oneLehman Brothers Eleventh Annual Lehman Financial Services Conferen...
capital oneLehman Brothers Eleventh Annual Lehman Financial Services Conferen...capital oneLehman Brothers Eleventh Annual Lehman Financial Services Conferen...
capital oneLehman Brothers Eleventh Annual Lehman Financial Services Conferen...finance13
 
delta air line Reconciliations 2004
delta air line Reconciliations 2004delta air line Reconciliations 2004
delta air line Reconciliations 2004finance13
 
capital one 2007 Annual Report
capital one 2007 Annual Reportcapital one 2007 Annual Report
capital one 2007 Annual Reportfinance13
 
capital onePrinter Friendly Version of the Conference Call Presentation
capital onePrinter Friendly Version of the Conference Call Presentationcapital onePrinter Friendly Version of the Conference Call Presentation
capital onePrinter Friendly Version of the Conference Call Presentationfinance13
 

Viewers also liked (20)

whirlpool The Whirlpool Strategy
whirlpool The Whirlpool Strategywhirlpool The Whirlpool Strategy
whirlpool The Whirlpool Strategy
 
staples Annual Report 2002
staples Annual Report 2002staples Annual Report 2002
staples Annual Report 2002
 
capital oneSanford C. Bernstein & Co. Strategic Decisions Conference Presenta...
capital oneSanford C. Bernstein & Co. Strategic Decisions Conference Presenta...capital oneSanford C. Bernstein & Co. Strategic Decisions Conference Presenta...
capital oneSanford C. Bernstein & Co. Strategic Decisions Conference Presenta...
 
capital one Lehman Conference Presentation
capital one Lehman Conference Presentationcapital one Lehman Conference Presentation
capital one Lehman Conference Presentation
 
capital one Annual Report2002
capital one  Annual Report2002capital one  Annual Report2002
capital one Annual Report2002
 
delta air line 2008 Investor Day
delta air line 2008 Investor Daydelta air line 2008 Investor Day
delta air line 2008 Investor Day
 
capital one Annual Report2003
capital one  Annual Report2003capital one  Annual Report2003
capital one Annual Report2003
 
delta air line 2008 1st
delta air line 2008 1stdelta air line 2008 1st
delta air line 2008 1st
 
whirlpool Annual Report2000
whirlpool Annual Report2000whirlpool Annual Report2000
whirlpool Annual Report2000
 
capital one Annual Report1999
capital one  Annual Report1999capital one  Annual Report1999
capital one Annual Report1999
 
capital one Q3 2008 Capital One Financial Earnings Conference Call Presentation
capital one Q3 2008 Capital One Financial Earnings Conference Call Presentationcapital one Q3 2008 Capital One Financial Earnings Conference Call Presentation
capital one Q3 2008 Capital One Financial Earnings Conference Call Presentation
 
capital one 2007 Policy Affairs Group Annual Report
capital one 2007 Policy Affairs Group Annual Reportcapital one 2007 Policy Affairs Group Annual Report
capital one 2007 Policy Affairs Group Annual Report
 
delta air line 2007 4th
 delta air line 2007 4th delta air line 2007 4th
delta air line 2007 4th
 
capital one Annual Report1996
capital one  Annual Report1996capital one  Annual Report1996
capital one Annual Report1996
 
delta air line 2007 mar
delta air line 2007 mardelta air line 2007 mar
delta air line 2007 mar
 
capital one Annual Report2001
capital one  Annual Report2001capital one  Annual Report2001
capital one Annual Report2001
 
capital oneLehman Brothers Eleventh Annual Lehman Financial Services Conferen...
capital oneLehman Brothers Eleventh Annual Lehman Financial Services Conferen...capital oneLehman Brothers Eleventh Annual Lehman Financial Services Conferen...
capital oneLehman Brothers Eleventh Annual Lehman Financial Services Conferen...
 
delta air line Reconciliations 2004
delta air line Reconciliations 2004delta air line Reconciliations 2004
delta air line Reconciliations 2004
 
capital one 2007 Annual Report
capital one 2007 Annual Reportcapital one 2007 Annual Report
capital one 2007 Annual Report
 
capital onePrinter Friendly Version of the Conference Call Presentation
capital onePrinter Friendly Version of the Conference Call Presentationcapital onePrinter Friendly Version of the Conference Call Presentation
capital onePrinter Friendly Version of the Conference Call Presentation
 

Similar to capital one Printer Friendly Version of the Financial Supplement

Reconciliations from Recent Conferences
Reconciliations from Recent ConferencesReconciliations from Recent Conferences
Reconciliations from Recent Conferencesfinance6
 
alltel 4q 06_highlights
alltel  4q 06_highlightsalltel  4q 06_highlights
alltel 4q 06_highlightsfinance27
 
tribune earnings_q3_07_tables
tribune earnings_q3_07_tablestribune earnings_q3_07_tables
tribune earnings_q3_07_tablesfinance47
 
tribune earnings_q3_07_tables
tribune  earnings_q3_07_tablestribune  earnings_q3_07_tables
tribune earnings_q3_07_tablesfinance47
 
omnicom group Q3 2007 Earnings Release (
omnicom group  Q3 2007 Earnings Release (omnicom group  Q3 2007 Earnings Release (
omnicom group Q3 2007 Earnings Release (finance22
 
lemark international lxk_AR2005
lemark international lxk_AR2005lemark international lxk_AR2005
lemark international lxk_AR2005finance47
 
alltel 4Q 04_Highlights
alltel  4Q 04_Highlightsalltel  4Q 04_Highlights
alltel 4Q 04_Highlightsfinance27
 
alltel 4Q04_Highlights
alltel  4Q04_Highlightsalltel  4Q04_Highlights
alltel 4Q04_Highlightsfinance27
 
alltel 4Q 04_Highlights
alltel  4Q 04_Highlightsalltel  4Q 04_Highlights
alltel 4Q 04_Highlightsfinance27
 
alltel 4Q 04_Highlights
alltel  4Q 04_Highlightsalltel  4Q 04_Highlights
alltel 4Q 04_Highlightsfinance27
 
alltel 4Q04_Highlights
alltel  4Q04_Highlightsalltel  4Q04_Highlights
alltel 4Q04_Highlightsfinance27
 
alltel 4Q04_Highlights
alltel  4Q04_Highlightsalltel  4Q04_Highlights
alltel 4Q04_Highlightsfinance27
 
alltel 4Q 04_Highlights
alltel  4Q 04_Highlightsalltel  4Q 04_Highlights
alltel 4Q 04_Highlightsfinance27
 
alltel 4Q04_Highlights
alltel  4Q04_Highlightsalltel  4Q04_Highlights
alltel 4Q04_Highlightsfinance27
 
alltel 4Q 04_Highlights
alltel  4Q 04_Highlightsalltel  4Q 04_Highlights
alltel 4Q 04_Highlightsfinance27
 
alltel 4Q 04_Highlights
alltel  4Q 04_Highlightsalltel  4Q 04_Highlights
alltel 4Q 04_Highlightsfinance27
 
alltel 4Q04_Highlights
alltel  4Q04_Highlightsalltel  4Q04_Highlights
alltel 4Q04_Highlightsfinance27
 
alltel 4Q04_Highlights
alltel  4Q04_Highlightsalltel  4Q04_Highlights
alltel 4Q04_Highlightsfinance27
 
alltel 4Q 04_Highlights
alltel  4Q 04_Highlightsalltel  4Q 04_Highlights
alltel 4Q 04_Highlightsfinance27
 
alltel 4Q 04_Highlights
alltel  4Q 04_Highlightsalltel  4Q 04_Highlights
alltel 4Q 04_Highlightsfinance27
 

Similar to capital one Printer Friendly Version of the Financial Supplement (20)

Reconciliations from Recent Conferences
Reconciliations from Recent ConferencesReconciliations from Recent Conferences
Reconciliations from Recent Conferences
 
alltel 4q 06_highlights
alltel  4q 06_highlightsalltel  4q 06_highlights
alltel 4q 06_highlights
 
tribune earnings_q3_07_tables
tribune earnings_q3_07_tablestribune earnings_q3_07_tables
tribune earnings_q3_07_tables
 
tribune earnings_q3_07_tables
tribune  earnings_q3_07_tablestribune  earnings_q3_07_tables
tribune earnings_q3_07_tables
 
omnicom group Q3 2007 Earnings Release (
omnicom group  Q3 2007 Earnings Release (omnicom group  Q3 2007 Earnings Release (
omnicom group Q3 2007 Earnings Release (
 
lemark international lxk_AR2005
lemark international lxk_AR2005lemark international lxk_AR2005
lemark international lxk_AR2005
 
alltel 4Q 04_Highlights
alltel  4Q 04_Highlightsalltel  4Q 04_Highlights
alltel 4Q 04_Highlights
 
alltel 4Q04_Highlights
alltel  4Q04_Highlightsalltel  4Q04_Highlights
alltel 4Q04_Highlights
 
alltel 4Q 04_Highlights
alltel  4Q 04_Highlightsalltel  4Q 04_Highlights
alltel 4Q 04_Highlights
 
alltel 4Q 04_Highlights
alltel  4Q 04_Highlightsalltel  4Q 04_Highlights
alltel 4Q 04_Highlights
 
alltel 4Q04_Highlights
alltel  4Q04_Highlightsalltel  4Q04_Highlights
alltel 4Q04_Highlights
 
alltel 4Q04_Highlights
alltel  4Q04_Highlightsalltel  4Q04_Highlights
alltel 4Q04_Highlights
 
alltel 4Q 04_Highlights
alltel  4Q 04_Highlightsalltel  4Q 04_Highlights
alltel 4Q 04_Highlights
 
alltel 4Q04_Highlights
alltel  4Q04_Highlightsalltel  4Q04_Highlights
alltel 4Q04_Highlights
 
alltel 4Q 04_Highlights
alltel  4Q 04_Highlightsalltel  4Q 04_Highlights
alltel 4Q 04_Highlights
 
alltel 4Q 04_Highlights
alltel  4Q 04_Highlightsalltel  4Q 04_Highlights
alltel 4Q 04_Highlights
 
alltel 4Q04_Highlights
alltel  4Q04_Highlightsalltel  4Q04_Highlights
alltel 4Q04_Highlights
 
alltel 4Q04_Highlights
alltel  4Q04_Highlightsalltel  4Q04_Highlights
alltel 4Q04_Highlights
 
alltel 4Q 04_Highlights
alltel  4Q 04_Highlightsalltel  4Q 04_Highlights
alltel 4Q 04_Highlights
 
alltel 4Q 04_Highlights
alltel  4Q 04_Highlightsalltel  4Q 04_Highlights
alltel 4Q 04_Highlights
 

More from finance13

capital oneQ1 2008 Capital One Financial Earnings Conference Call Presentation
capital oneQ1 2008 Capital One Financial Earnings Conference Call Presentationcapital oneQ1 2008 Capital One Financial Earnings Conference Call Presentation
capital oneQ1 2008 Capital One Financial Earnings Conference Call Presentationfinance13
 
capital oneCapital One Financial Corp. Shareholders Meeting Presentation
capital oneCapital One Financial Corp. Shareholders Meeting Presentationcapital oneCapital One Financial Corp. Shareholders Meeting Presentation
capital oneCapital One Financial Corp. Shareholders Meeting Presentationfinance13
 
capital one Keefe, Bruyette & Woods, Inc. Diversified Financial Services Conf...
capital one Keefe, Bruyette & Woods, Inc. Diversified Financial Services Conf...capital one Keefe, Bruyette & Woods, Inc. Diversified Financial Services Conf...
capital one Keefe, Bruyette & Woods, Inc. Diversified Financial Services Conf...finance13
 
capital one Q2 2008 Capital One Financial Earnings Conference Call Presentation
capital one Q2 2008 Capital One Financial Earnings Conference Call Presentationcapital one Q2 2008 Capital One Financial Earnings Conference Call Presentation
capital one Q2 2008 Capital One Financial Earnings Conference Call Presentationfinance13
 
capital one Capital One Acquisition of Chevy Chase Bank
capital one Capital One Acquisition of Chevy Chase Bankcapital one Capital One Acquisition of Chevy Chase Bank
capital one Capital One Acquisition of Chevy Chase Bankfinance13
 
capital one Printer Friendly Version of the Press Release
capital one Printer Friendly Version of the Press Releasecapital one Printer Friendly Version of the Press Release
capital one Printer Friendly Version of the Press Releasefinance13
 
capital one Annual Report1997
capital one  Annual Report1997capital one  Annual Report1997
capital one Annual Report1997finance13
 
capital one Annual Report1998
capital one  Annual Report1998capital one  Annual Report1998
capital one Annual Report1998finance13
 
capital one Annual Report2005
capital one  Annual Report2005capital one  Annual Report2005
capital one Annual Report2005finance13
 
capital one Annual Report2000
capital one  Annual Report2000capital one  Annual Report2000
capital one Annual Report2000finance13
 
capital one Annual Report2004
capital one  Annual Report2004capital one  Annual Report2004
capital one Annual Report2004finance13
 
capital one Annual Report2006
capital one  Annual Report2006capital one  Annual Report2006
capital one Annual Report2006finance13
 
capital one 2008 Proxy Statement
capital one 	2008 Proxy Statementcapital one 	2008 Proxy Statement
capital one 2008 Proxy Statementfinance13
 
delta air line Reconciliations 2005
delta air line Reconciliations 2005delta air line Reconciliations 2005
delta air line Reconciliations 2005finance13
 
delta air line Reconciliations 2003
delta air line Reconciliations 2003delta air line Reconciliations 2003
delta air line Reconciliations 2003finance13
 
delta air line Reconciliations 2002
delta air line Reconciliations 2002delta air line Reconciliations 2002
delta air line Reconciliations 2002finance13
 
delta air line Reconciliations2001
delta air line Reconciliations2001delta air line Reconciliations2001
delta air line Reconciliations2001finance13
 

More from finance13 (17)

capital oneQ1 2008 Capital One Financial Earnings Conference Call Presentation
capital oneQ1 2008 Capital One Financial Earnings Conference Call Presentationcapital oneQ1 2008 Capital One Financial Earnings Conference Call Presentation
capital oneQ1 2008 Capital One Financial Earnings Conference Call Presentation
 
capital oneCapital One Financial Corp. Shareholders Meeting Presentation
capital oneCapital One Financial Corp. Shareholders Meeting Presentationcapital oneCapital One Financial Corp. Shareholders Meeting Presentation
capital oneCapital One Financial Corp. Shareholders Meeting Presentation
 
capital one Keefe, Bruyette & Woods, Inc. Diversified Financial Services Conf...
capital one Keefe, Bruyette & Woods, Inc. Diversified Financial Services Conf...capital one Keefe, Bruyette & Woods, Inc. Diversified Financial Services Conf...
capital one Keefe, Bruyette & Woods, Inc. Diversified Financial Services Conf...
 
capital one Q2 2008 Capital One Financial Earnings Conference Call Presentation
capital one Q2 2008 Capital One Financial Earnings Conference Call Presentationcapital one Q2 2008 Capital One Financial Earnings Conference Call Presentation
capital one Q2 2008 Capital One Financial Earnings Conference Call Presentation
 
capital one Capital One Acquisition of Chevy Chase Bank
capital one Capital One Acquisition of Chevy Chase Bankcapital one Capital One Acquisition of Chevy Chase Bank
capital one Capital One Acquisition of Chevy Chase Bank
 
capital one Printer Friendly Version of the Press Release
capital one Printer Friendly Version of the Press Releasecapital one Printer Friendly Version of the Press Release
capital one Printer Friendly Version of the Press Release
 
capital one Annual Report1997
capital one  Annual Report1997capital one  Annual Report1997
capital one Annual Report1997
 
capital one Annual Report1998
capital one  Annual Report1998capital one  Annual Report1998
capital one Annual Report1998
 
capital one Annual Report2005
capital one  Annual Report2005capital one  Annual Report2005
capital one Annual Report2005
 
capital one Annual Report2000
capital one  Annual Report2000capital one  Annual Report2000
capital one Annual Report2000
 
capital one Annual Report2004
capital one  Annual Report2004capital one  Annual Report2004
capital one Annual Report2004
 
capital one Annual Report2006
capital one  Annual Report2006capital one  Annual Report2006
capital one Annual Report2006
 
capital one 2008 Proxy Statement
capital one 	2008 Proxy Statementcapital one 	2008 Proxy Statement
capital one 2008 Proxy Statement
 
delta air line Reconciliations 2005
delta air line Reconciliations 2005delta air line Reconciliations 2005
delta air line Reconciliations 2005
 
delta air line Reconciliations 2003
delta air line Reconciliations 2003delta air line Reconciliations 2003
delta air line Reconciliations 2003
 
delta air line Reconciliations 2002
delta air line Reconciliations 2002delta air line Reconciliations 2002
delta air line Reconciliations 2002
 
delta air line Reconciliations2001
delta air line Reconciliations2001delta air line Reconciliations2001
delta air line Reconciliations2001
 

Recently uploaded

VIP Call Girls LB Nagar ( Hyderabad ) Phone 8250192130 | ₹5k To 25k With Room...
VIP Call Girls LB Nagar ( Hyderabad ) Phone 8250192130 | ₹5k To 25k With Room...VIP Call Girls LB Nagar ( Hyderabad ) Phone 8250192130 | ₹5k To 25k With Room...
VIP Call Girls LB Nagar ( Hyderabad ) Phone 8250192130 | ₹5k To 25k With Room...Suhani Kapoor
 
SBP-Market-Operations and market managment
SBP-Market-Operations and market managmentSBP-Market-Operations and market managment
SBP-Market-Operations and market managmentfactical
 
Bladex Earnings Call Presentation 1Q2024
Bladex Earnings Call Presentation 1Q2024Bladex Earnings Call Presentation 1Q2024
Bladex Earnings Call Presentation 1Q2024Bladex
 
Financial institutions facilitate financing, economic transactions, issue fun...
Financial institutions facilitate financing, economic transactions, issue fun...Financial institutions facilitate financing, economic transactions, issue fun...
Financial institutions facilitate financing, economic transactions, issue fun...Avanish Goel
 
magnetic-pensions-a-new-blueprint-for-the-dc-landscape.pdf
magnetic-pensions-a-new-blueprint-for-the-dc-landscape.pdfmagnetic-pensions-a-new-blueprint-for-the-dc-landscape.pdf
magnetic-pensions-a-new-blueprint-for-the-dc-landscape.pdfHenry Tapper
 
letter-from-the-chair-to-the-fca-relating-to-british-steel-pensions-scheme-15...
letter-from-the-chair-to-the-fca-relating-to-british-steel-pensions-scheme-15...letter-from-the-chair-to-the-fca-relating-to-british-steel-pensions-scheme-15...
letter-from-the-chair-to-the-fca-relating-to-british-steel-pensions-scheme-15...Henry Tapper
 
Vip B Aizawl Call Girls #9907093804 Contact Number Escorts Service Aizawl
Vip B Aizawl Call Girls #9907093804 Contact Number Escorts Service AizawlVip B Aizawl Call Girls #9907093804 Contact Number Escorts Service Aizawl
Vip B Aizawl Call Girls #9907093804 Contact Number Escorts Service Aizawlmakika9823
 
VIP Call Girls Service Dilsukhnagar Hyderabad Call +91-8250192130
VIP Call Girls Service Dilsukhnagar Hyderabad Call +91-8250192130VIP Call Girls Service Dilsukhnagar Hyderabad Call +91-8250192130
VIP Call Girls Service Dilsukhnagar Hyderabad Call +91-8250192130Suhani Kapoor
 
20240417-Calibre-April-2024-Investor-Presentation.pdf
20240417-Calibre-April-2024-Investor-Presentation.pdf20240417-Calibre-April-2024-Investor-Presentation.pdf
20240417-Calibre-April-2024-Investor-Presentation.pdfAdnet Communications
 
government_intervention_in_business_ownership[1].pdf
government_intervention_in_business_ownership[1].pdfgovernment_intervention_in_business_ownership[1].pdf
government_intervention_in_business_ownership[1].pdfshaunmashale756
 
VIP Kolkata Call Girl Serampore 👉 8250192130 Available With Room
VIP Kolkata Call Girl Serampore 👉 8250192130  Available With RoomVIP Kolkata Call Girl Serampore 👉 8250192130  Available With Room
VIP Kolkata Call Girl Serampore 👉 8250192130 Available With Roomdivyansh0kumar0
 
Vp Girls near me Delhi Call Now or WhatsApp
Vp Girls near me Delhi Call Now or WhatsAppVp Girls near me Delhi Call Now or WhatsApp
Vp Girls near me Delhi Call Now or WhatsAppmiss dipika
 
Log your LOA pain with Pension Lab's brilliant campaign
Log your LOA pain with Pension Lab's brilliant campaignLog your LOA pain with Pension Lab's brilliant campaign
Log your LOA pain with Pension Lab's brilliant campaignHenry Tapper
 
Bladex 1Q24 Earning Results Presentation
Bladex 1Q24 Earning Results PresentationBladex 1Q24 Earning Results Presentation
Bladex 1Q24 Earning Results PresentationBladex
 
fca-bsps-decision-letter-redacted (1).pdf
fca-bsps-decision-letter-redacted (1).pdffca-bsps-decision-letter-redacted (1).pdf
fca-bsps-decision-letter-redacted (1).pdfHenry Tapper
 
Interimreport1 January–31 March2024 Elo Mutual Pension Insurance Company
Interimreport1 January–31 March2024 Elo Mutual Pension Insurance CompanyInterimreport1 January–31 March2024 Elo Mutual Pension Insurance Company
Interimreport1 January–31 March2024 Elo Mutual Pension Insurance CompanyTyöeläkeyhtiö Elo
 
Russian Call Girls In Gtb Nagar (Delhi) 9711199012 💋✔💕😘 Naughty Call Girls Se...
Russian Call Girls In Gtb Nagar (Delhi) 9711199012 💋✔💕😘 Naughty Call Girls Se...Russian Call Girls In Gtb Nagar (Delhi) 9711199012 💋✔💕😘 Naughty Call Girls Se...
Russian Call Girls In Gtb Nagar (Delhi) 9711199012 💋✔💕😘 Naughty Call Girls Se...shivangimorya083
 
Classical Theory of Macroeconomics by Adam Smith
Classical Theory of Macroeconomics by Adam SmithClassical Theory of Macroeconomics by Adam Smith
Classical Theory of Macroeconomics by Adam SmithAdamYassin2
 

Recently uploaded (20)

VIP Call Girls LB Nagar ( Hyderabad ) Phone 8250192130 | ₹5k To 25k With Room...
VIP Call Girls LB Nagar ( Hyderabad ) Phone 8250192130 | ₹5k To 25k With Room...VIP Call Girls LB Nagar ( Hyderabad ) Phone 8250192130 | ₹5k To 25k With Room...
VIP Call Girls LB Nagar ( Hyderabad ) Phone 8250192130 | ₹5k To 25k With Room...
 
Monthly Economic Monitoring of Ukraine No 231, April 2024
Monthly Economic Monitoring of Ukraine No 231, April 2024Monthly Economic Monitoring of Ukraine No 231, April 2024
Monthly Economic Monitoring of Ukraine No 231, April 2024
 
SBP-Market-Operations and market managment
SBP-Market-Operations and market managmentSBP-Market-Operations and market managment
SBP-Market-Operations and market managment
 
Bladex Earnings Call Presentation 1Q2024
Bladex Earnings Call Presentation 1Q2024Bladex Earnings Call Presentation 1Q2024
Bladex Earnings Call Presentation 1Q2024
 
Financial institutions facilitate financing, economic transactions, issue fun...
Financial institutions facilitate financing, economic transactions, issue fun...Financial institutions facilitate financing, economic transactions, issue fun...
Financial institutions facilitate financing, economic transactions, issue fun...
 
magnetic-pensions-a-new-blueprint-for-the-dc-landscape.pdf
magnetic-pensions-a-new-blueprint-for-the-dc-landscape.pdfmagnetic-pensions-a-new-blueprint-for-the-dc-landscape.pdf
magnetic-pensions-a-new-blueprint-for-the-dc-landscape.pdf
 
letter-from-the-chair-to-the-fca-relating-to-british-steel-pensions-scheme-15...
letter-from-the-chair-to-the-fca-relating-to-british-steel-pensions-scheme-15...letter-from-the-chair-to-the-fca-relating-to-british-steel-pensions-scheme-15...
letter-from-the-chair-to-the-fca-relating-to-british-steel-pensions-scheme-15...
 
Vip B Aizawl Call Girls #9907093804 Contact Number Escorts Service Aizawl
Vip B Aizawl Call Girls #9907093804 Contact Number Escorts Service AizawlVip B Aizawl Call Girls #9907093804 Contact Number Escorts Service Aizawl
Vip B Aizawl Call Girls #9907093804 Contact Number Escorts Service Aizawl
 
VIP Call Girls Service Dilsukhnagar Hyderabad Call +91-8250192130
VIP Call Girls Service Dilsukhnagar Hyderabad Call +91-8250192130VIP Call Girls Service Dilsukhnagar Hyderabad Call +91-8250192130
VIP Call Girls Service Dilsukhnagar Hyderabad Call +91-8250192130
 
20240417-Calibre-April-2024-Investor-Presentation.pdf
20240417-Calibre-April-2024-Investor-Presentation.pdf20240417-Calibre-April-2024-Investor-Presentation.pdf
20240417-Calibre-April-2024-Investor-Presentation.pdf
 
government_intervention_in_business_ownership[1].pdf
government_intervention_in_business_ownership[1].pdfgovernment_intervention_in_business_ownership[1].pdf
government_intervention_in_business_ownership[1].pdf
 
VIP Kolkata Call Girl Serampore 👉 8250192130 Available With Room
VIP Kolkata Call Girl Serampore 👉 8250192130  Available With RoomVIP Kolkata Call Girl Serampore 👉 8250192130  Available With Room
VIP Kolkata Call Girl Serampore 👉 8250192130 Available With Room
 
Vp Girls near me Delhi Call Now or WhatsApp
Vp Girls near me Delhi Call Now or WhatsAppVp Girls near me Delhi Call Now or WhatsApp
Vp Girls near me Delhi Call Now or WhatsApp
 
Log your LOA pain with Pension Lab's brilliant campaign
Log your LOA pain with Pension Lab's brilliant campaignLog your LOA pain with Pension Lab's brilliant campaign
Log your LOA pain with Pension Lab's brilliant campaign
 
Bladex 1Q24 Earning Results Presentation
Bladex 1Q24 Earning Results PresentationBladex 1Q24 Earning Results Presentation
Bladex 1Q24 Earning Results Presentation
 
fca-bsps-decision-letter-redacted (1).pdf
fca-bsps-decision-letter-redacted (1).pdffca-bsps-decision-letter-redacted (1).pdf
fca-bsps-decision-letter-redacted (1).pdf
 
🔝+919953056974 🔝young Delhi Escort service Pusa Road
🔝+919953056974 🔝young Delhi Escort service Pusa Road🔝+919953056974 🔝young Delhi Escort service Pusa Road
🔝+919953056974 🔝young Delhi Escort service Pusa Road
 
Interimreport1 January–31 March2024 Elo Mutual Pension Insurance Company
Interimreport1 January–31 March2024 Elo Mutual Pension Insurance CompanyInterimreport1 January–31 March2024 Elo Mutual Pension Insurance Company
Interimreport1 January–31 March2024 Elo Mutual Pension Insurance Company
 
Russian Call Girls In Gtb Nagar (Delhi) 9711199012 💋✔💕😘 Naughty Call Girls Se...
Russian Call Girls In Gtb Nagar (Delhi) 9711199012 💋✔💕😘 Naughty Call Girls Se...Russian Call Girls In Gtb Nagar (Delhi) 9711199012 💋✔💕😘 Naughty Call Girls Se...
Russian Call Girls In Gtb Nagar (Delhi) 9711199012 💋✔💕😘 Naughty Call Girls Se...
 
Classical Theory of Macroeconomics by Adam Smith
Classical Theory of Macroeconomics by Adam SmithClassical Theory of Macroeconomics by Adam Smith
Classical Theory of Macroeconomics by Adam Smith
 

capital one Printer Friendly Version of the Financial Supplement

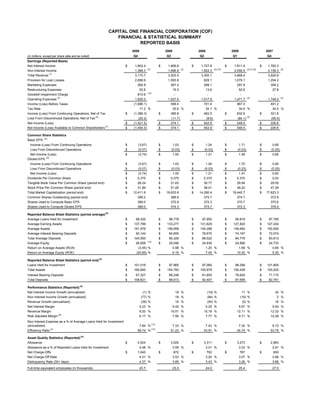
  • 1. CAPITAL ONE FINANCIAL CORPORATION (COF) FINANCIAL & STATISTICAL SUMMARY REPORTED BASIS 2008 2008 2008 2008 2007 Q4 Q3 Q2 Q1 Q4 (in millions, except per share data and as noted) Earnings (Reported Basis) Net Interest Income $ 1,802.4 $ 1,806.6 $ 1,727.8 $ 1,811.9 $ 1,762.3 1,368.3 (2) 1,696.9 (2) 1,622.3 (2),(10) 2,056.5 (2),(7),(8) 2,158.3 (6) Non-Interest Income Total Revenue (1) 3,170.7 3,503.5 3,350.1 3,868.4 3,920.6 Provision for Loan Losses 2,098.9 1,093.9 829.1 1,079.1 1,294.2 Marketing Expenses 264.9 267.4 288.1 297.8 358.2 Restructuring Expenses 52.8 15.3 13.6 52.8 27.8 810.9 (12) Goodwill Impairment Charge - - - - Operating Expenses (3) 1,471.7 (4) 1,749.2 (4) 1,629.3 1,527.5 1,517.9 Income (Loss) Before Taxes (1,686.1) 599.4 701.4 967.0 491.2 Tax Rate 17.2 % 35.6 % 34.1 % 34.6 % 34.5 % Income (Loss) From Continuing Operations, Net of Tax $ (1,396.3) $ 385.8 $ 462.5 $ 632.6 $ 321.6 Loss From Discontinued Operations, Net of Tax (5) (84.1) (9) (25.2) (11.7) (9.6) (95.0) Net Income (Loss) $ (1,421.5) $ 374.1 $ 452.9 $ 548.5 $ 226.6 Net Income (Loss) Available to Common Shareholders (F) $ (1,454.3) $ 374.1 $ 452.9 $ 548.5 $ 226.6 Common Share Statistics Basic EPS: (G) Income (Loss) From Continuing Operations $ (3.67) $ 1.03 $ 1.24 $ 1.71 $ 0.85 Loss From Discontinued Operations $ (0.07) $ (0.03) $ (0.03) $ (0.23) $ (0.25) Net Income (Loss) $ (3.74) $ 1.00 $ 1.21 $ 1.48 $ 0.60 Diluted EPS: (G) Income (Loss) From Continuing Operations $ (3.67) $ 1.03 $ 1.24 $ 1.70 $ 0.85 Loss From Discontinued Operations $ (0.07) $ (0.03) $ (0.03) $ (0.23) $ (0.25) Net Income (Loss) $ (3.74) $ 1.00 $ 1.21 $ 1.47 $ 0.60 Dividends Per Common Share $ 0.375 $ 0.375 $ 0.375 $ 0.375 $ 0.03 Tangible Book Value Per Common Share (period end) $ 28.24 $ 31.63 $ 30.77 $ 29.94 $ 29.00 Stock Price Per Common Share (period end) $ 31.89 $ 51.00 $ 38.01 $ 49.22 $ 47.26 Total Market Capitalization (period end) $ 12,411.6 $ 19,833.9 $ 14,280.4 $ 18,442.7 $ 17,623.3 Common Shares Outstanding (period end) 389.2 388.9 375.7 374.7 372.9 Shares Used to Compute Basic EPS 389.0 372.9 372.3 370.7 375.6 Shares Used to Compute Diluted EPS 389.0 374.3 373.7 372.3 378.4 Reported Balance Sheet Statistics (period average) (A) Average Loans Held for Investment $ 99,335 $ 98,778 $ 97,950 $ 99,819 $ 97,785 Average Earning Assets $ 137,799 $ 133,277 $ 131,629 $ 127,820 $ 127,242 Average Assets $ 161,976 $ 156,958 $ 154,288 $ 149,460 $ 150,926 Average Interest Bearing Deposits $ 93,144 $ 84,655 $ 78,675 $ 74,167 $ 72,074 Total Average Deposits $ 104,093 $ 95,328 $ 89,522 $ 84,779 $ 83,813 26,658 (14) Average Equity $ $ 25,046 $ 24,839 $ 24,569 $ 24,733 Return on Average Assets (ROA) (3.45) % 0.98 % 1.20 % 1.69 % 0.85 % Return on Average Equity (ROE) (20.95) % 6.16 % 7.45 % 10.30 % 5.20 % Reported Balance Sheet Statistics (period end) (A) Loans Held for Investment $ 101,018 $ 97,965 $ 97,065 $ 98,356 $ 101,805 Total Assets $ 165,945 $ 154,783 $ 150,978 $ 150,428 $ 150,202 Interest Bearing Deposits $ 97,327 $ 88,248 $ 81,655 $ 76,624 $ 71,715 Total Deposits $ 108,621 $ 98,913 $ 92,407 $ 87,695 $ 82,761 Performance Statistics (Reported) (A) Net Interest Income Growth (annualized) (1) % 18 % (19) % 11 % 34 % Non Interest Income Growth (annualized) (77) % 18 % (84) % (19) % 2 % Revenue Growth (annualized) (38) % 18 % (54) % (5) % 16 % Net Interest Margin 5.23 % 5.42 % 5.25 % 5.67 % 5.54 % Revenue Margin 9.20 % 10.51 % 10.18 % 12.11 % 12.32 % Risk Adjusted Margin (B) 6.17 % 7.90 % 7.77 % 9.71 % 10.28 % Non Interest Expense as a % of Average Loans Held for Investment (13) (annualized) 7.84 % 7.33 % 7.43 % 7.30 % 8.73 % Efficiency Ratio (C) (13) 59.74 % 51.23 % 53.91 % 45.74 % 53.75 % Asset Quality Statistics (Reported) (A) Allowance $ 4,524 $ 3,520 $ 3,311 $ 3,273 $ 2,963 Allowance as a % of Reported Loans Held for Investment 4.48 % 3.59 % 3.41 % 3.33 % 2.91 % Net Charge-Offs $ 1,045 $ 872 $ 793 $ 767 $ 650 Net Charge-Off Rate 4.21 % 3.53 % 3.24 % 3.07 % 2.66 % Delinquency Rate (30+ days) 4.37 % 3.85 % 3.43 % 3.26 % 3.66 % Full-time equivalent employees (in thousands) 23.7 23.5 24.0 25.4 27.0
  • 2. CAPITAL ONE FINANCIAL CORPORATION (COF) FINANCIAL & STATISTICAL SUMMARY MANAGED BASIS (*) 2008 2008 2008 2008 2007 Q4 Q3 Q2 Q1 Q4 (in millions) Earnings (Managed Basis) Net Interest Income $ 2,767.9 $ 2,889.3 $ 2,788.0 $ 2,976.8 $ 3,000.5 1,183.2 (2) 1,325.6 (2) 1,302.0 (2),(10) 1,606.7 (2),(7),(8) 1,566.2 (6) Non-Interest Income Total Revenue (1) 3,951.1 4,214.9 4,090.0 4,583.5 4,566.7 Provision for Loan Losses 2,879.3 1,805.3 1,569.0 1,794.2 1,940.3 Marketing Expenses 264.9 267.4 288.1 297.8 358.2 Restructuring Expenses 52.8 15.3 13.6 52.8 27.8 810.9 (12) Goodwill Impairment Charge - - - - Operating Expenses (3) 1,471.7 (4) 1,749.2 (4) 1,629.3 1,527.5 1,517.9 Income (Loss) Before Taxes (1,686.1) 599.4 701.4 967.0 491.2 Tax Rate 17.2 % 35.6 % 34.1 % 34.6 % 34.5 % Income (Loss) From Continuing Operations, Net of Tax $ (1,396.3) $ 385.8 $ 462.5 $ 632.6 $ 321.6 Loss From Discontinued Operations, Net of Tax (5) (84.1) (9) (25.2) (11.7) (9.6) (95.0) Net Income (Loss) $ (1,421.5) $ 374.1 $ 452.9 $ 548.5 $ 226.6 Net Income (Loss) Available to Common Shareholders (F) $ (1,454.3) $ 374.1 $ 452.9 $ 548.5 $ 226.6 Managed Balance Sheet Statistics (period average) (A) Average Loans Held for Investment $ 146,586 $ 147,247 $ 147,716 $ 149,719 $ 148,362 Average Earning Assets $ 182,660 $ 179,753 $ 179,421 $ 175,709 $ 175,652 Average Assets $ 207,240 $ 204,694 $ 203,308 $ 198,516 $ 200,658 Return on Average Assets (ROA) (2.70) % 0.75 % 0.91 % 1.27 % 0.64 % Managed Balance Sheet Statistics (period end) (A) Loans Held for Investment $ 146,937 $ 147,346 $ 147,247 $ 148,037 $ 151,362 Total Assets $ 209,907 $ 203,452 $ 200,420 $ 199,362 $ 198,908 Tangible Assets(D) $ 197,404 $ 190,141 $ 187,059 $ 185,962 $ 185,428 Tangible Common Equity (E) $ 10,990 $ 12,301 $ 11,560 $ 11,220 $ 10,814 (11) 6.47 % Tangible Common Equity to Tangible Assets Ratio 5.57 % 6.18 % 6.03 % 5.83 % % Off-Balance Sheet Securitizations 31 % 34 % 34 % 34 % 33 % Performance Statistics (Managed) (A) Net Interest Income Growth (annualized) (17) % 15 % (25) % (3) % 28 % Non Interest Income Growth (annualized) (43) % 7 % (76) % 10 % 13 % Revenue Growth (annualized) (25) % 12 % (43) % 1 % 23 % Net Interest Margin 6.06 % 6.43 % 6.22 % 6.78 % 6.83 % Revenue Margin 8.65 % 9.38 % 9.12 % 10.43 % 10.40 % Risk Adjusted Margin (B) 4.65 % 5.86 % 5.70 % 7.06 % 7.45 % Non Interest Expense as a % of Average Loans Held for (13) Investment (annualized) 5.31 % 4.92 % 4.93 % 4.87 % 5.76 % Efficiency Ratio (C) (13) 47.94 % 42.58 % 44.16 % 38.61 % 46.15 % Asset Quality Statistics (Managed) (A) Net Charge-Offs $ 1,826 $ 1,583 $ 1,533 $ 1,482 $ 1,296 Net Charge-Off Rate 4.98 % 4.30 % 4.15 % 3.96 % 3.49 % Delinquency Rate (30+ days) 4.49 % 3.99 % 3.64 % 3.56 % 3.87 % (*) The information in this statistical summary reflects the adjustment to add back the effect of securitization transactions qualifying as sales under generally accepted accounting principles. See accompanying schedule - quot;Reconciliation to GAAP Financial Measuresquot;.
  • 3. CAPITAL ONE FINANCIAL CORPORATION (COF) FINANCIAL & STATISTICAL SUMMARY NOTES (1) In accordance with the Company's finance charge and fee revenue recognition policy, the amounts billed to customers but not recognized as revenue were as follows: Q4 2008 - $591.0 million, Q3 2008 - $445.7 million, Q2 2008 - $476.0 million, Q1 2008 - $407.6 million, and Q4 2007 - $379.4 million. (2) Includes the impact from the decrease in fair value of the interest-only strips of $131.0 million in Q4 2008, $66.7 million in Q3 2008 and $71.0 million in Q2 2008. In Q1 2008 the Company recorded an increase of $42.8 million to its interest-only strips. (3) Includes core deposit intangible amortization expense of $46.0 million in Q4 2008, $47.3 million in Q3 2008, $48.5 million in Q2 2008, $49.8 million in Q1 2008, and $51.1 million in Q4 2007 and integration costs of $3.2 million in Q4 2008, $10.3million in Q3 2008, $27.4 million in Q2 2008, $28.9 million in Q1 2008, and $28.6 million in Q4 2007. (4) In Q4 2007, the Company recognized a pre-tax charge of approximately $140 million for liabilities in connection with the Visa antitrust lawsuit settlement with American Express and estimated possible damages in connection with other pending Visa litigation. In Q1 2008, the Company, in connection with the Visa initial public offering (IPO), reversed approximately $91 million of these legal liabilities. (5) In Q3 2007, the Company shutdown the mortgage origination operations of its wholesale mortgage banking unit, GreenPoint Mortgage, realizing an after tax loss of $898.0 million. The results of the mortgage origination operation of GreenPoint have been accounted for as a discontinued operation and have been removed from the Company's results of continuing operations for all periods presented. The results of GreenPoint's mortgage servicing business are reported in continuing operations for all periods presented. Effective Q4 2007, GreenPoint's held for investment commercial and consumer loan portfolio results are included in continuing operations. (6) During the fourth quarter 2007, the Company completed the sale of its interest in a relationship agreement to develop and market consumer credit products in the Spanish Market and recorded a gain related to this sale of approximately $30 million in non-interest income. (7) In Q1 2008 the Company recorded a gain of $109.0 million in non-interest income from the redemption of 2.5 million shares related to the Visa IPO. (8) In Q1 2008 the Company repurchased approximately $1.0 billion of certain senior unsecured debt, recognizing a gain of $52.0 million in non-interest income. The Company initiated the repurchases to take advantage of the current rate environment and replaced the borrowings with lower-rate unsecured funding. (9) In Q1 2008 the Company recorded a pre-tax expense of $104.2 million in discontinued operations to cover expected future claims made under representations and warranties provided by the Company on loans previously sold to third parties by GreenPoint's mortgage origination operation. See also note (5) above. (10) In Q2 2008 the Company elected to convert and sell 154,991 shares of MasterCard class B common stock. The Company recognized gains of $44.9 million in non-interest income from this transaction. (11) The Q3 2008 TCE ratio reflects the issuance of 15,527,000 shares on September 30, 2008 at $49 per share. (12) In Q4 2008 the Company recorded impairment of goodwill in its Auto Finance sub-segment of $810.9 million. (13) Excludes the impact of the goodwill impairment of $810.9 million. (14) Average equity includes the impact of the Company's participation in the U.S. Treasury's Capital Purchase Program. The Company issued 3,555,199 preferred shares and 12,657,960 warrants to purchase common shares, while receiving proceeds of $3.56 billion. The allocated fair value for the preferred shares and the warrants to purchase common shares was $3.06 billion and $491.5 million, respectively. The warrants to purchase common shares are included in paid-in capital on the balance sheet. STATISTICS / METRIC DEFINITIONS (A) Based on continuing operations. Average equity and return on equity are based on the Company's stockholders' equity. (B) Risk adjusted margin equals total revenue less net charge-offs as a percentage of average earning assets. (C) Efficiency ratio equals non-interest expense less restructuring expense divided by total revenue. (D) Tangible assets include managed assets less intangible assets. (E) Includes stockholders' equity less preferred shares less intangible assets and related deferred tax liabilities. Tangible Common Equity on a reported and managed basis is the same. (F) Net income (loss) available to common shareholders equals net income (loss) less dividends on preferred shares. (G) Earnings per share is based on net income (loss) available to common shareholders.
  • 4. CAPITAL ONE FINANCIAL CORPORATION (COF) SEGMENT FINANCIAL & STATISTICAL SUMMARY FOR CONTINUING OPERATIONS MANAGED BASIS (1) 2008 2008 2008 2008 2007 Q4 (6) Q4 Q3 Q2 Q1 (in thousands) Local Banking: Interest Income $ 1,512,139 $ 1,519,217 $ 1,489,612 $ 1,575,325 $ 1,707,377 Interest Expense 869,723 895,481 899,907 1,008,371 1,122,841 Net interest income $ 642,416 $ 623,736 $ 589,705 $ 566,954 $ 584,536 Non-interest income 189,814 215,701 192,758 215,469 206,002 Provision for loan losses 214,154 81,052 92,043 60,394 42,665 Other non-interest expenses 628,110 622,697 587,211 605,351 589,943 Income tax provision (3,512) 47,491 36,123 40,837 54,328 Net income (loss) $ (6,522) $ 88,197 $ 67,086 $ 75,841 $ 103,602 Loans Held for Investment $ 45,082,981 $ 44,662,818 $ 44,270,734 $ 44,197,085 $ 43,972,795 Average Loans Held for Investment $ 44,810,117 $ 44,319,475 $ 44,250,451 $ 43,887,387 $ 43,128,767 Core Deposits(2) $ 67,546,102 $ 64,386,336 $ 63,407,571 $ 62,811,696 $ 62,977,637 Total Deposits $ 78,938,391 $ 75,045,812 $ 74,245,677 $ 73,387,227 $ 73,089,284 Loans Held for Investment Yield 6.08% 6.25% 6.35% 6.75% 7.02% Net Interest Margin - Loans (3) 2.11% 1.98% 1.99% 1.92% 1.87% Net Interest Margin - Deposits (4) 2.12% 2.18% 2.04% 1.93% 2.05% Efficiency Ratio (5) 75.47% 74.18% 75.05% 77.37% 74.63% Net charge-off rate 0.90% 0.46% 0.34% 0.31% 0.29% Non Performing Loans $ 565,791 $ 430,211 $ 359,017 $ 249,055 $ 178,385 Foreclosed Assets 63,970 41,290 29,607 24,790 14,058 Non Performing Assets (9) $ 629,761 $ 471,501 $ 388,624 $ 273,845 $ 192,443 Non Performing Loans as a % of Loans Held for Investment 1.25% 0.96% 0.81% 0.56% 0.41% Non Performing Asset Rate (9) 1.40% 1.06% 0.88% 0.62% 0.44% Non-Interest Expenses as a % of Average Loans Held for Investment 5.61% 5.62% 5.31% 5.52% 5.47% Number of Active ATMs 1,311 1,310 1,303 1,297 1,288 Number of Locations 738 739 740 745 742 National Lending (8) : Interest Income $ 3,104,769 $ 3,251,446 $ 3,181,773 $ 3,530,017 $ 3,670,404 Interest Expense 921,542 1,019,911 1,014,244 1,121,434 1,231,978 Net interest income $ 2,183,227 $ 2,231,535 $ 2,167,529 $ 2,408,583 $ 2,438,426 Non-interest income 1,151,066 1,195,622 1,164,810 1,226,114 1,370,655 Provision for loan losses 2,602,101 1,678,513 1,470,642 1,677,220 1,777,327 (10) Goodwill impairment charge 810,876 - - - - Other non-interest expenses 1,201,764 1,176,396 1,236,567 1,279,171 1,361,709 Income tax provision (169,060) 200,626 217,496 236,203 229,084 Net income (loss) $ (1,111,388) $ 371,622 $ 407,634 $ 442,103 $ 440,961 Loans Held for Investment $ 101,147,134 $ 101,922,850 $ 102,201,802 $ 103,003,402 $ 106,508,443 Average Loans Held for Investment $ 101,038,849 $ 102,142,752 $ 102,629,246 $ 104,973,633 $ 104,321,485 Core Deposits(2) $ 2,219 $ 2,171 $ 1,954 $ 2,171 $ 1,599 Total Deposits $ 1,459,131 $ 1,650,507 $ 1,644,241 $ 1,774,690 $ 2,050,861 Loans Held for Investment Yield 12.29% 12.73% 12.40% 13.45% 14.07% Net Interest Margin 8.64% 8.74% 8.45% 9.18% 9.35% Revenue Margin 13.20% 13.42% 12.99% 13.85% 14.61% Risk Adjusted Margin 6.54% 7.57% 7.31% 8.51% 9.88% (11) Non-Interest Expenses as a % of Average Loans Held for Investment 4.76% 4.61% 4.82% 4.87% 5.22% Efficiency Ratio (5) (11) 36.04% 34.33% 37.11% 35.19% 35.75% Net charge-off rate 6.66% 5.85% 5.67% 5.34% 4.73% Delinquency Rate (30+ days) 5.93% 5.43% 4.87% 4.73% 5.17% Number of Loan Accounts (000s) 44,816 45,314 45,812 48,065 48,537 Other: Net interest income $ (57,763) $ 34,059 $ 30,761 $ 1,313 $ (22,449) Non-interest income (157,700) (85,764) (55,594) 165,102 (10,425) Provision for loan losses 63,043 45,705 6,342 56,598 120,376 Restructuring expenses 52,839 15,306 13,560 52,759 27,809 Other non-interest expenses 64,354 (4,193) (17,737) (115,004) 155,746 Income tax provision (benefit) (117,284) (34,493) (14,776) 57,451 (113,854) Net income (loss) $ (278,415) $ (74,030) $ (12,222) $ 114,611 $ (222,951) Loans Held for Investment $ 706,639 $ 760,078 $ 774,724 $ 836,041 $ 881,179 Core Deposits(2) $ 27,067,784 $ 20,800,890 $ 14,800,701 $ 10,729,004 $ 6,107,779 Total Deposits $ 28,223,267 $ 22,216,655 $ 16,517,143 $ 12,533,025 $ 7,621,031 Total: Interest Income $ 4,205,821 $ 4,346,261 $ 4,270,572 $ 4,628,257 $ 4,863,246 Interest Expense 1,437,941 1,456,931 1,482,577 1,651,407 1,862,733 Net interest income $ 2,767,880 $ 2,889,330 $ 2,787,995 $ 2,976,850 $ 3,000,513 Non-interest income 1,183,180 1,325,559 1,301,974 1,606,685 1,566,232 Provision for loan losses 2,879,298 1,805,270 1,569,027 1,794,212 1,940,368 Restructuring expenses 52,839 15,306 13,560 52,759 27,809 Goodwill impairment charge 810,876 - - - - Other non-interest expenses 1,894,228 1,794,900 1,806,041 1,769,518 2,107,398 Income tax provision (289,856) 213,624 238,843 334,491 169,558 Net income (loss) $ (1,396,325) $ 385,789 $ 462,498 $ 632,555 $ 321,612 Loans Held for Investment $ 146,936,754 $ 147,345,746 $ 147,247,260 $ 148,036,528 $ 151,362,417 Core Deposits(2) $ 94,616,105 $ 85,189,397 $ 78,210,226 $ 73,542,871 $ 69,087,015 Total Deposits $ 108,620,789 $ 98,912,974 $ 92,407,061 $ 87,694,942 $ 82,761,176
  • 5. CAPITAL ONE FINANCIAL CORPORATION (COF) LOCAL BANKING SEGMENT FINANCIAL & STATISTICAL INFORMATION 2008 2008 2008 2008 2007 Q4 Q3 Q2 Q1 Q4 (in thousands) Loans Held for Investment: Commercial Lending Commercial and Multi-Family Real Estate $ 13,382,909 $ 13,043,369 $ 12,948,037 $ 12,655,900 $ 12,414,263 Middle Market 10,081,823 9,768,420 8,923,233 8,695,171 8,288,476 Small Ticket Commercial Real Estate 2,609,123 2,695,570 2,746,931 2,840,594 2,948,402 Specialty Lending 3,547,287 3,634,212 3,693,532 3,546,200 3,396,100 Total Commercial Lending $ 29,621,142 $ 29,141,571 $ 28,311,733 $ 27,737,865 $ 27,047,241 Small Business Lending $ 4,747,783 $ 4,580,299 $ 4,555,432 $ 4,588,500 $ 4,612,500 Consumer Lending Mortgages $ 7,187,805 $ 7,402,290 $ 7,803,032 $ 8,214,624 $ 8,513,216 Branch Based Home Equity & Other Consumer 3,773,397 3,782,342 3,887,936 3,938,849 4,095,228 Total Consumer Lending $ 10,961,202 $ 11,184,632 $ 11,690,968 $ 12,153,473 $ 12,608,444 Other $ (247,146) $ (243,684) $ (287,399) $ (282,753) $ (295,390) Total Loans Held for Investment $ 45,082,981 $ 44,662,818 $ 44,270,734 $ 44,197,085 $ 43,972,795 Non Performing Asset Rates (9): Commercial Lending Commercial and Multi-Family Real Estate 1.20% 1.06% 0.87% 0.46% 0.24% Middle Market 0.43% 0.26% 0.31% 0.42% 0.41% Small Ticket Commercial Real Estate 6.67% 4.49% 2.74% 1.62% 0.54% Specialty Lending 1.05% 0.38% 0.25% 0.18% 0.18% Total Commercial Lending 1.40% 1.03% 0.79% 0.53% 0.32% Small Business Lending 1.79% 1.14% 1.17% 1.00% 1.06% Consumer Lending Mortgages 1.55% 1.41% 1.22% 0.81% 0.54% Branch Based Home Equity & Other Consumer 0.46% 0.40% 0.39% 0.35% 0.30% Total Consumer Lending 1.18% 1.07% 0.95% 0.66% 0.46% Total Non Performing Asset Rate 1.40% 1.06% 0.88% 0.62% 0.44% Net Charge Off Rates: Commercial Lending Commercial and Multi-Family Real Estate 1.15% 0.14% 0.10% 0.02% 0.02% Middle Market 0.48% 0.15% 0.05% 0.15% 0.12% Small Ticket Commercial Real Estate 0.90% 0.10% (0.03)% 0.30% 0.21% Specialty Lending 0.47% 0.26% 0.16% 0.05% 0.15% Total Commercial Lending 0.82% 0.16% 0.08% 0.09% 0.09% Small Business Lending 1.12% 1.17% 0.91% 0.97% 0.63% Consumer Lending Mortgages 0.48% 0.50% 0.35% 0.11% 0.19% Branch Based Home Equity & Other Consumer 1.34% 1.01% 1.02% 1.21% 1.04% Total Consumer Lending 0.78% 0.67% 0.57% 0.46% 0.46% Total Net Charge Off Rate 0.90% 0.46% 0.34% 0.31% 0.29%
  • 6. CAPITAL ONE FINANCIAL CORPORATION (COF) NATIONAL LENDING SUB-SEGMENT FINANCIAL & STATISTICAL SUMMARY FOR CONTINUING OPERATIONS MANAGED BASIS (1), (8) 2008 2008 2008 2008 2007 Q4 (6) Q4 Q3 Q2 Q1 (in thousands) US Card: Interest Income $ 2,179,456 $ 2,240,896 $ 2,132,284 $ 2,433,665 $ 2,548,929 Interest Expense 570,751 624,858 608,655 689,951 780,985 Net interest income $ 1,608,705 $ 1,616,038 $ 1,523,629 $ 1,743,714 $ 1,767,944 Non-interest income 1,018,689 1,027,918 1,010,177 1,070,831 1,163,795 Provision for loan losses 2,000,928 1,240,580 1,099,453 1,120,025 1,195,469 Non-interest expenses 896,572 872,588 910,619 938,860 976,118 Income tax provision (94,537) 185,775 183,307 264,481 261,492 Net income (loss) $ (175,569) $ 345,013 $ 340,427 $ 491,179 $ 498,660 Loans Held for Investment $ 70,944,581 $ 69,361,743 $ 68,059,998 $ 67,382,004 $ 69,723,169 Average Loans Held for Investment $ 69,643,290 $ 68,581,983 $ 67,762,384 $ 68,544,190 $ 67,727,632 Loans Held for Investment Yield 12.52% 13.07% 12.59% 14.20% 15.05% Net Interest Margin 9.24% 9.43% 8.99% 10.18% 10.44% Revenue Margin 15.09% 15.42% 14.96% 16.42% 17.31% Risk Adjusted Margin 8.01% 9.29% 8.70% 10.58% 12.47% Non-Interest Expenses as a % of Average Loans Held for Investment 5.15% 5.09% 5.38% 5.48% 5.76% (5) Efficiency Ratio 34.12% 33.00% 35.94% 33.36% 33.29% Net charge-off rate 7.08% 6.13% 6.26% 5.85% 4.84% Delinquency Rate (30+ days) 4.78% 4.20% 3.85% 4.04% 4.28% (7) Purchase Volume $ 25,217,781 $ 26,536,070 $ 26,738,213 $ 24,543,082 $ 28,230,725 Number of Loan Accounts (000s) 37,436 37,916 38,415 40,611 41,044 Auto Finance: Interest Income $ 622,244 $ 635,305 $ 666,499 $ 690,919 $ 687,389 Interest Expense 255,501 265,804 276,911 289,357 300,133 Net interest income $ 366,743 $ 369,501 $ 389,588 $ 401,562 $ 387,256 Non-interest income 12,846 14,607 15,672 16,110 14,888 Provision for loan losses 437,572 244,078 230,614 408,251 429,247 (10) Goodwill impairment charge 810,876 - - - - Non-interest expenses 127,075 117,677 123,021 136,169 144,301 Income tax (benefit) provision (71,290) 7,824 18,069 (44,362) (58,963) Net income (loss) $ (924,644) $ 14,529 $ 33,556 $ (82,386) $ (112,441) Loans Held for Investment $ 21,481,911 $ 22,306,394 $ 23,401,160 $ 24,633,665 $ 25,128,352 Average Loans Held for Investment $ 21,954,587 $ 22,857,540 $ 24,098,881 $ 25,047,501 $ 24,920,380 Loans Held for Investment Yield 11.34% 11.12% 11.06% 11.03% 11.03% Net Interest Margin 6.68% 6.47% 6.47% 6.41% 6.22% Revenue Margin 6.92% 6.72% 6.73% 6.67% 6.45% Risk Adjusted Margin 1.24% 1.73% 2.88% 2.69% 2.46% (11) Non-Interest Expenses as a % of Average Loans Held for Investment 2.32% 2.06% 2.04% 2.17% 2.32% (5) (11) Efficiency Ratio 33.48% 30.64% 30.36% 32.60% 35.88% Net charge-off rate 5.67% 5.00% 3.84% 3.98% 4.00% Delinquency Rate (30+ days) 9.91% 9.32% 7.62% 6.42% 7.84% Auto Loan Originations $ 1,476,136 $ 1,444,291 $ 1,513,686 $ 2,440,227 $ 3,623,491 Number of Loan Accounts (000s) 1,634 1,665 1,710 1,763 1,771 International: Interest Income $ 303,069 $ 375,245 $ 382,990 $ 405,433 $ 434,086 Interest Expense 95,290 129,249 128,678 142,126 150,860 Net interest income $ 207,779 $ 245,996 $ 254,312 $ 263,307 $ 283,226 Non-interest income 119,531 153,097 138,961 139,173 191,972 Provision for loan losses 163,601 193,855 140,575 148,944 152,611 Non-interest expenses 178,117 186,131 202,927 204,142 241,290 Income tax provision (3,233) 7,027 16,120 16,084 26,555 Net income (loss) $ (11,175) $ 12,080 $ 33,651 $ 33,310 $ 54,742 Loans Held for Investment $ 8,720,642 $ 10,254,713 $ 10,740,644 $ 10,987,733 $ 11,656,922 Average Loans Held for Investment $ 9,440,972 $ 10,703,229 $ 10,767,981 $ 11,381,942 $ 11,673,473 Loans Held for Investment Yield 12.84% 14.02% 14.23% 14.25% 14.87% Net Interest Margin 8.80% 9.19% 9.45% 9.25% 9.70% Revenue Margin 13.87% 14.91% 14.61% 14.14% 16.28% Risk Adjusted Margin 8.02% 9.01% 8.54% 8.84% 10.67% Non-Interest Expenses as a % of Average Loans Held for Investment 7.55% 6.96% 7.54% 7.17% 8.27% (5) Efficiency Ratio 54.42% 46.64% 51.60% 50.72% 50.78% Net charge-off rate 5.84% 5.90% 6.07% 5.30% 5.61% Delinquency Rate (30+ days) 5.51% 5.24% 5.35% 5.12% 4.79% (7) Purchase Volume $ 2,346,969 $ 2,857,975 $ 2,879,223 $ 2,716,060 $ 2,966,350 Number of Loan Accounts (000s) 5,747 5,733 5,687 5,691 5,722
  • 7. CAPITAL ONE FINANCIAL CORPORATION (COF) SEGMENT AND NATIONAL LENDING SUB-SEGMENT FINANCIAL & STATISTICAL SUMMARY FOR CONTINUING OPERATIONS NOTES (1) The information in this financial and statistical summary reflects the adjustment to add back the effect of securitization transactions qualifying as sales under generally accepted accounting principles. See accompanying schedule - quot;Reconciliation to GAAP Financial Measures.quot; In Q3 2007, the Company shutdown the mortgage origination operations of its wholesale mortgage banking unit, GreenPoint Mortgage. The results of the mortgage origination operation of GreenPoint have been accounted for as a discontinued operation and have been removed from the Company's results of continuing operations for all periods presented. The results of GreenPoint's mortgage servicing business are reported in continuing operations for all periods presented. Effective Q4 2007, GreenPoint's held for investment commercial and consumer loan portfolio results are included in continuing operations. (2) Includes domestic non-interest bearing deposits, NOW accounts, money market deposit accounts, savings accounts, certificates of deposit of less than $100,000 and other consumer time deposits. (3) Net Interest Margin - Loans equals net interest income earned on loans divided by average managed loans. (4) Net Interest Margin - Deposits equals net interest income earned on deposits divided by average deposits. (5) Efficiency Ratio equals non-interest expenses divided by total managed revenue. (6) Certain prior period amounts have been reclassified to conform with current period presentation. (7) Includes all purchase transactions net of returns and excludes cash advance transactions. (8) In Q1 2008 the Company reorganized its National Lending sub-segments from U.S. Card, Auto Finance and Global Financial Services to U.S. Card and Other National Lending. The U.S. Card sub-segment contains the results of the Company's domestic credit card business, small business lending and the installment loan business. The Other National Lending subsegment contains the results of the Company's auto finance business and the Company's international lending businesses. Components of the Other National Lending sub-segment are separately disclosed. Segment and sub-segment results have been restated for all periods presented. (9) Non performing assets is comprised of non performing loans and foreclosed assets. The non performing asset rate equals non performing assets divided by the sum of loans held for investment plus foreclosed assets. (10) In Q4 2008 the Company recorded impairment of goodwill in its Auto Finance sub-segment of $810.9 million. (11) Excludes the impact of the goodwill impairment of $810.9 million recorded in the Auto Finance component of National Lending.
  • 8. CAPITAL ONE FINANCIAL CORPORATION Reconciliation to GAAP Financial Measures For the Three Months Ended December 31, 2008 (dollars in thousands)(unaudited) The Company's consolidated financial statements prepared in accordance with generally accepted accounting principles (quot;GAAPquot;) are referred to as its quot;reportedquot; financial statements. Loans included in securitization transactions which qualified as sales under GAAP have been removed from the Company's quot;reportedquot; balance sheet. However, servicing fees, finance charges, and other fees, net of charge-offs, and interest paid to investors of securitizations are recognized as servicing and securitizations income on the quot;reportedquot; income statement. The Company's quot;managedquot; consolidated financial statements reflect adjustments made related to effects of securitization transactions qualifying as sales under GAAP. The Company generates earnings from its quot;managedquot; loan portfolio which includes both the on-balance sheet loans and off-balance sheet loans. The Company's quot;managedquot; income statement takes the components of the servicing and securitizations income generated from the securitized portfolio and distributes the revenue and expense to appropriate income statement line items from which it originated. For this reason the Company believes the quot;managedquot; consolidated financial statements and related managed metrics to be useful to stakeholders. Adjustments(1) Total Managed(2) Total Reported (3) Income Statement Measures Net interest income $ 1,802,397 $ 965,483 $ 2,767,880 Non-interest income 1,368,286 (185,106) 1,183,180 Total revenue 3,170,683 780,377 3,951,060 Provision for loan and lease losses 2,098,921 780,377 2,879,298 Net charge-offs $ 1,045,912 $ 780,377 $ 1,826,289 Balance Sheet Measures Loans held for investment $ 101,017,771 $ 45,918,983 $ 146,936,754 Total assets $ 165,980,505 $ 43,961,156 $ 209,941,661 Average loans held for investment $ 99,334,890 $ 47,251,262 $ 146,586,152 Average earning assets $ 137,818,202 $ 44,861,288 $ 182,679,490 Average total assets $ 162,035,538 $ 45,264,163 $ 207,299,701 Delinquencies $ 4,417,823 $ 2,178,400 $ 6,596,223 (1) Income statement adjustments reclassify the net of finance charges of $1,285.1 million, past-due fees of $200.1 million, other interest income of $(48.2) million and interest expense of $471.5 million; and net charge-offs of $780.4 million from non-interest income to net interest income and provision for loan and lease losses, respectively. (2) The managed loan portfolio does not include auto loans which have been sold in whole loan sale transactions where the Company has retained servicing rights. (3) Based on continuing operations.
  • 9. CAPITAL ONE FINANCIAL CORPORATION Consolidated Balance Sheets (in thousands)(unaudited) As of As of As of Dec 31 Sept 30 Dec 31 2008 2008 2007 Assets: Cash and due from banks $ 2,047,839 $ 3,511,558 $ 2,377,287 Federal funds sold and resale agreements 636,752 1,435,521 1,766,762 Interest-bearing deposits at other banks 4,806,752 673,662 677,360 Cash and cash equivalents 7,491,343 5,620,741 4,821,409 Securities available for sale 31,003,271 26,969,471 19,781,587 Mortgage loans held for sale 68,462 98,900 315,863 Loans held for investment 101,017,771 97,965,351 101,805,027 Less: Allowance for loan and lease losses (4,523,960) (3,519,610) (2,963,000) Net loans held for investment 96,493,811 94,445,741 98,842,027 Accounts receivable from securitizations 6,342,754 4,980,823 4,717,879 Premises and equipment, net 2,313,106 2,305,286 2,299,603 Interest receivable 827,909 750,717 839,317 Goodwill 12,022,577 12,815,642 12,830,740 Other 9,417,272 6,815,792 6,141,944 Total assets $ 165,980,505 $ 154,803,113 $ 150,590,369 Liabilities: Non-interest-bearing deposits $ 11,293,852 $ 10,665,286 $ 11,046,549 Interest-bearing deposits 97,326,937 88,247,688 71,714,627 Senior and subordinated notes 8,308,843 8,278,856 10,712,706 Other borrowings 14,869,648 15,962,072 26,812,969 Interest payable 676,398 508,091 631,609 Other 6,892,394 5,529,580 5,377,797 Total liabilities 139,368,072 129,191,573 126,296,257 Stockholders' Equity: Preferred stock 3,096,466 - - Common stock 4,384 4,383 4,192 Paid-in capital, net 17,278,102 16,752,078 15,860,490 Retained earnings and cumulative other comprehensive income 9,399,368 12,020,490 11,582,816 Less: Treasury stock, at cost (3,165,887) (3,165,411) (3,153,386) Total stockholders' equity 26,612,433 25,611,540 24,294,112 Total liabilities and stockholders' equity $ 165,980,505 $ 154,803,113 $ 150,590,369
  • 10. CAPITAL ONE FINANCIAL CORPORATION Consolidated Statements of Income (in thousands, except per share data)(unaudited) Three Months Ended Year Ended Dec 31 Sept 30 Dec 31 Dec 31 Dec 31 2007 2008 2008 2008 2007 Interest Income: Loans held for investment, including past-due fees $ 2,306,796 $ 2,347,480 $ 2,536,779 $ 9,460,378 $ 9,500,128 Securities available for sale 367,902 317,274 256,364 1,224,012 950,972 Other 94,123 107,042 167,051 427,609 627,056 Total interest income 2,768,821 2,771,796 2,960,194 11,111,999 11,078,156 Interest Expense: Deposits 684,756 624,319 686,174 2,512,040 2,906,351 Senior and subordinated notes 92,519 96,568 159,878 444,854 577,128 Other borrowings 189,149 244,264 351,895 1,006,390 1,064,832 Total interest expense 966,424 965,151 1,197,947 3,963,284 4,548,311 Net interest income 1,802,397 1,806,645 1,762,247 7,148,715 6,529,845 Provision for loan and lease losses 2,098,921 1,093,917 1,294,210 5,101,040 2,636,502 Net interest income (loss) after provision for loan and lease losses (296,524) 712,728 468,037 2,047,675 3,893,343 Non-Interest Income: Servicing and securitizations 590,948 875,718 1,271,396 3,384,468 4,840,677 Service charges and other customer-related fees 557,331 576,762 573,034 2,232,363 2,057,854 Mortgage servicing and other 14,048 39,183 (5,700) 105,038 166,776 Interchange 129,409 148,076 152,595 562,117 500,484 Other 76,550 57,152 167,015 459,985 488,432 Total non-interest income 1,368,286 1,696,891 2,158,340 6,743,971 8,054,223 Non-Interest Expense: Salaries and associate benefits 574,199 571,686 622,101 2,335,737 2,592,534 Marketing 264,943 267,372 358,182 1,118,208 1,347,836 Communications and data processing 196,924 176,720 189,415 755,989 758,820 Supplies and equipment 130,038 126,781 146,267 519,687 531,238 Occupancy 112,492 96,483 91,675 377,192 322,510 Restructuring expense 52,839 15,306 27,809 134,464 138,237 Goodwill impairment charge 810,876 - - 810,876 - Other 615,632 555,858 699,758 2,157,874 2,386,835 Total non-interest expense 2,757,943 1,810,206 2,135,207 8,210,027 8,078,010 Income (loss) from continuing operations before Income taxes (1,686,181) 599,413 491,170 581,619 3,869,556 Income taxes (289,856) 213,624 169,558 497,102 1,277,837 Income (loss) from continuing operations, net of tax (1,396,325) 385,789 321,612 84,517 2,591,719 Loss from discontinued operations, net of tax (1) (25,221) (11,650) (95,044) (130,515) (1,021,387) Net income (loss) $ (1,421,546) $ 374,139 $ 226,568 $ (45,998) $ 1,570,332 Net income (loss) available to common shareholders $ (1,454,269) $ 374,139 $ 226,568 $ (78,721) $ 1,570,332 Basic earnings per common share Income (loss) from continuing operations $ (3.67) $ 1.03 $ 0.85 $ 0.14 $ 6.64 Loss from discontinued operations (0.07) (0.03) (0.25) (0.35) (2.62) Net Income (loss) per common share $ (3.74) $ 1.00 $ 0.60 $ (0.21) $ 4.02 Diluted earnings per common share Income (loss) from continuing operations $ (3.67) $ 1.03 $ 0.85 $ 0.14 $ 6.55 Loss from discontinued operations (0.07) (0.03) (0.25) (0.35) (2.58) Net Income (loss) per common share $ (3.74) $ 1.00 $ 0.60 $ (0.21) $ 3.97 Dividends paid per common share $ 0.375 $ 0.375 $ 0.03 $ 1.50 $ 0.11 (1) In Q3 2007, the Company shutdown the mortgage origination operations of its wholesale mortgage banking unit, GreenPoint Mortgage. The results of the mortgage origination operation of GreenPoint have been accounted for as a discontinued operation and have been removed from the Company's results of continuing operations for all periods presented.
  • 11. CAPITAL ONE FINANCIAL CORPORATION Statements of Average Balances, Income and Expense, Yields and Rates (1) (dollars in thousands)(unaudited) Quarter Ended 12/31/07 Reported Quarter Ended 12/31/08 Quarter Ended 9/30/08 Average Income/ Yield/ Average Income/ Yield/ Average Income/ Yield/ Balance Expense Rate Balance Expense Rate Balance Expense Rate Earning assets: Loans held for investment $ 99,334,890 $ 2,306,796 9.29% $ 98,778,393 $ 2,347,480 9.51% $ 97,784,813 $ 2,536,779 10.38% Securities available for sale 28,961,247 367,902 5.08% 25,780,669 317,274 4.92% 20,102,440 256,364 5.10% Other 9,502,781 94,123 3.96% 8,717,921 107,042 4.91% 9,355,161 167,051 7.14% Total earning assets $ 137,798,918 $ 2,768,821 8.04% $ 133,276,983 $ 2,771,796 8.32% $ 127,242,414 $ 2,960,194 9.31% Interest-bearing liabilities: Interest-bearing deposits NOW accounts $ 9,874,696 $ 28,460 1.15% $ 9,292,819 $ 30,263 1.30% $ 4,674,490 $ 30,443 2.61% Money market deposit accounts 28,556,264 171,891 2.41% 26,914,607 187,740 2.79% 28,745,701 270,943 3.77% Savings accounts 7,275,816 11,774 0.65% 7,759,024 16,243 0.84% 8,172,510 32,520 1.59% Other consumer time deposits 33,712,504 337,651 4.01% 26,733,531 262,101 3.92% 16,374,958 183,570 4.48% Public fund CD's of $100,000 or more 1,213,364 7,323 2.41% 1,305,438 8,233 2.52% 1,902,442 23,126 4.86% CD's of $100,000 or more 9,508,463 104,134 4.38% 9,084,740 89,192 3.93% 8,335,941 97,335 4.67% Foreign time deposits 3,002,402 23,523 3.13% 3,564,449 30,547 3.43% 3,868,444 48,237 4.99% Total interest-bearing deposits $ 93,143,509 $ 684,756 2.94% $ 84,654,608 $ 624,319 2.95% $ 72,074,486 $ 686,174 3.81% Senior and subordinated notes 8,034,423 92,519 4.61% 8,282,536 96,568 4.66% 10,682,635 159,878 5.99% Other borrowings 16,428,096 189,149 4.61% 22,368,976 244,264 4.37% 26,671,101 351,895 5.28% Total interest-bearing liabilities $ 117,606,028 $ 966,424 3.29% $ 115,306,120 $ 965,151 3.35% $ 109,428,222 $ 1,197,947 4.38% Net interest spread 4.75% 4.97% 4.93% Interest income to average earning assets 8.04% 8.32% 9.31% Interest expense to average earning assets 2.81% 2.90% 3.77% Net interest margin 5.23% 5.42% 5.54% (1) Average balances, income and expenses, yields and rates are based on continuing operations.
  • 12. CAPITAL ONE FINANCIAL CORPORATION Statements of Average Balances, Income and Expense, Yields and Rates (2) (dollars in thousands)(unaudited) (1) Managed Quarter Ended 12/31/08 Quarter Ended 9/30/08 Quarter Ended 12/31/07 Average Income/ Yield/ Average Income/ Yield/ Average Income/ Yield/ Balance Expense Rate Balance Expense Rate Balance Expense Rate Earning assets: Loans held for investment $ 146,586,152 $ 3,808,363 10.39% $ 147,247,398 $ 3,974,375 10.80% $ 148,362,338 $ 4,512,219 12.17% Securities available for sale 28,961,247 367,902 5.08% 25,780,669 317,274 4.92% 20,102,440 256,364 5.10% Other 7,112,807 29,558 1.66% 6,724,730 54,612 3.25% 7,186,892 94,663 5.27% Total earning assets $ 182,660,206 $ 4,205,823 9.21% $ 179,752,797 $ 4,346,261 9.67% $ 175,651,670 $ 4,863,246 11.07% Interest-bearing liabilities: Interest-bearing deposits NOW accounts $ 9,874,696 $ 28,460 1.15% $ 9,292,819 $ 30,263 1.30% $ 4,674,490 $ 30,443 2.61% Money market deposit accounts 28,556,264 171,891 2.41% 26,914,607 187,740 2.79% 28,745,701 270,943 3.77% Savings accounts 7,275,816 11,774 0.65% 7,759,024 16,243 0.84% 8,172,510 32,520 1.59% Other consumer time deposits 33,712,504 337,651 4.01% 26,733,531 262,101 3.92% 16,374,958 183,570 4.48% Public fund CD's of $100,000 or more 1,213,364 7,323 2.41% 1,305,438 8,233 2.52% 1,902,442 23,126 4.86% CD's of $100,000 or more 9,508,463 104,134 4.38% 9,084,740 89,192 3.93% 8,335,941 97,335 4.67% Foreign time deposits 3,002,402 23,523 3.13% 3,564,449 30,547 3.43% 3,868,444 48,237 4.99% Total interest-bearing deposits $ 93,143,509 $ 684,756 2.94% $ 84,654,608 $ 624,319 2.95% $ 72,074,486 $ 686,174 3.81% Senior and subordinated notes 8,034,423 92,519 4.61% 8,282,536 96,568 4.66% 10,682,635 159,878 5.99% Other borrowings 16,428,096 189,149 4.61% 22,368,976 244,264 4.37% 26,671,101 351,895 5.28% Securitization liability 45,610,272 471,517 4.14% 48,069,177 491,780 4.09% 49,847,555 664,786 5.33% Total interest-bearing liabilities $ 163,216,300 $ 1,437,941 3.52% $ 163,375,297 $ 1,456,931 3.57% $ 159,275,777 $ 1,862,733 4.68% Net interest spread 5.69% 6.10% 6.40% Interest income to average earning assets 9.21% 9.67% 11.07% Interest expense to average earning assets 3.15% 3.24% 4.24% Net interest margin 6.06% 6.43% 6.83% (1) The information in this table reflects the adjustment to add back the effect of securitized loans. (2) Average balances, income and expenses, yields and rates are based on continuing operations.