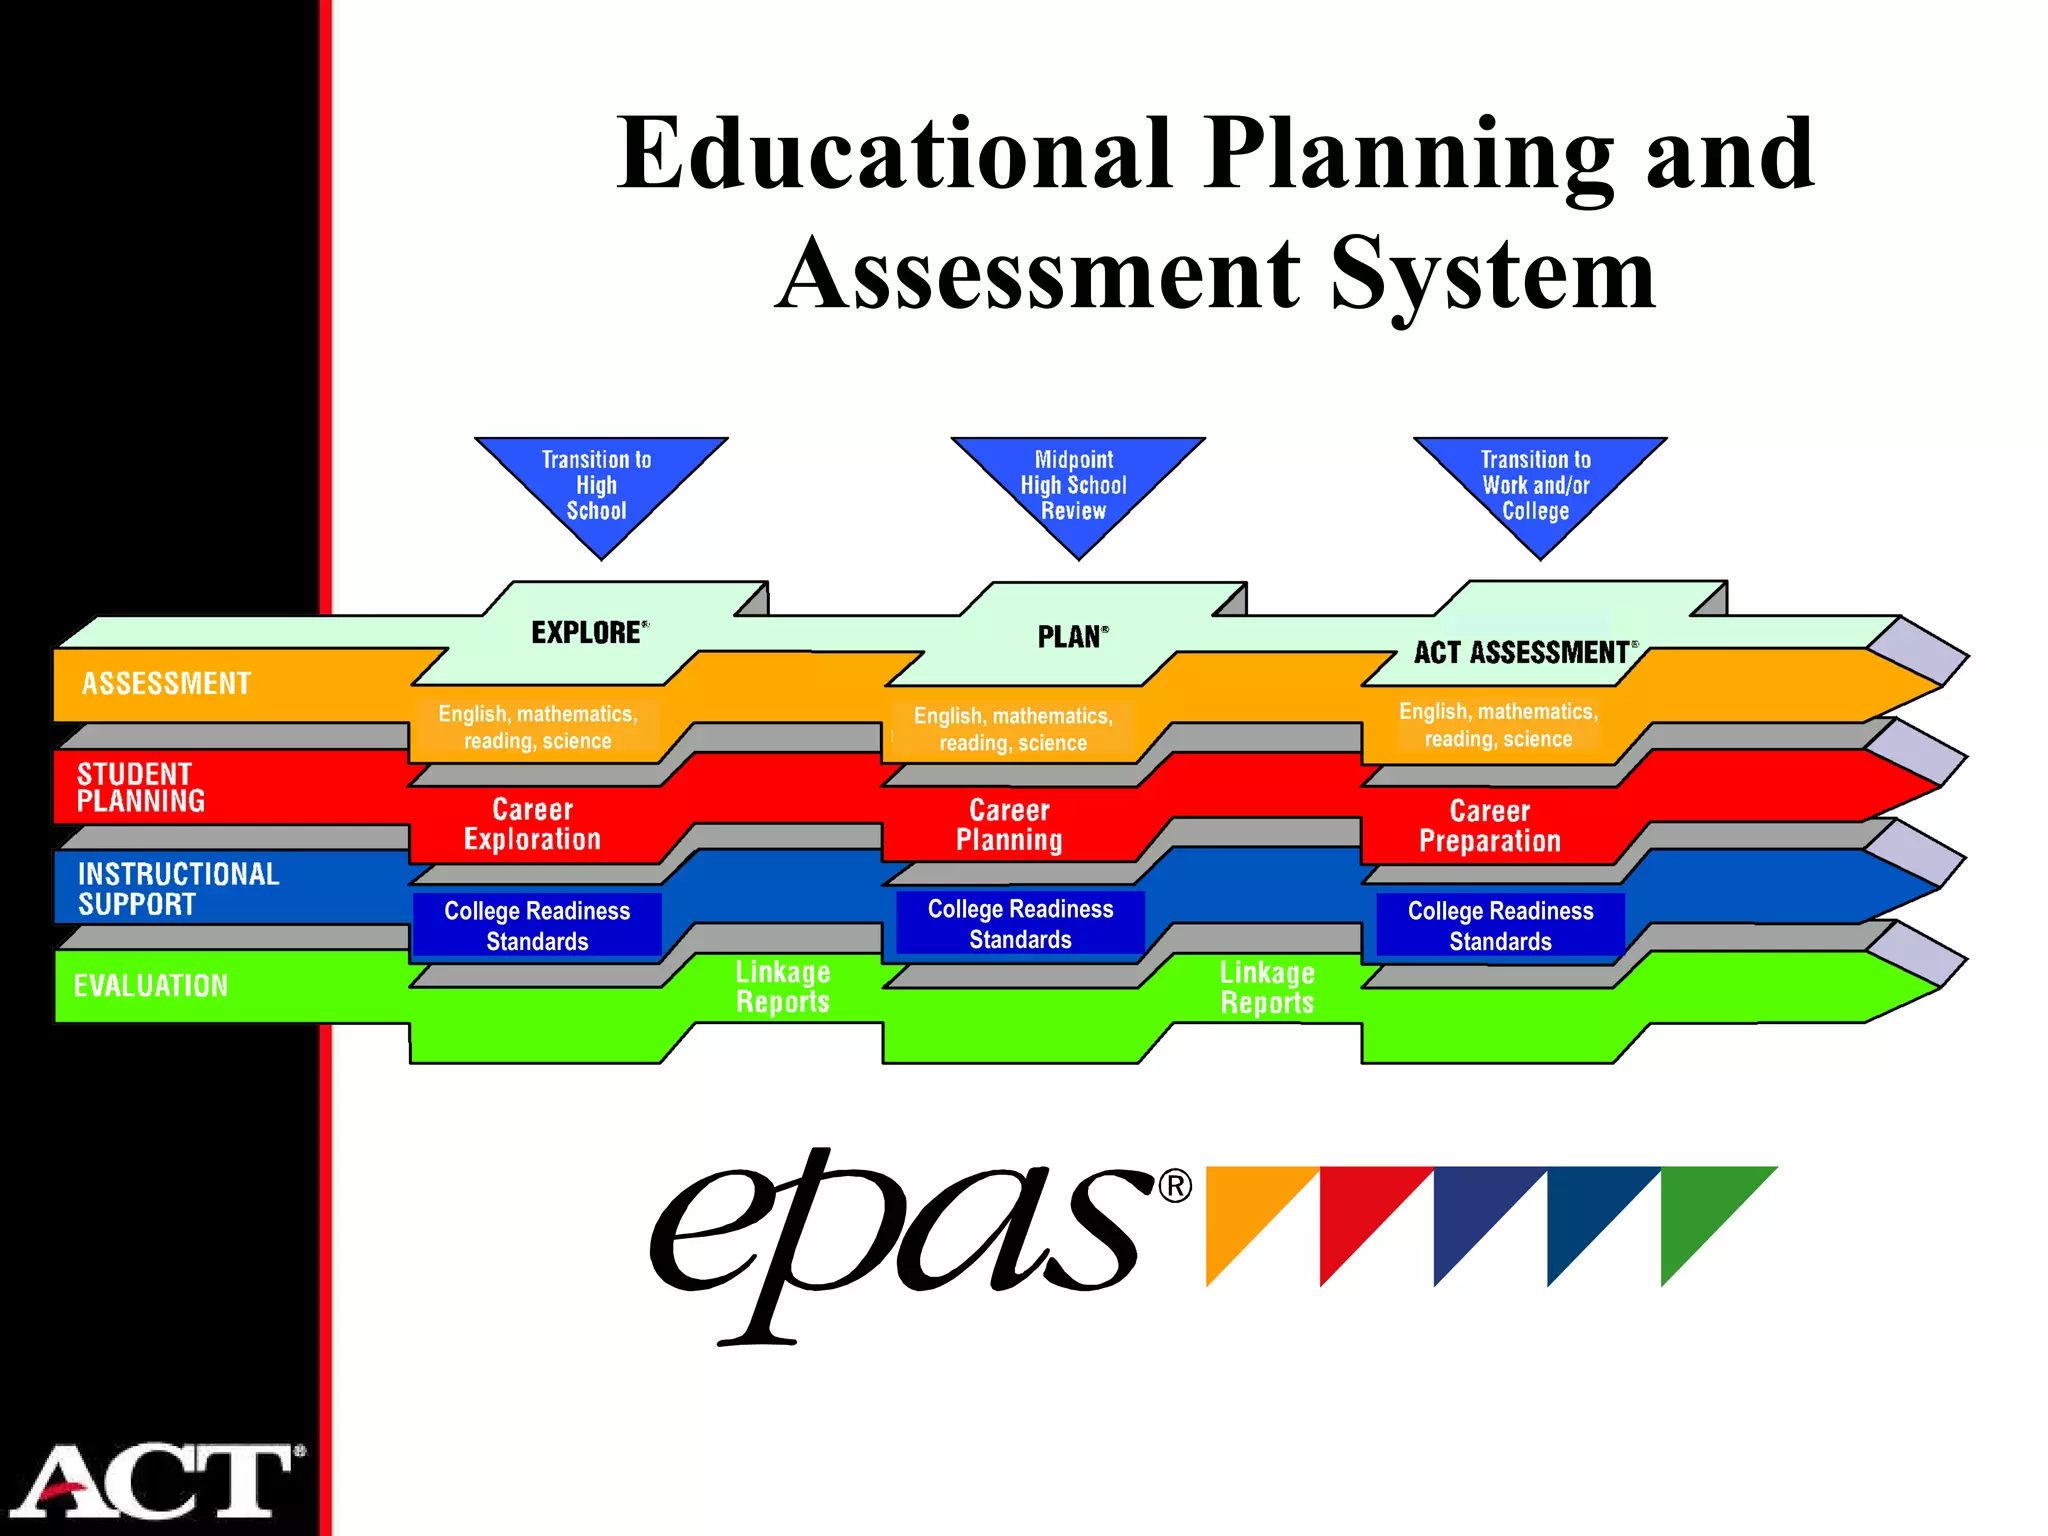
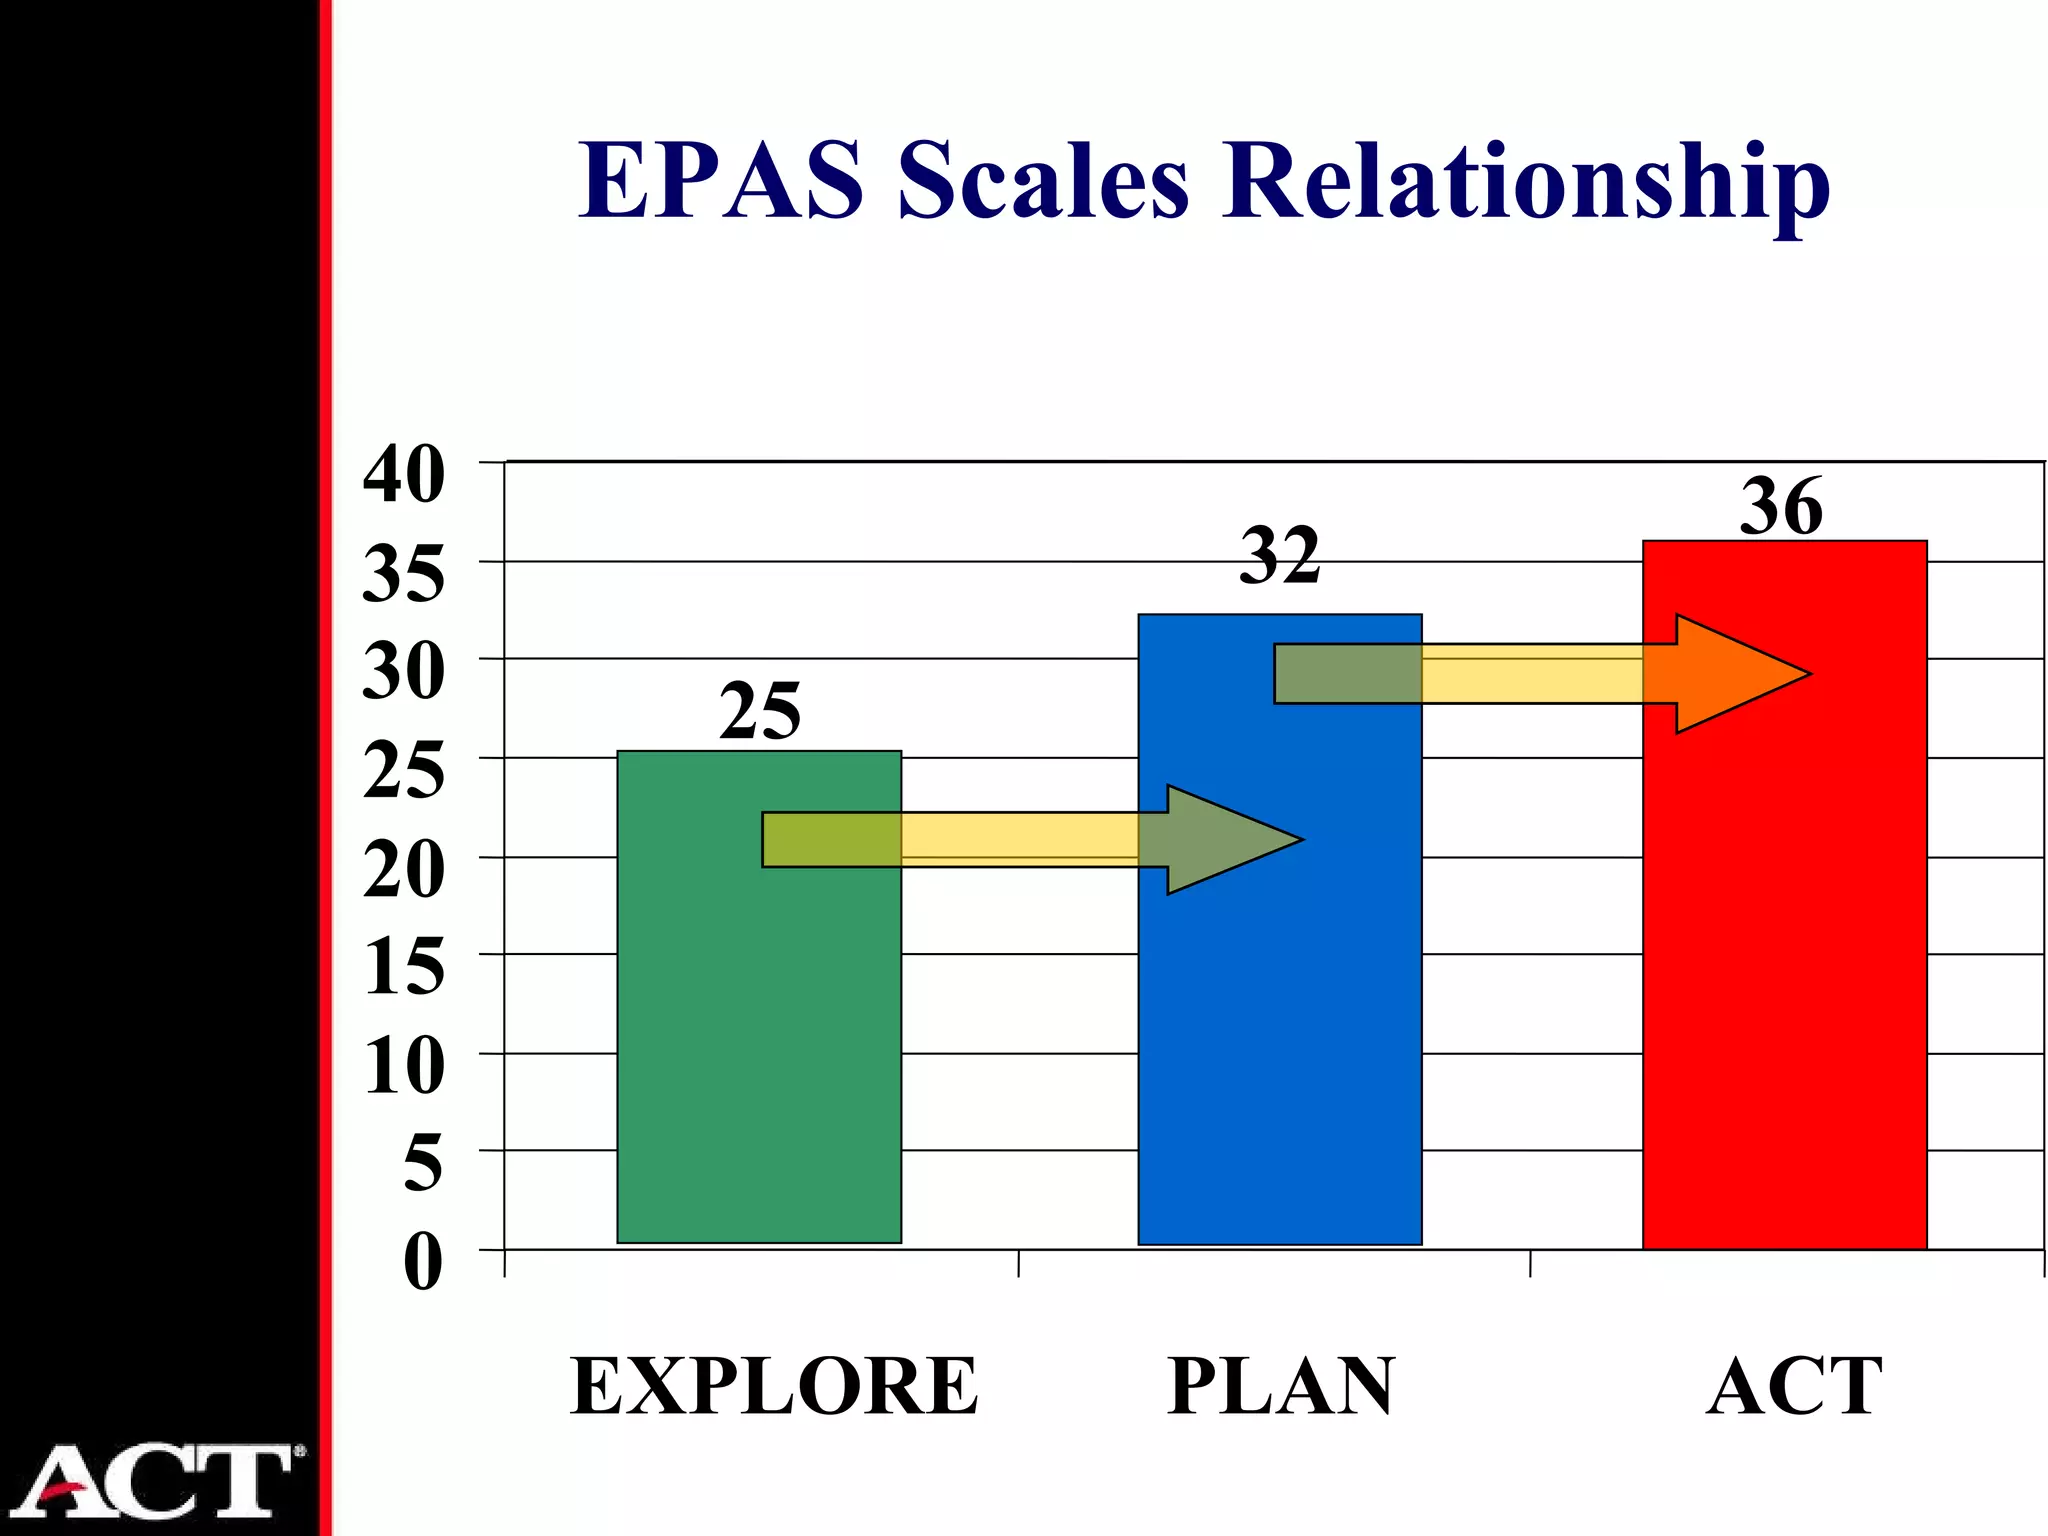
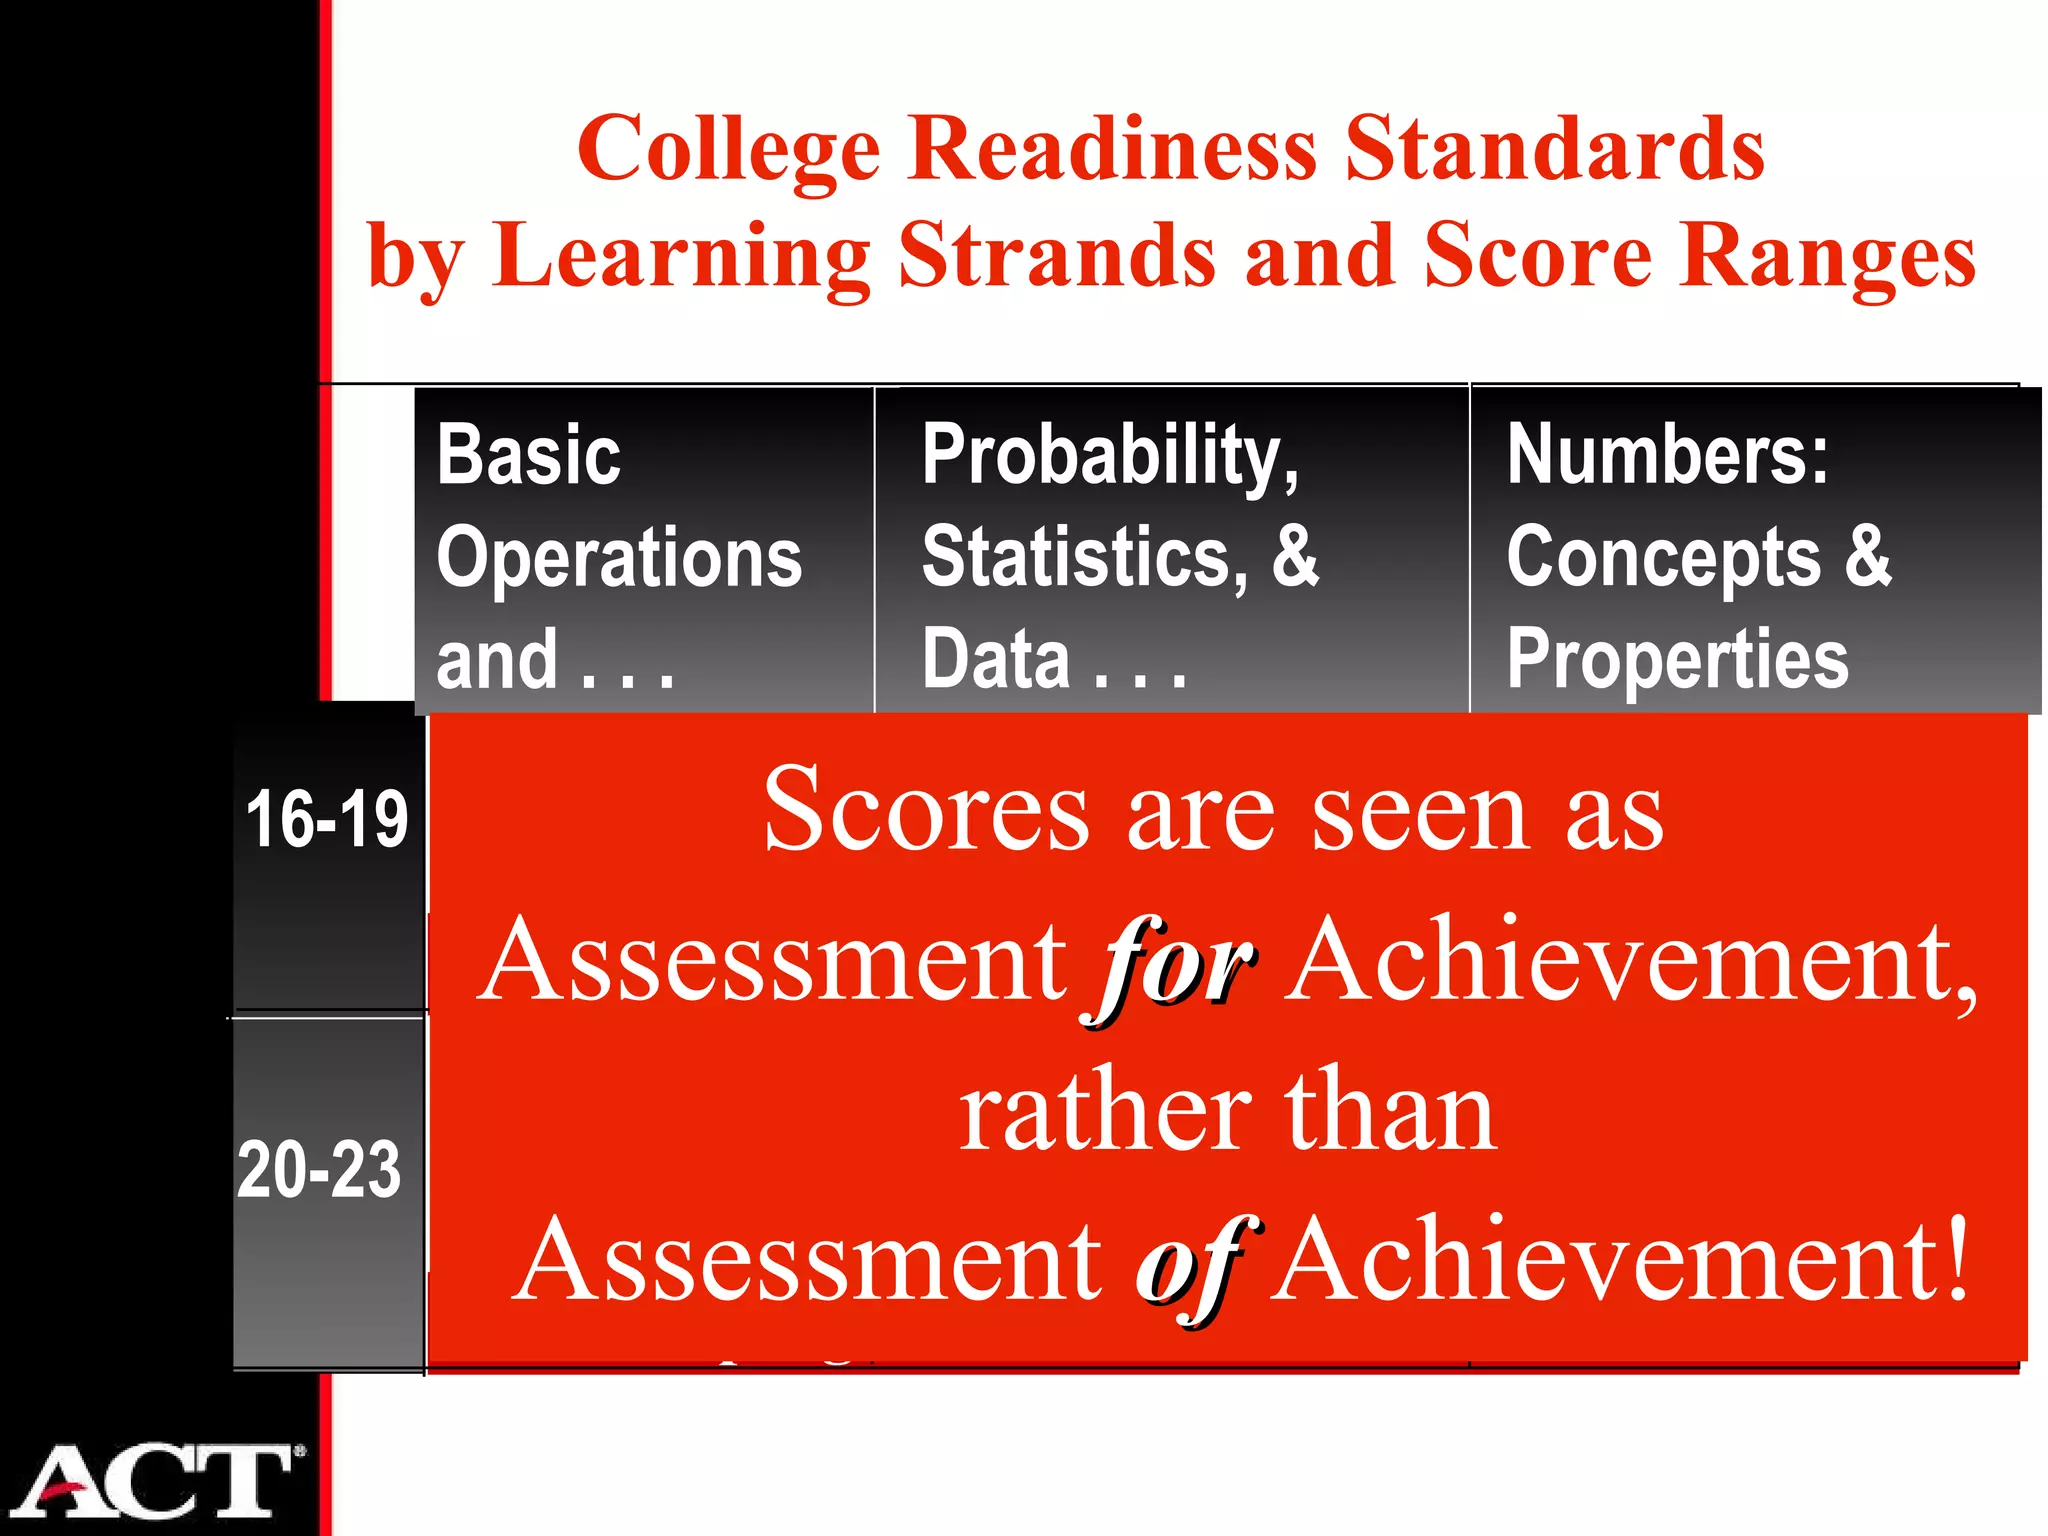
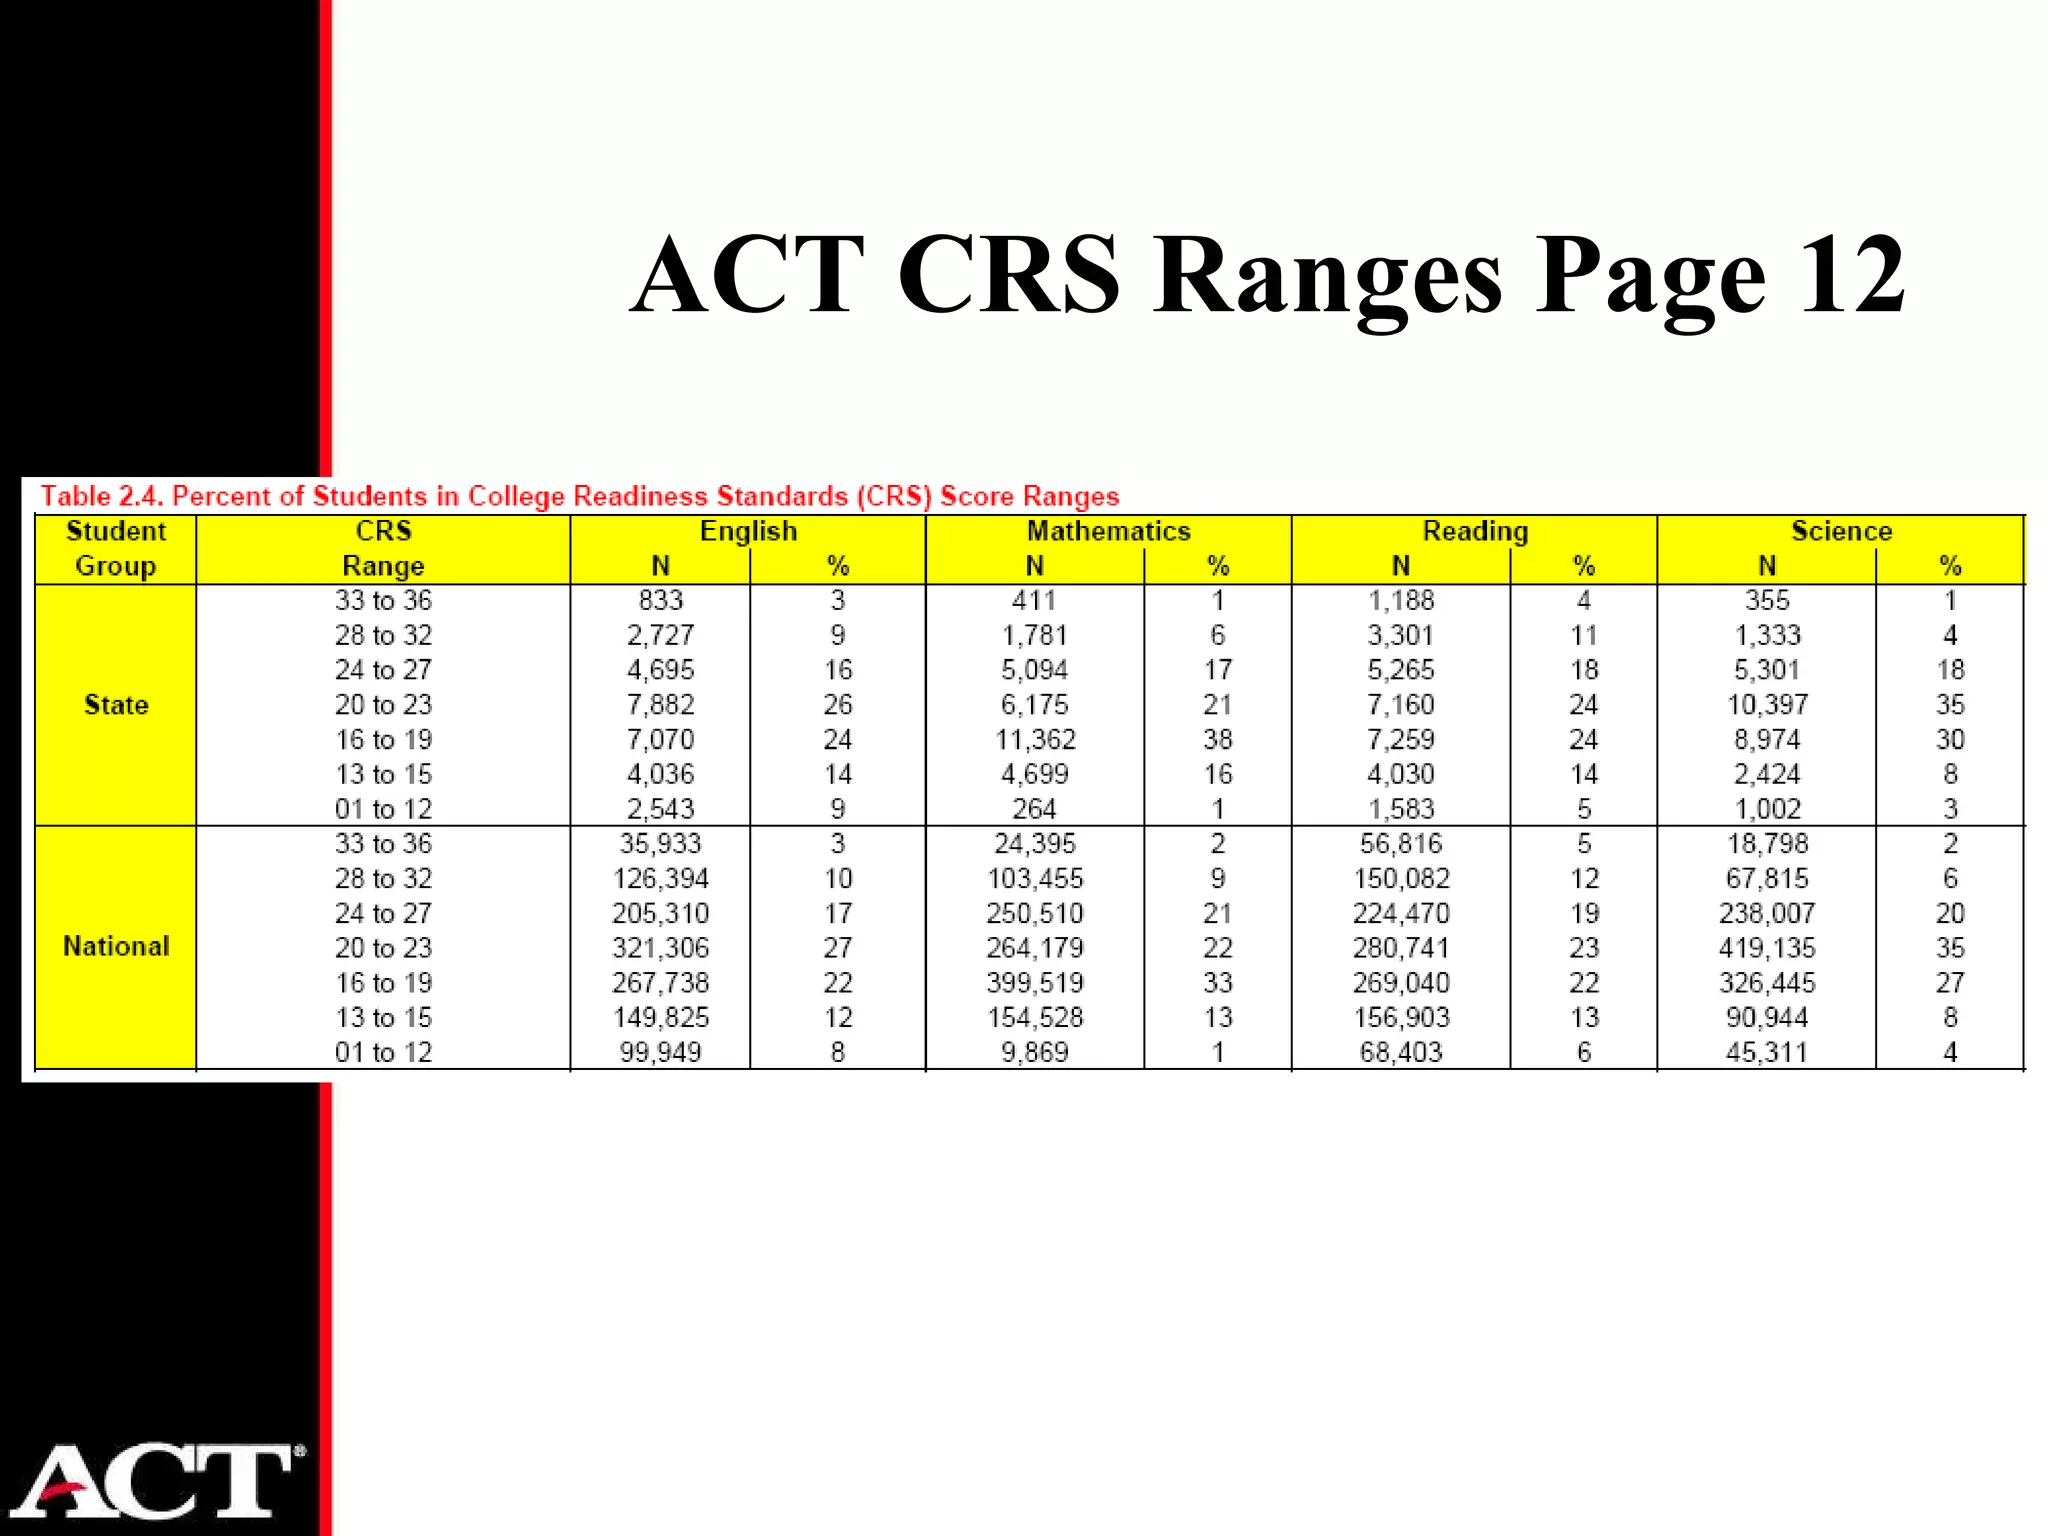
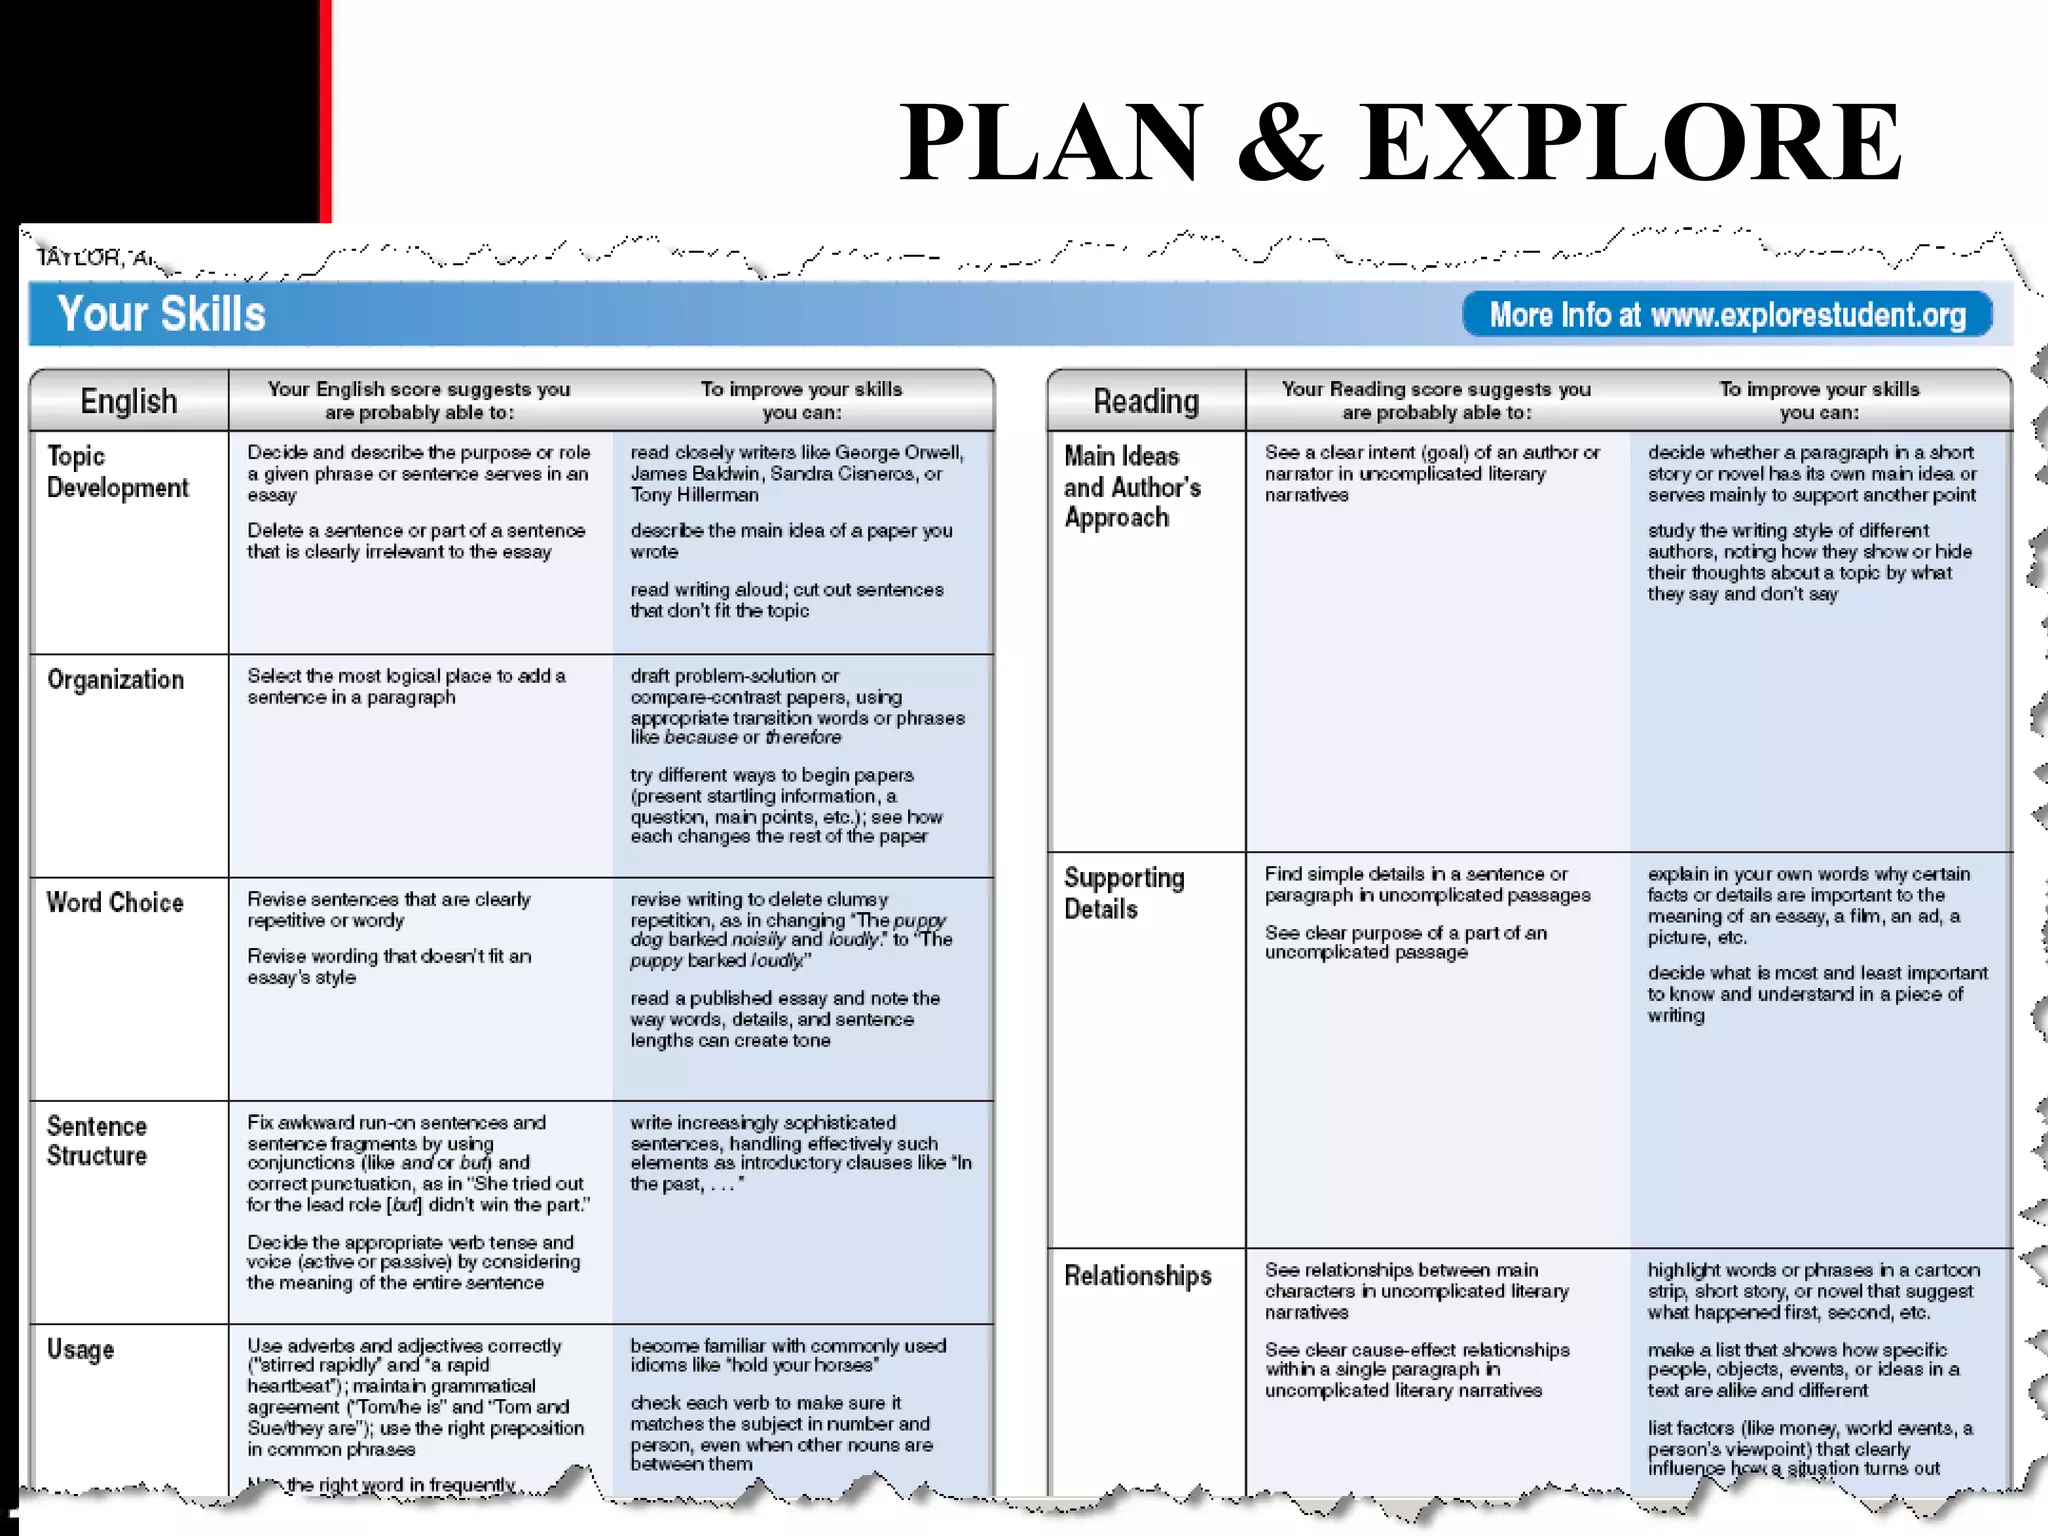
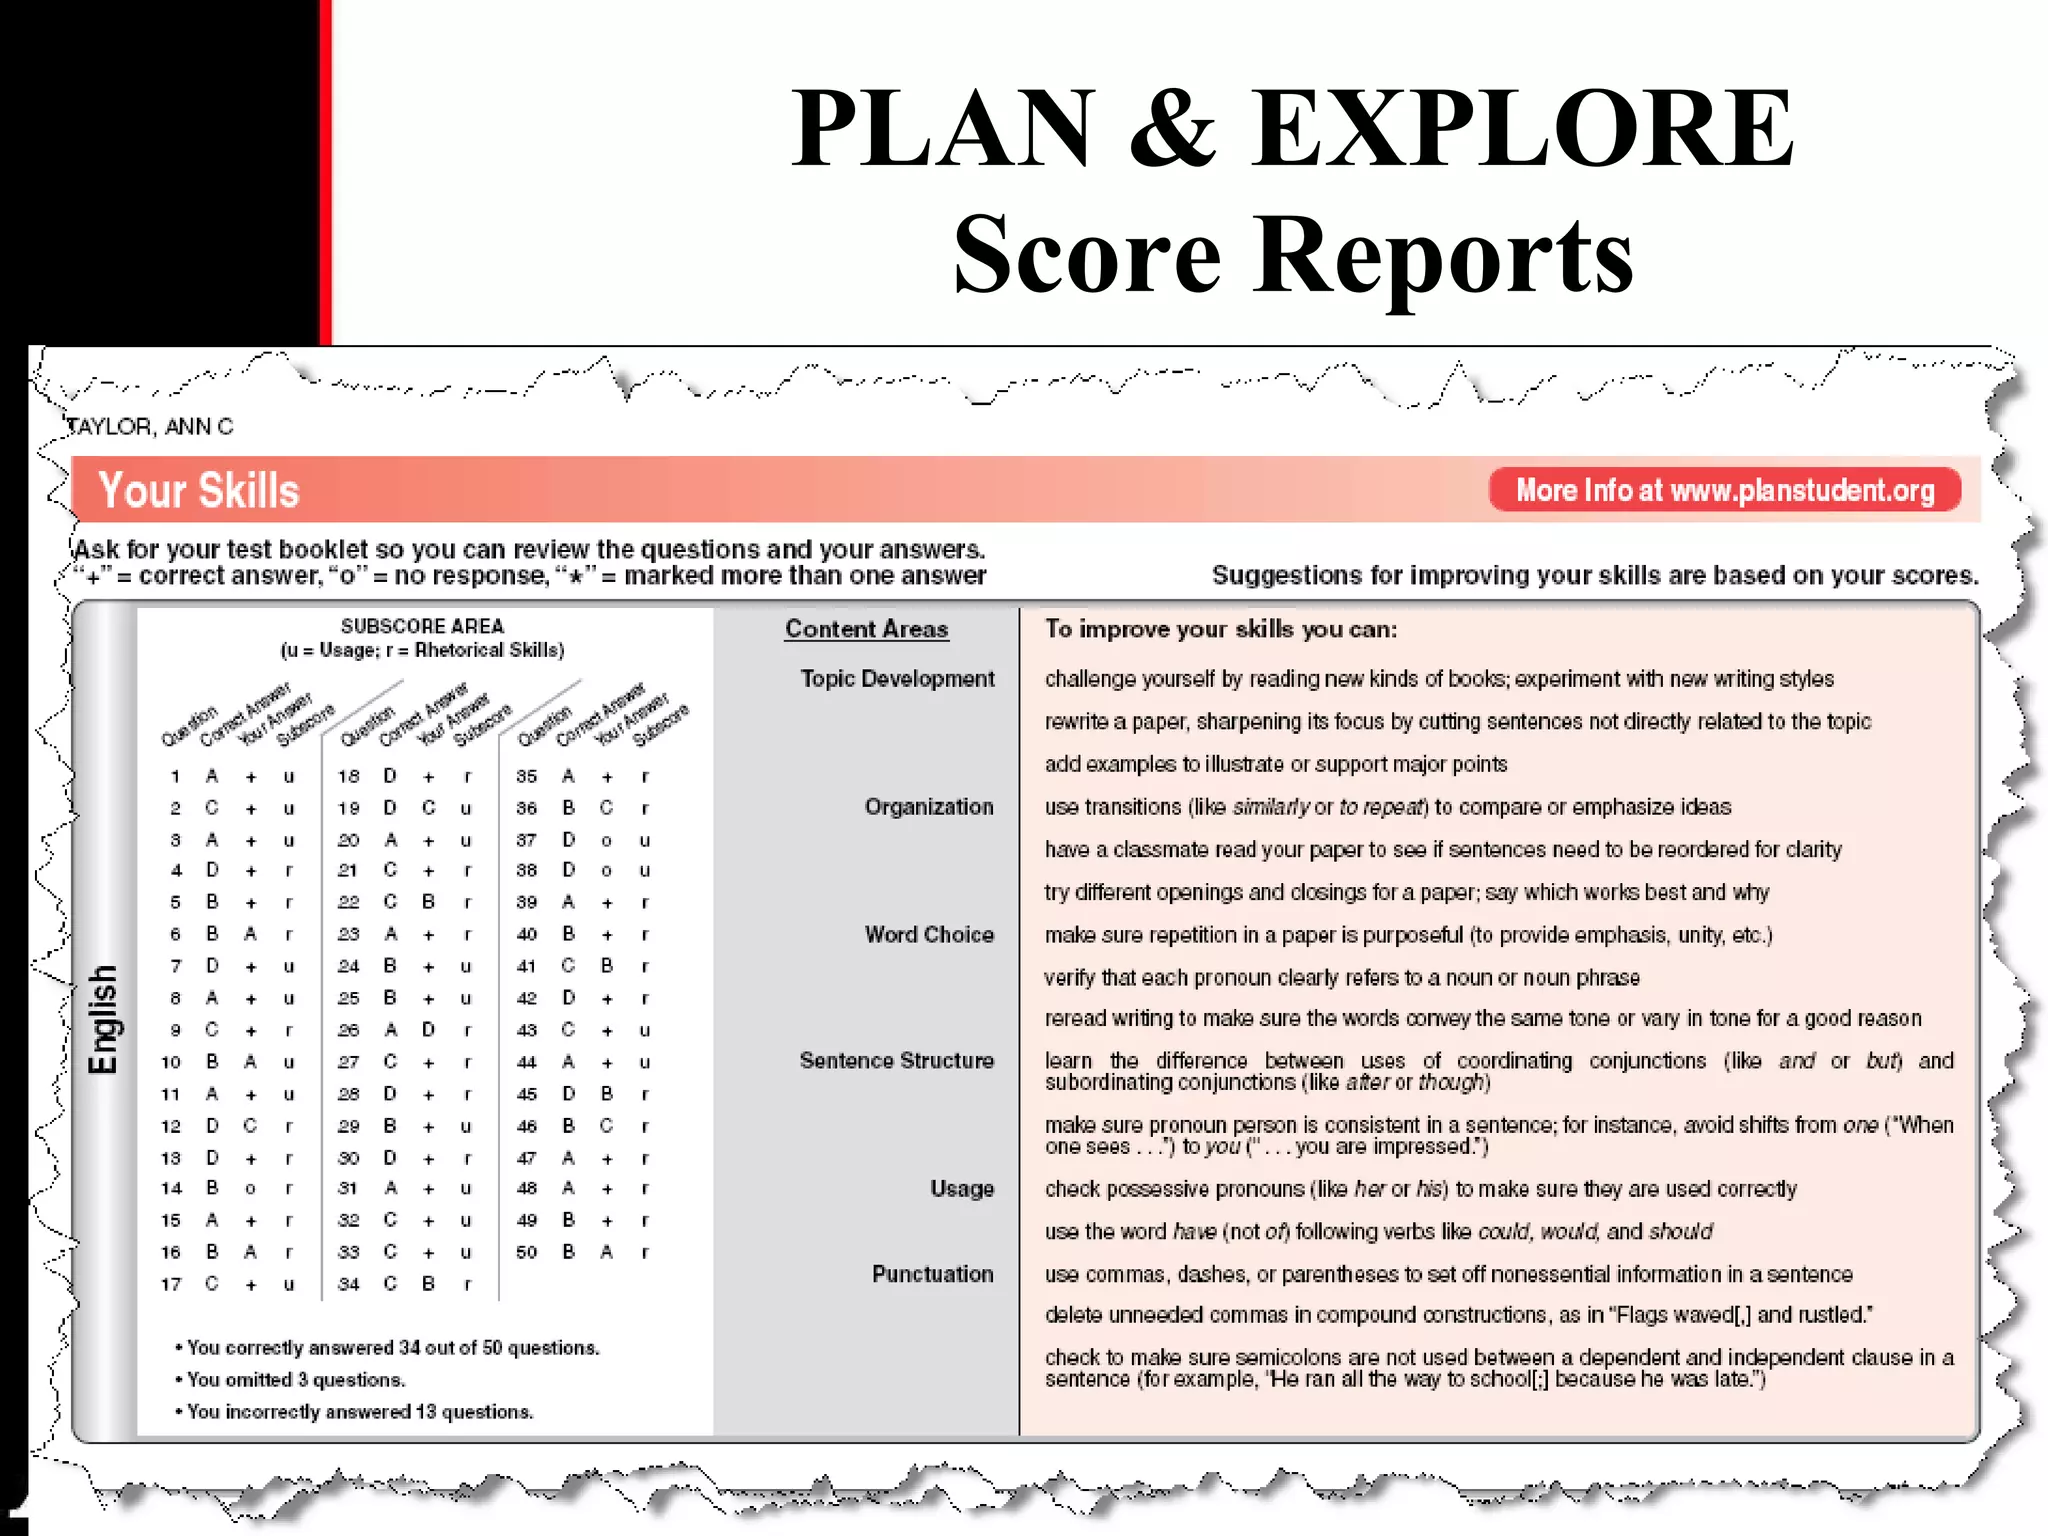
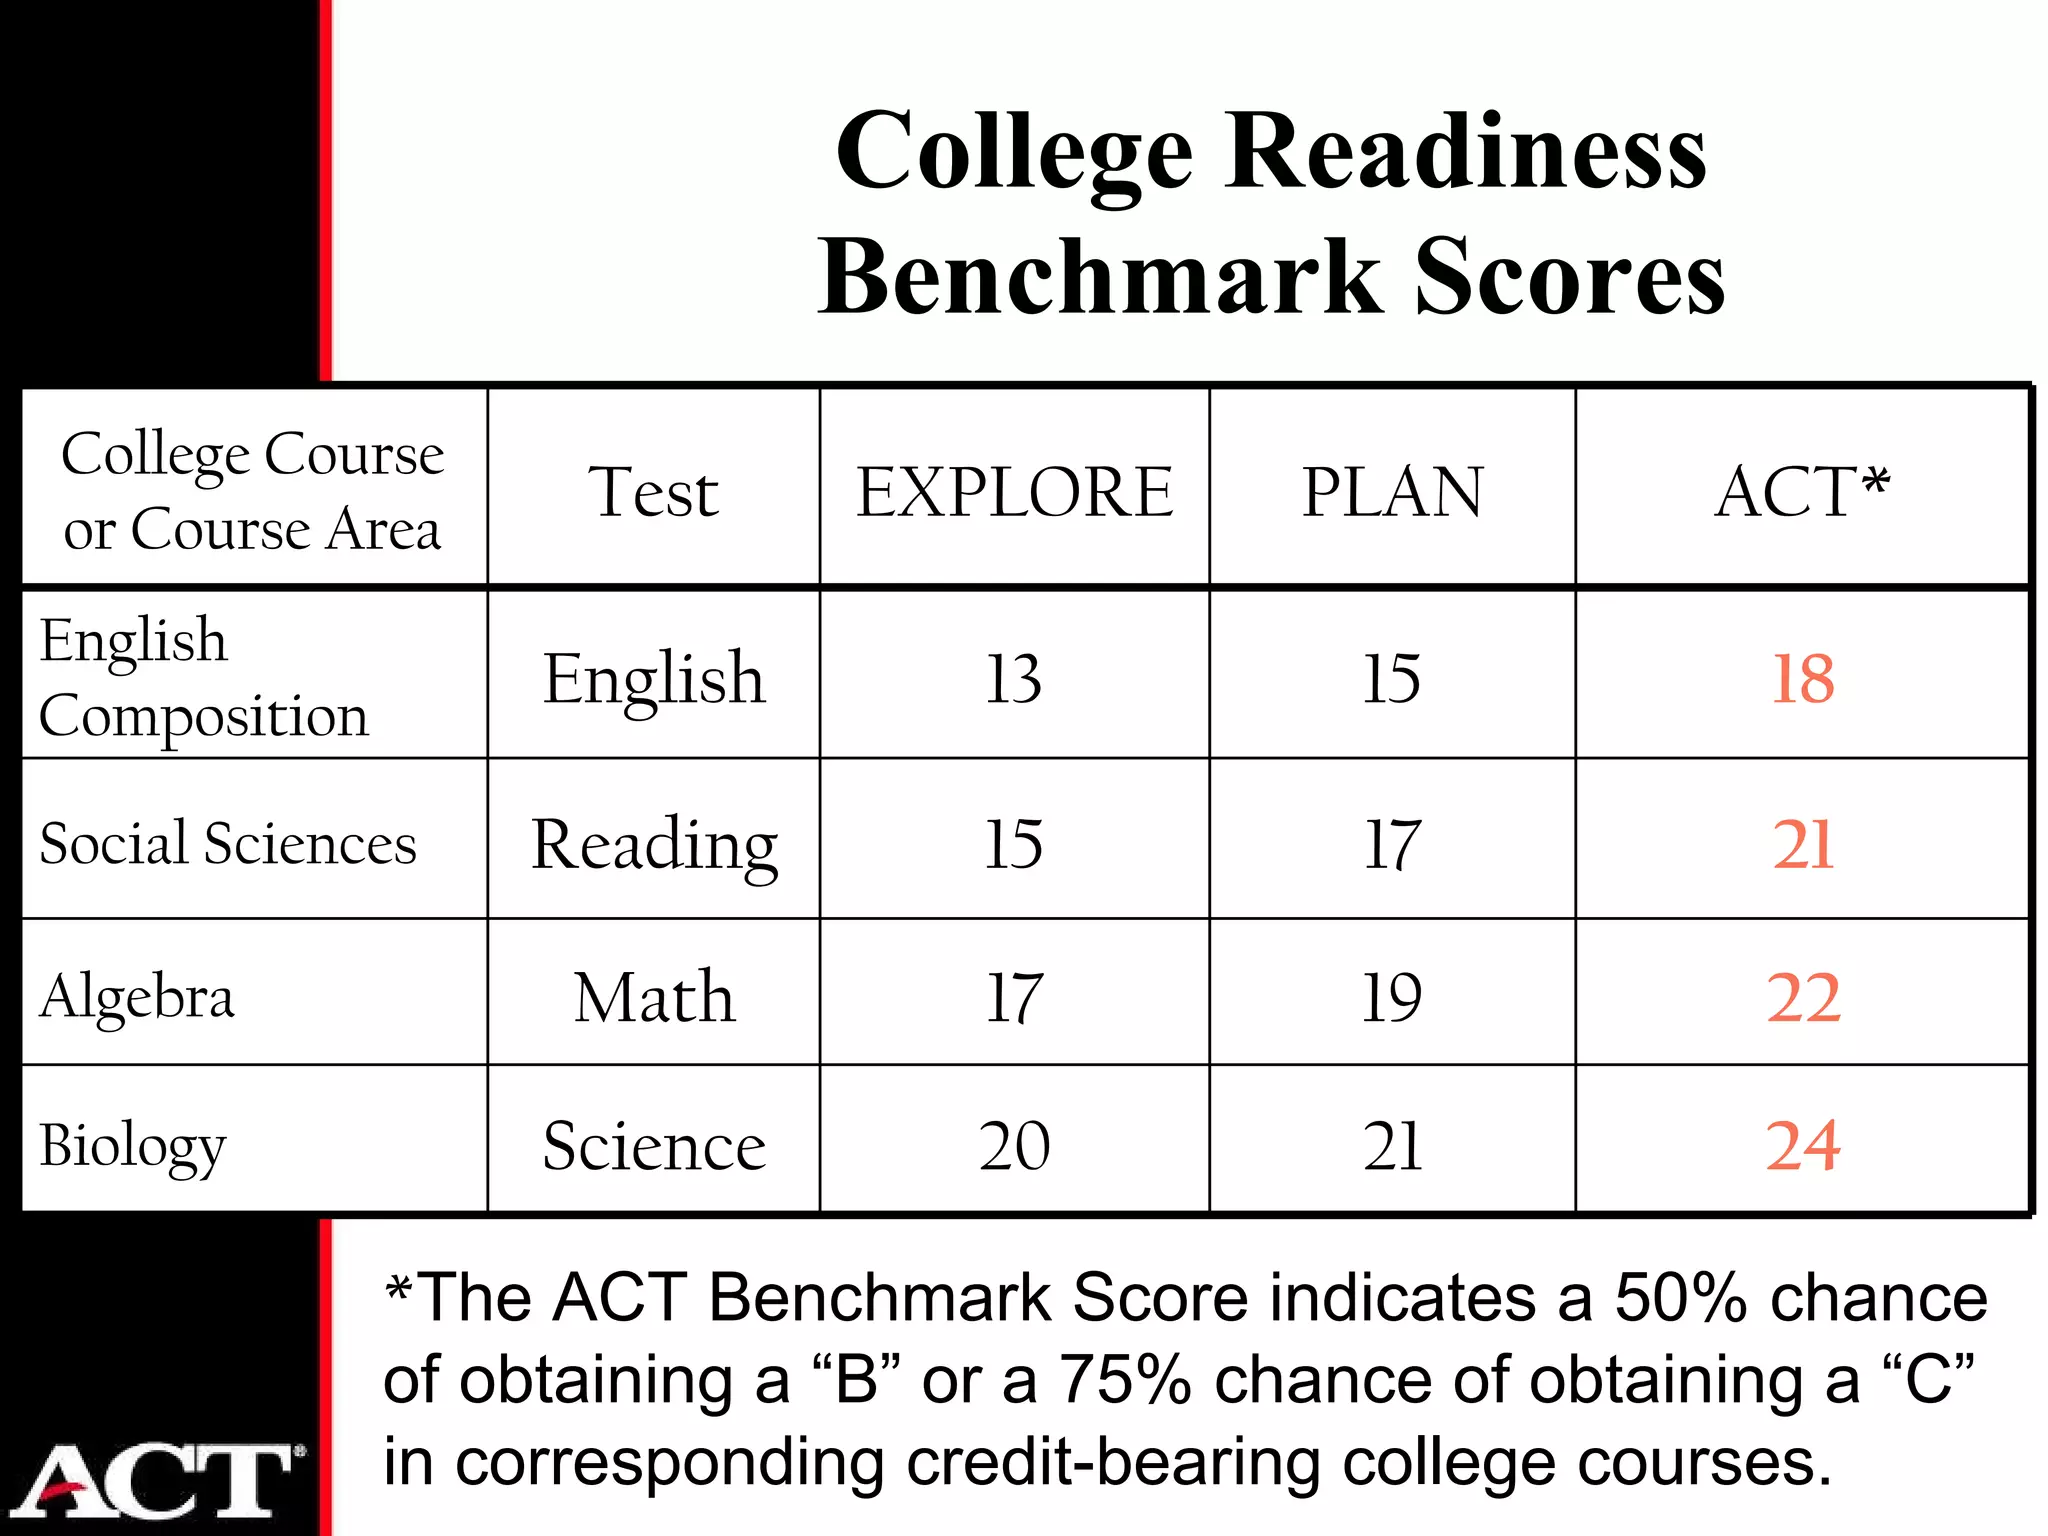
Educational Planning and Assessment System English, mathematics, reading, science College Readiness Standards College Readiness Standards College Readiness Standards English, mathematics, reading, science English, mathematics, reading, science
EPAS Scales Relationship 0 5 10 15 20 25 30 35 40 EXPLORE PLAN ACT 32 25 36
College Readiness Standards (CRS) are the statements that represent widely held learning goals that are important for success in high school, college, and the world of work.  The CRS link EXPLORE, PLAN, and the ACT Assessment scores to curriculum and instructional decision making. College Readiness Standards
College Readiness Standards by Learning Strands and Score Ranges Scores are seen as  Assessment  for  Achievement, rather than Assessment  of  Achievement! Standards: Standards: Standards: Standards: Standards: Standards: 20-23 16-19 ideas for progress ideas for progress Basic Operations and . . . Probability, Statistics, & Data . . . Numbers: Concepts & Properties
ACT College Readiness Standards Kentucky 2006
ACT CRS Ranges Page 12
PLAN & EXPLORE Score Reports
CRS and Your Curriculum Review of state objectives Review of state approved textbooks Collaboration with national teacher organizations: NCTM, NCTE, IRA, NSTA Local item writers National Curriculum Survey Comparisons with over 35 states’ curriculum frameworks, including Kentucky Worksheets for local comparison
 
EXPLORE & PLAN CRS Standards Reports and Guides
Improving Academic Achievement CRS – Guides Examples of test items by Strand by Score Range Suggestions for strategies and assessments by Strands Special Section: “Using Assessment Information to Help Support Low-Scoring Students”
College Readiness Benchmark Scores * The ACT Benchmark Score indicates a 50% chance of obtaining a “B” or a 75% chance of obtaining a “C” in corresponding credit-bearing college courses. College Course or Course Area Test EXPLORE PLAN ACT* English Composition English 13 15 18 Social Sciences Reading 15 17 21 Algebra Math 17 19 22 Biology Science 20 21 24
Percent of Kentucky Graduating Seniors Meeting College Readiness Benchmark Scores
Do my scores indicate that I am on track to being ready to succeed in college courses? PLAN & EXPLORE Score Reports
Title screenCourses Count     
Meeting Benchmarks by  Courses Taken
Math  Courses Count
Science Courses Count
Courses Count!
Gain KC=13% TN=5% Gain KC=9% TN=4% Gain KC=9% TN=3% Gain KC=7% TN=3% Gain KC=7% TN=2%
 
Reading Between the Lines Those ACT-tested students who can read  complex  texts are more likely to be ready for college Performance on complex texts is the clearest differentiator in reading between students who are likely to be ready for college and those who are not. And this is true for both genders, all racial/ethnic groups, and all annual family income levels
Reading Between the Lines More students are on track to being ready for college-level reading in 8 th  & 9 th  grade than are actually ready by the time they reach 12 th  grade Not enough high school teachers are teaching reading skills or strategies and many students are victims of teachers’ low expectations
Reading Between the Lines Kentucky Report
Reading Between the Lines Recommendations include: Provide high school teachers in Kentucky with professional development training to help them incorporate the kinds of complex text and instruction into their courses that will help increase students’ readiness for college-level reading. . . . Page 7, KY Reading Report
What are the components of high school courses that prepare students for successful entry into postsecondary education without the need for remediation? ACT and Education Trust
On Course for Success ACT and Education Trust Selection criteria 40% minority or 50% free/reduced lunch Strong performance on Benchmarks Common “success resources” College-oriented content in the courses Qualified and experienced teachers Teaching that is flexible and responsive to students Extra student support when needed
Content and strategies Textbook-shaped, college preparatory Teacher-directed, constant flow of questioning  “ Exposition and questioning” Students expected to “ act like scholars” in the field practice good work habits Outside-of-class academic support On Course for Success ACT and Education Trust
Chapters IV, V, VI Composite syllabi in each discipline Discussion of each syllabus Syllabus for: Geometry Algebra II Precalculus On Course for Success ACT and Education Trust English - Grade 10 English - Grade 11 Biology Chemistry Physics
A Grading Scale
 
 
Other Reports Intervention Rosters – EXPLORE and PLAN Self-reported Needs Don’t plan to finish high school or no postsecondary plans Intervention Roster – EXPLORE only Scoring in lowest 10 th  percentile Intervention Rosters – PLAN only 2 Rosters related to college planning CRS Report and 5 Guides – EXPLORE and PLAN
Resources www.act.org/ew/resources
College Readiness Begins in Middle School On Course for Success Reading Between the Lines Courses Count
Policy Reports
Policy Reports
Policy Reports
Other Research Ready for College and Ready for Work: Same or Different Schools Involving Parents in Early Postsecondary Planning School Relationships Foster Success for African American Students
 

Understanding epas

  • 1.
  • 2.
    Educational Planning andAssessment System English, mathematics, reading, science College Readiness Standards College Readiness Standards College Readiness Standards English, mathematics, reading, science English, mathematics, reading, science
  • 3.
    EPAS Scales Relationship0 5 10 15 20 25 30 35 40 EXPLORE PLAN ACT 32 25 36
  • 4.
    College Readiness Standards(CRS) are the statements that represent widely held learning goals that are important for success in high school, college, and the world of work. The CRS link EXPLORE, PLAN, and the ACT Assessment scores to curriculum and instructional decision making. College Readiness Standards
  • 5.
    College Readiness Standardsby Learning Strands and Score Ranges Scores are seen as Assessment for Achievement, rather than Assessment of Achievement! Standards: Standards: Standards: Standards: Standards: Standards: 20-23 16-19 ideas for progress ideas for progress Basic Operations and . . . Probability, Statistics, & Data . . . Numbers: Concepts & Properties
  • 6.
    ACT College ReadinessStandards Kentucky 2006
  • 7.
  • 8.
    PLAN & EXPLOREScore Reports
  • 9.
    PLAN & EXPLOREScore Reports
  • 10.
    CRS and YourCurriculum Review of state objectives Review of state approved textbooks Collaboration with national teacher organizations: NCTM, NCTE, IRA, NSTA Local item writers National Curriculum Survey Comparisons with over 35 states’ curriculum frameworks, including Kentucky Worksheets for local comparison
  • 11.
  • 12.
    EXPLORE & PLANCRS Standards Reports and Guides
  • 13.
    Improving Academic AchievementCRS – Guides Examples of test items by Strand by Score Range Suggestions for strategies and assessments by Strands Special Section: “Using Assessment Information to Help Support Low-Scoring Students”
  • 14.
    College Readiness BenchmarkScores * The ACT Benchmark Score indicates a 50% chance of obtaining a “B” or a 75% chance of obtaining a “C” in corresponding credit-bearing college courses. College Course or Course Area Test EXPLORE PLAN ACT* English Composition English 13 15 18 Social Sciences Reading 15 17 21 Algebra Math 17 19 22 Biology Science 20 21 24
  • 15.
    Percent of KentuckyGraduating Seniors Meeting College Readiness Benchmark Scores
  • 16.
    Do my scoresindicate that I am on track to being ready to succeed in college courses? PLAN & EXPLORE Score Reports
  • 17.
    Title screenCourses Count    
  • 18.
    Meeting Benchmarks by Courses Taken
  • 19.
  • 20.
  • 21.
  • 22.
    Gain KC=13% TN=5%Gain KC=9% TN=4% Gain KC=9% TN=3% Gain KC=7% TN=3% Gain KC=7% TN=2%
  • 23.
  • 24.
    Reading Between theLines Those ACT-tested students who can read complex texts are more likely to be ready for college Performance on complex texts is the clearest differentiator in reading between students who are likely to be ready for college and those who are not. And this is true for both genders, all racial/ethnic groups, and all annual family income levels
  • 25.
    Reading Between theLines More students are on track to being ready for college-level reading in 8 th & 9 th grade than are actually ready by the time they reach 12 th grade Not enough high school teachers are teaching reading skills or strategies and many students are victims of teachers’ low expectations
  • 26.
    Reading Between theLines Kentucky Report
  • 27.
    Reading Between theLines Recommendations include: Provide high school teachers in Kentucky with professional development training to help them incorporate the kinds of complex text and instruction into their courses that will help increase students’ readiness for college-level reading. . . . Page 7, KY Reading Report
  • 28.
    What are thecomponents of high school courses that prepare students for successful entry into postsecondary education without the need for remediation? ACT and Education Trust
  • 29.
    On Course forSuccess ACT and Education Trust Selection criteria 40% minority or 50% free/reduced lunch Strong performance on Benchmarks Common “success resources” College-oriented content in the courses Qualified and experienced teachers Teaching that is flexible and responsive to students Extra student support when needed
  • 30.
    Content and strategiesTextbook-shaped, college preparatory Teacher-directed, constant flow of questioning “ Exposition and questioning” Students expected to “ act like scholars” in the field practice good work habits Outside-of-class academic support On Course for Success ACT and Education Trust
  • 31.
    Chapters IV, V,VI Composite syllabi in each discipline Discussion of each syllabus Syllabus for: Geometry Algebra II Precalculus On Course for Success ACT and Education Trust English - Grade 10 English - Grade 11 Biology Chemistry Physics
  • 32.
  • 33.
  • 34.
  • 35.
    Other Reports InterventionRosters – EXPLORE and PLAN Self-reported Needs Don’t plan to finish high school or no postsecondary plans Intervention Roster – EXPLORE only Scoring in lowest 10 th percentile Intervention Rosters – PLAN only 2 Rosters related to college planning CRS Report and 5 Guides – EXPLORE and PLAN
  • 36.
  • 37.
    College Readiness Beginsin Middle School On Course for Success Reading Between the Lines Courses Count
  • 38.
  • 39.
  • 40.
  • 41.
    Other Research Readyfor College and Ready for Work: Same or Different Schools Involving Parents in Early Postsecondary Planning School Relationships Foster Success for African American Students
  • 42.

Editor's Notes

  • #3 Review Curriculum Survey; Grade appropriate testing
  • #4 The ACT in its present format was introduced in 1989 on a scale of 1-36. Plan was introduced in 1987 on a scale of 1-32. EXPLORE became fully operational in the early 1990s on a scale of 1-25. We had three tests that measured common skills in a common format, but we had three different score scales. To help educators better track their students academic development, we put PLAN on ACT’s score scale and EXPLORE on PLAN’s score scale. We did not but EXPLORE on ACT’s score scale. We can predict an ACT score from PLAN. We can predict a PLAN score from EXPLORE. But, we will not predict an ACT score from EXPLORE.
  • #6 Participants can review the row of your choice and identify the grade level by which students should master the skills in that row. I usually choose row 16-19. ACT does not put a grade level on any College Readiness Standards skill range. You can discuss here about using the Standards for setting goals for the school. Where do they think their students should be scoring when they take PLAN? When they take the ACT? In the Standards booklet, note that the skills in the 33-36 range are measured on ACT only; the skills in the 28-32 range are measured on PLAN and the ACT, but not on EXPLORE. Also note that on the Mathematics pages, the last column, Functions, is measured on the ACT only. Scattered throughout the Mathematics sections will be skills marked with * and + to indicate they are not measured on EXPLORE and/or PLAN. Therefore, the one booklet can be used to describe the skills measured on all three tests, in the designated score ranges.
  • #15 College Readiness Benchmark Scores offer a different (and unrelated) measure of student success on EXPLORE, PLAN, or the ACT than that provided by National norms. Rather than comparing students’ test scores to that of other students, the Benchmark Scores compare student performance against a measure of college readiness. Students that meet Benchmark Scores are likely on track to be successful in an entry level college course in that subject area (provided students continue with a similar level of commitment to coursework and study habits). College Readiness Benchmark Scores can be used to help students understand the areas in which they need to improve to be prepared for college-level work. Benchmark scores offer a common language that can be used to help define “college readiness” Can be used to relate state standards to postsecondary expectations State-specific College Readiness Benchmarks can be identified Again, empirically derived based on student performance in college courses
  • #23 Strategies for success included identify students who were not ready for high school course work and offering remediation and using the data to encourage more students to take rigorous course work.
  • #34 All schools and districts should have a link on their website for parents and students to accesses the PLAN and EXPLORE pages – BEFORE they ever take the test. Motivation is important for successful testing
  • #40 Sign up for Policy Alerts