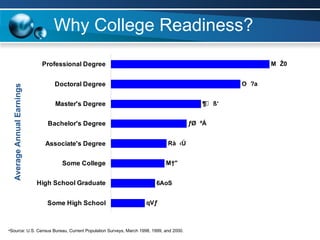
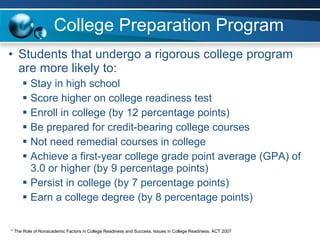
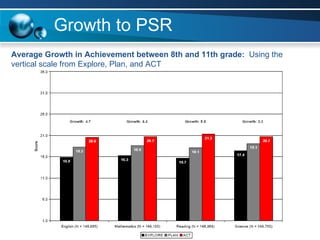
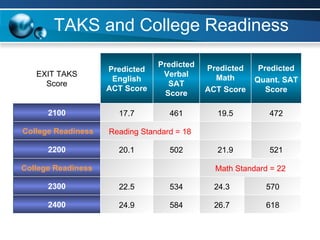
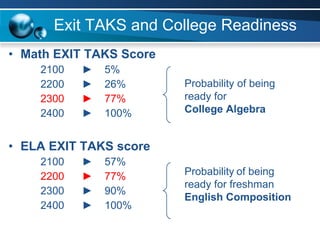
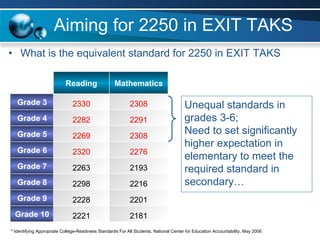
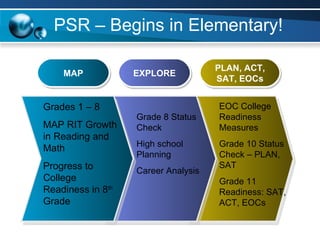
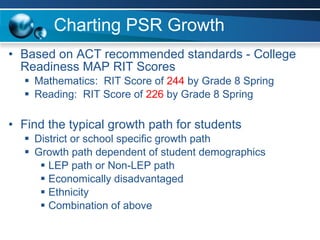
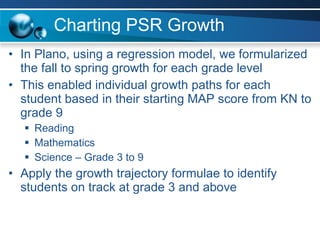
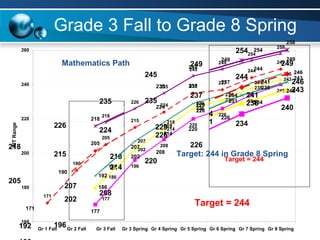
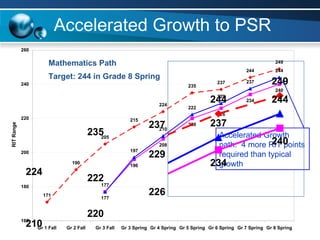
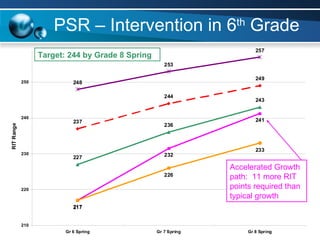
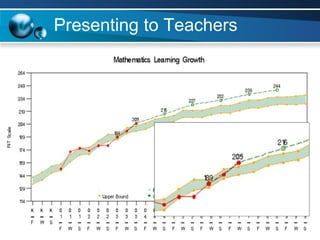
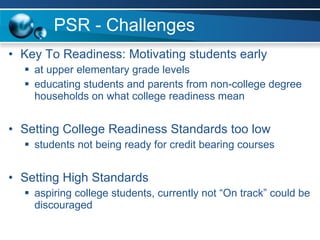
Paths to Post Secondary Readiness Dash Weerasinghe Assessment and Accountability Plano ISD 4 th  Annual Texas MAP User Conference - July 28, 2010
Why College Readiness? Source: U.S. Census Bureau, Current Population Surveys, March 1998, 1999, and 2000. Average Annual Earnings
College Preparation Program  Students that undergo a rigorous college program are more likely to: Stay in high school Score higher on college readiness test Enroll in college (by 12 percentage points) Be prepared for credit-bearing college courses Not need remedial courses in college Achieve a first-year college grade point average (GPA) of 3.0 or higher (by 9 percentage points) Persist in college (by 7 percentage points) Earn a college degree (by 8 percentage points) * The Role of Nonacademic Factors in College Readiness and Success, Issues in College Readiness, ACT 2007
College Readiness Program EXPLORE PLAN ACT/SAT Successful transition into high school  Explore personally relevant career options  Information about students' perceived needs World-of Work Map, study skills checklist, coursework planner As a "pre-ACT" test, PLAN is a powerful predictor of success on the ACT Focuses attention on both career preparation and improving academic achievement Links students with relevant college and scholarship information  ACT tests are curriculum based and directly related to what is taught in high school courses Can measure growth towards collage readiness SAT scores can be converted to ACT scale to measure growth
Measuring PSR Students who meet a Benchmark have approximately a 50 percent chance of earning a B or better and approximately a 75 percent chance of earning a C or better in English Composition, College Algebra, and Biology Typical first year college coursework * How Much Growth toward College Readiness Is Reasonable to Expect in High School?,  ACT 2009 * ACT-SAT Concordance, ACT 2008 24 21 20 Science 470 – V 21 17 15 Reading 520 – Q 22 19 17 Math 471 – V 18 15 13 English SAT Equivalent ACT PLAN EXPLORE Test
Using PSR Benchmarks Evaluating students’ early progress toward college readiness For timely interventions For educational counseling Career planning tool 24 21 20 Science 470 – V 21 17 15 Reading 520 – Q 22 19 17 Math 471 – V 18 15 13 English SAT Equivalent ACT PLAN EXPLORE Test
College Readiness to College GPA EXPLORE, PLAN, or ACT score and College First-year GPA Mathematics
Growth to PSR Average Growth in Achievement between 8th and 11th grade:  Using the vertical scale from Explore, Plan, and ACT
TAKS and College Readiness Math Standard = 22 College Readiness Reading Standard = 18 College Readiness 618 26.7 584 24.9 2400 570 24.3 534 22.5 2300 521 21.9 502 20.1 2200 472 19.5 461 17.7 2100 Predicted Quant. SAT Score Predicted Math ACT Score Predicted Verbal SAT Score Predicted English ACT Score EXIT TAKS Score
Math EXIT TAKS Score   2100  ►  5% 2200  ►  26% 2300  ►  77% 2400  ►  100% ELA EXIT TAKS score   2100  ►  57% 2200  ►  77% 2300  ►  90% 2400  ►  100% Exit TAKS and College Readiness Probability of being ready for  College Algebra Probability   of being ready for freshman  English Composition
Aiming for 2250 in EXIT TAKS What is the equivalent standard for 2250 in EXIT TAKS * Identifying Appropriate College-Readiness Standards For All Students, National Center for Education Accountability, May 2006.  Unequal standards in grades 3-6;  Need to set significantly higher expectation in elementary to meet the required standard in secondary… 2216 2298 Grade 8 2201 2228 Grade 9 2181 2221 Grade 10 2276 2320 Grade 6 2308 2269 Grade 5 2193 2263 Grade 7 2291 2282 Grade 4 2308 2330 Grade 3 Mathematics Reading
PSR – Begins in Elementary! MAP EXPLORE PLAN, ACT, SAT, EOCs Grades 1 – 8 MAP RIT Growth in Reading and Math Progress to College Readiness in 8 th  Grade Grade 8 Status Check High school Planning Career Analysis EOC College Readiness Measures Grade 10 Status Check – PLAN,  SAT Grade 11 Readiness: SAT, ACT, EOCs
Charting PSR Growth Based on ACT recommended standards - College Readiness MAP RIT Scores Mathematics:  RIT Score of  244  by Grade 8 Spring Reading:  RIT Score of  226  by Grade 8 Spring Find the typical growth path for students District or school specific growth path Growth path dependent of student demographics LEP path or Non-LEP path Economically disadvantaged Ethnicity Combination of above
Charting PSR Growth In Plano, using a regression model, we formularized the fall to spring growth for each grade level This enabled individual growth paths for each student based in their starting MAP score from KN to grade 9 Reading Mathematics Science – Grade 3 to 9 Apply the growth trajectory formulae to identify students on track at grade 3 and above
Grade 3 Fall to Grade 8 Spring Target: 244 in Grade 8 Spring Mathematics Path
Accelerated Growth to PSR Target: 244 in Grade 8 Spring Mathematics Path Accelerated Growth  path:  4 more RIT points required than typical growth
PSR – Intervention in 6 th  Grade Accelerated Growth  path:  11 more RIT points required than typical growth Target: 244 by Grade 8 Spring
Presenting to Teachers
PSR - Challenges Key To Readiness: Motivating students early at upper elementary grade levels educating students and parents from non-college degree households on what college readiness mean Setting College Readiness Standards too low students not being ready for credit bearing courses Setting High Standards aspiring college students, currently not “On track” could be discouraged
Why Post Secondary Readiness The PayScale Report, 2010
Paths to Post Secondary Readiness Dr. Dash Weerasinghe Assessment and Accountability Plano ISD [email_address] 4 th  Annual Texas MAP User Conference - July 28, 2010

20100729 post secondary-readiness mapuserconf

  • 1.
    Paths to PostSecondary Readiness Dash Weerasinghe Assessment and Accountability Plano ISD 4 th Annual Texas MAP User Conference - July 28, 2010
  • 2.
    Why College Readiness?Source: U.S. Census Bureau, Current Population Surveys, March 1998, 1999, and 2000. Average Annual Earnings
  • 3.
    College Preparation Program Students that undergo a rigorous college program are more likely to: Stay in high school Score higher on college readiness test Enroll in college (by 12 percentage points) Be prepared for credit-bearing college courses Not need remedial courses in college Achieve a first-year college grade point average (GPA) of 3.0 or higher (by 9 percentage points) Persist in college (by 7 percentage points) Earn a college degree (by 8 percentage points) * The Role of Nonacademic Factors in College Readiness and Success, Issues in College Readiness, ACT 2007
  • 4.
    College Readiness ProgramEXPLORE PLAN ACT/SAT Successful transition into high school Explore personally relevant career options Information about students' perceived needs World-of Work Map, study skills checklist, coursework planner As a "pre-ACT" test, PLAN is a powerful predictor of success on the ACT Focuses attention on both career preparation and improving academic achievement Links students with relevant college and scholarship information ACT tests are curriculum based and directly related to what is taught in high school courses Can measure growth towards collage readiness SAT scores can be converted to ACT scale to measure growth
  • 5.
    Measuring PSR Studentswho meet a Benchmark have approximately a 50 percent chance of earning a B or better and approximately a 75 percent chance of earning a C or better in English Composition, College Algebra, and Biology Typical first year college coursework * How Much Growth toward College Readiness Is Reasonable to Expect in High School?, ACT 2009 * ACT-SAT Concordance, ACT 2008 24 21 20 Science 470 – V 21 17 15 Reading 520 – Q 22 19 17 Math 471 – V 18 15 13 English SAT Equivalent ACT PLAN EXPLORE Test
  • 6.
    Using PSR BenchmarksEvaluating students’ early progress toward college readiness For timely interventions For educational counseling Career planning tool 24 21 20 Science 470 – V 21 17 15 Reading 520 – Q 22 19 17 Math 471 – V 18 15 13 English SAT Equivalent ACT PLAN EXPLORE Test
  • 7.
    College Readiness toCollege GPA EXPLORE, PLAN, or ACT score and College First-year GPA Mathematics
  • 8.
    Growth to PSRAverage Growth in Achievement between 8th and 11th grade: Using the vertical scale from Explore, Plan, and ACT
  • 9.
    TAKS and CollegeReadiness Math Standard = 22 College Readiness Reading Standard = 18 College Readiness 618 26.7 584 24.9 2400 570 24.3 534 22.5 2300 521 21.9 502 20.1 2200 472 19.5 461 17.7 2100 Predicted Quant. SAT Score Predicted Math ACT Score Predicted Verbal SAT Score Predicted English ACT Score EXIT TAKS Score
  • 10.
    Math EXIT TAKSScore 2100 ► 5% 2200 ► 26% 2300 ► 77% 2400 ► 100% ELA EXIT TAKS score 2100 ► 57% 2200 ► 77% 2300 ► 90% 2400 ► 100% Exit TAKS and College Readiness Probability of being ready for College Algebra Probability of being ready for freshman English Composition
  • 11.
    Aiming for 2250in EXIT TAKS What is the equivalent standard for 2250 in EXIT TAKS * Identifying Appropriate College-Readiness Standards For All Students, National Center for Education Accountability, May 2006. Unequal standards in grades 3-6; Need to set significantly higher expectation in elementary to meet the required standard in secondary… 2216 2298 Grade 8 2201 2228 Grade 9 2181 2221 Grade 10 2276 2320 Grade 6 2308 2269 Grade 5 2193 2263 Grade 7 2291 2282 Grade 4 2308 2330 Grade 3 Mathematics Reading
  • 12.
    PSR – Beginsin Elementary! MAP EXPLORE PLAN, ACT, SAT, EOCs Grades 1 – 8 MAP RIT Growth in Reading and Math Progress to College Readiness in 8 th Grade Grade 8 Status Check High school Planning Career Analysis EOC College Readiness Measures Grade 10 Status Check – PLAN, SAT Grade 11 Readiness: SAT, ACT, EOCs
  • 13.
    Charting PSR GrowthBased on ACT recommended standards - College Readiness MAP RIT Scores Mathematics: RIT Score of 244 by Grade 8 Spring Reading: RIT Score of 226 by Grade 8 Spring Find the typical growth path for students District or school specific growth path Growth path dependent of student demographics LEP path or Non-LEP path Economically disadvantaged Ethnicity Combination of above
  • 14.
    Charting PSR GrowthIn Plano, using a regression model, we formularized the fall to spring growth for each grade level This enabled individual growth paths for each student based in their starting MAP score from KN to grade 9 Reading Mathematics Science – Grade 3 to 9 Apply the growth trajectory formulae to identify students on track at grade 3 and above
  • 15.
    Grade 3 Fallto Grade 8 Spring Target: 244 in Grade 8 Spring Mathematics Path
  • 16.
    Accelerated Growth toPSR Target: 244 in Grade 8 Spring Mathematics Path Accelerated Growth path: 4 more RIT points required than typical growth
  • 17.
    PSR – Interventionin 6 th Grade Accelerated Growth path: 11 more RIT points required than typical growth Target: 244 by Grade 8 Spring
  • 18.
  • 19.
  • 20.
  • 21.
    PSR - ChallengesKey To Readiness: Motivating students early at upper elementary grade levels educating students and parents from non-college degree households on what college readiness mean Setting College Readiness Standards too low students not being ready for credit bearing courses Setting High Standards aspiring college students, currently not “On track” could be discouraged
  • 22.
    Why Post SecondaryReadiness The PayScale Report, 2010
  • 23.
    Paths to PostSecondary Readiness Dr. Dash Weerasinghe Assessment and Accountability Plano ISD [email_address] 4 th Annual Texas MAP User Conference - July 28, 2010