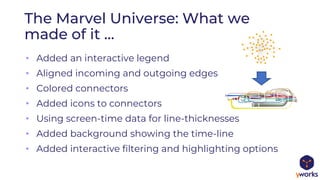
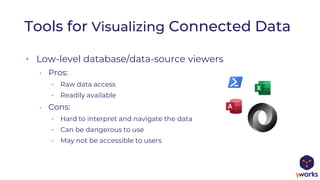
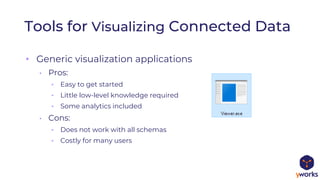
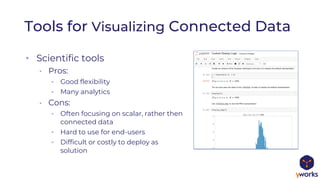
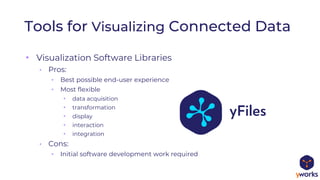
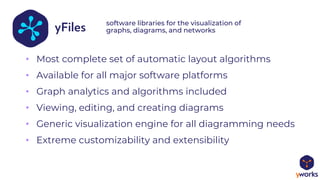
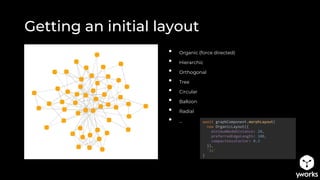
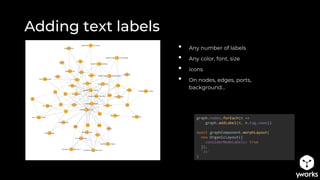
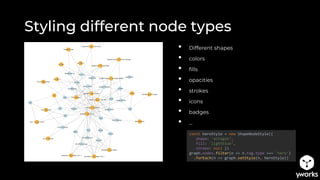
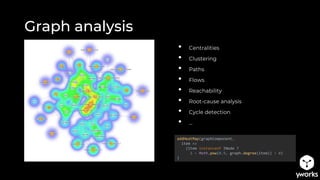
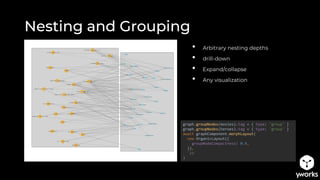
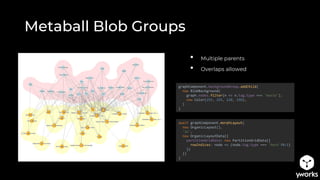
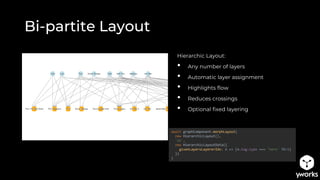
Sebastian Mueller's talk at Connected Data London in October 2019 focused on various tools and techniques for visualizing connected data, aimed at data scientists, engineers, project managers, and software developers. The presentation covered a range of visualization software options, their pros and cons, and highlighted the capabilities of specific libraries and methods for enhancing graph visualization, including automatic layouts and node customization. Real-world examples were provided, showcasing how to manipulate and transform graph data to enhance clarity and insight.

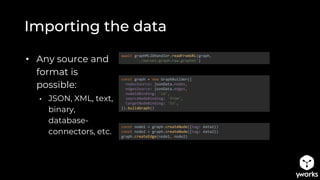
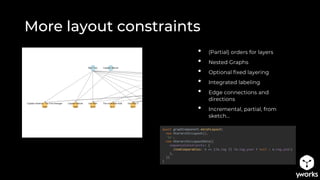
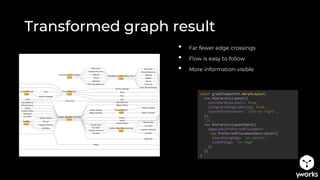
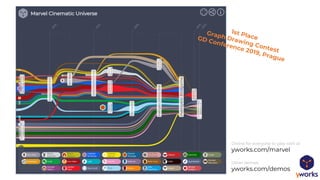
![Transforming the graph
1. Augment movie data
2. Sort movie nodes according to data
3. For each hero participating in two
movies, create edge between pairs of
sorted movies
4. Render as flow-graph from left to
right
movies.forEach(n => {
n.tag.year = movie2year[n.tag.name]
})
heroes.forEach(heroNode => {
graph
.outEdgesAt(heroNode)
.map(e => e.targetNode)
.orderBy(node => node.tag.year)
.reduce((a, b) => {
graph.createEdge({
source: a,
target: b,
tag: { hero: heroNode.tag },
labels: [heroNode.tag.name]
})
return b
})
})](https://image.slidesharecdn.com/cdlpresentation-191007144755/85/Understanding-Connected-Data-through-Visualization-19-320.jpg)