Download as PDF, PPTX

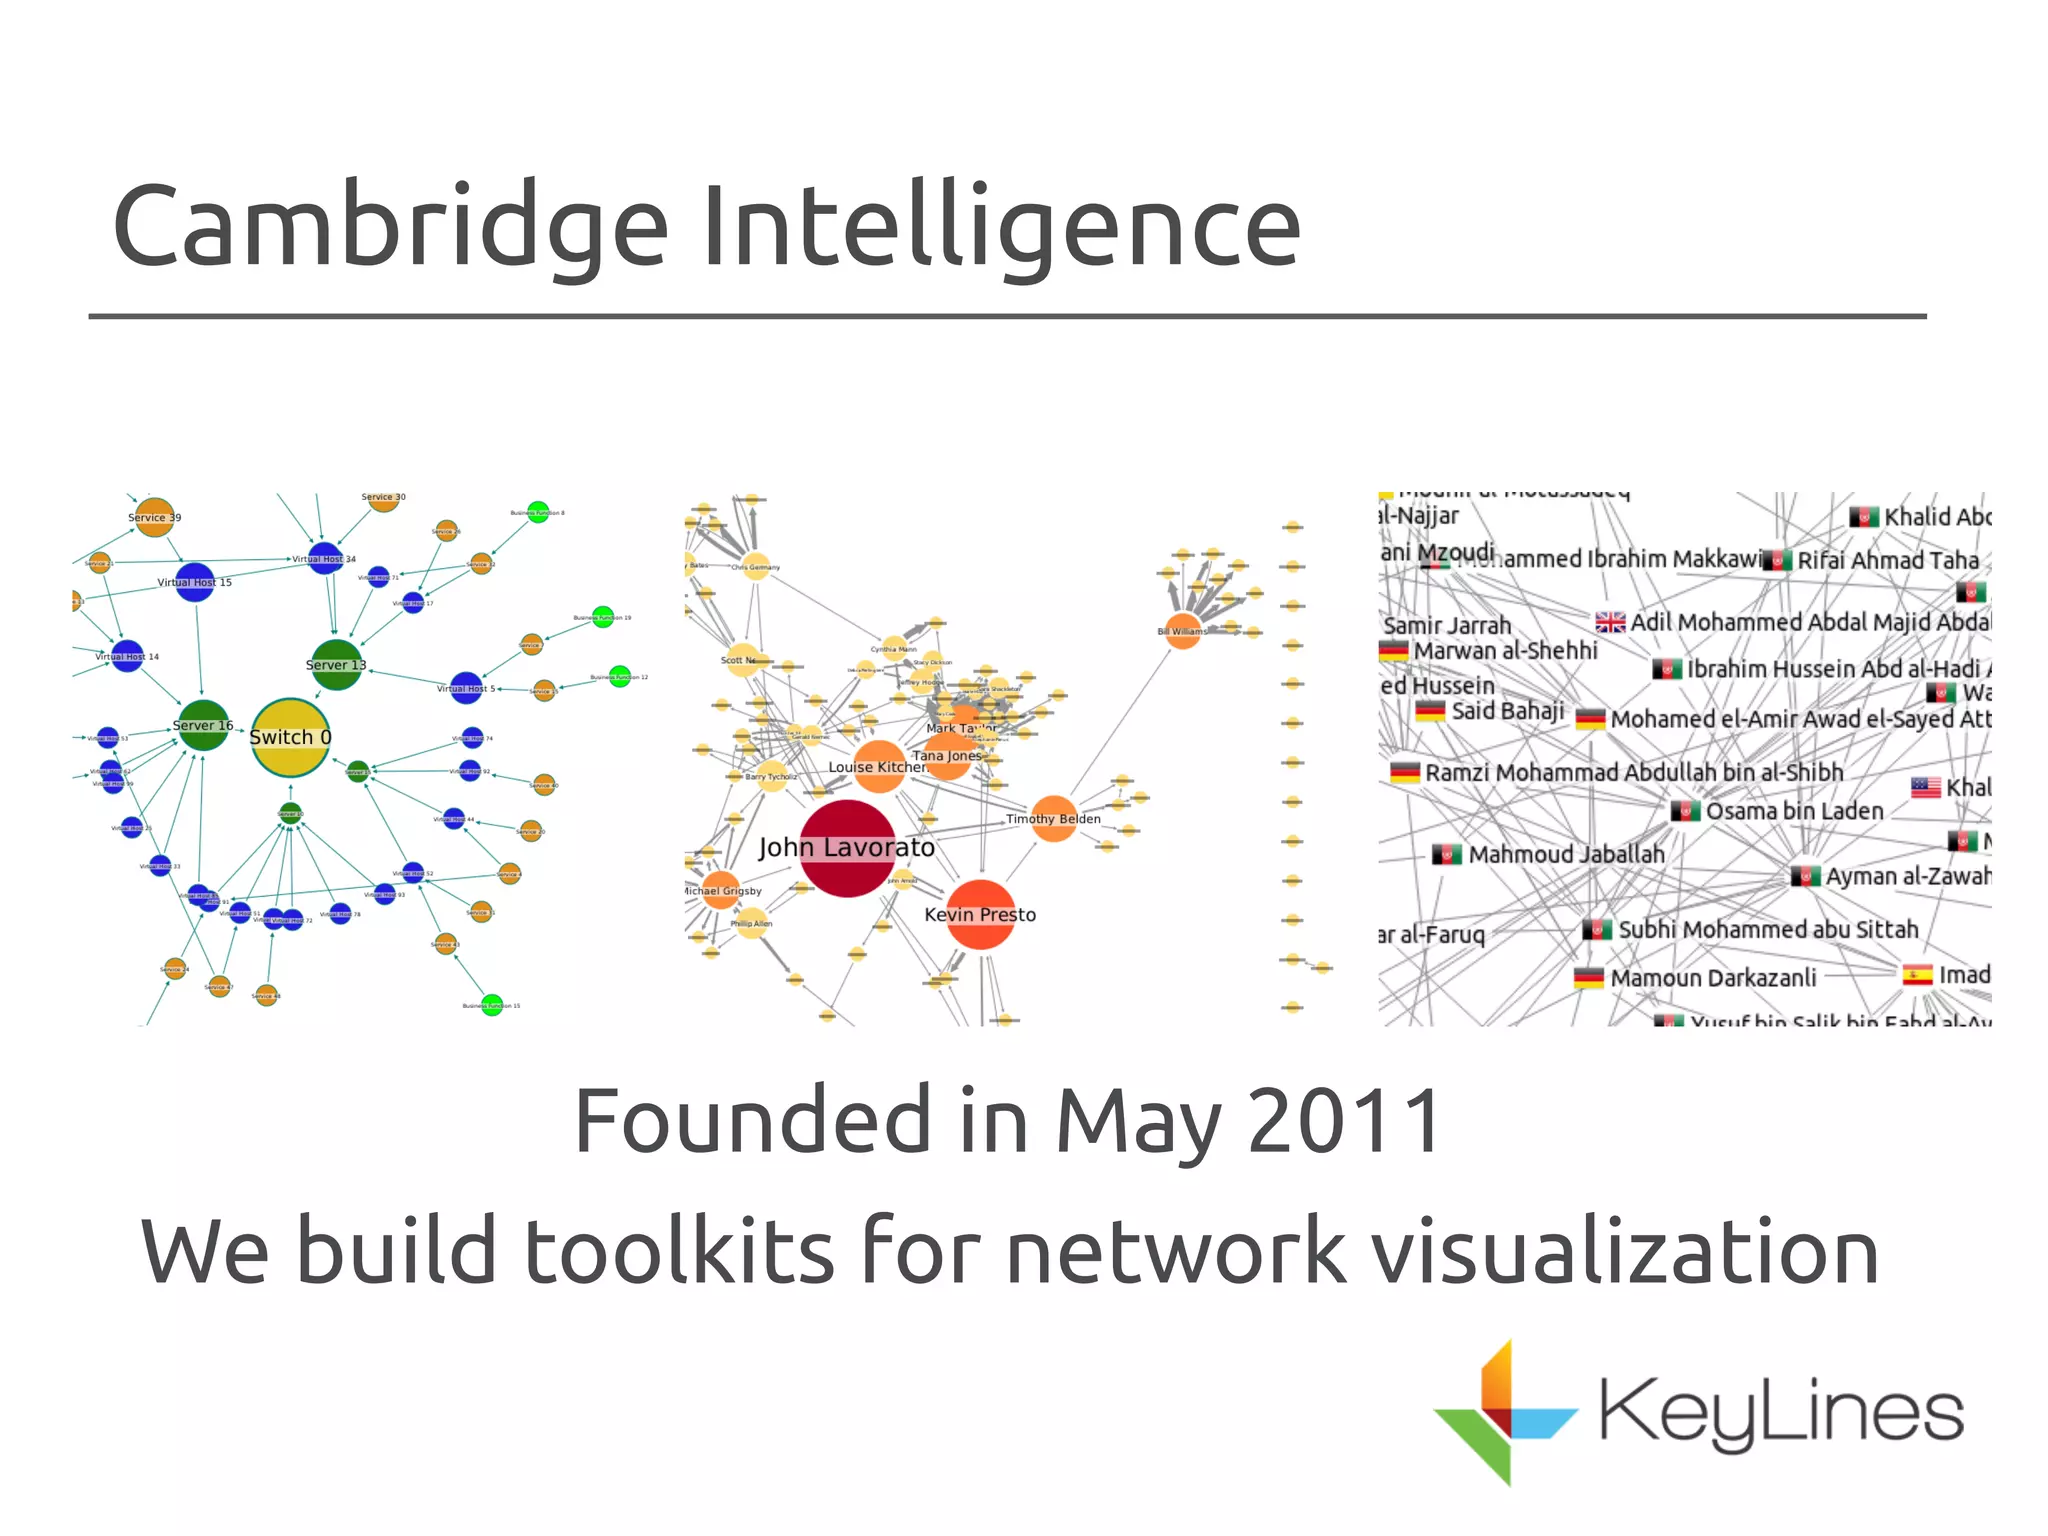


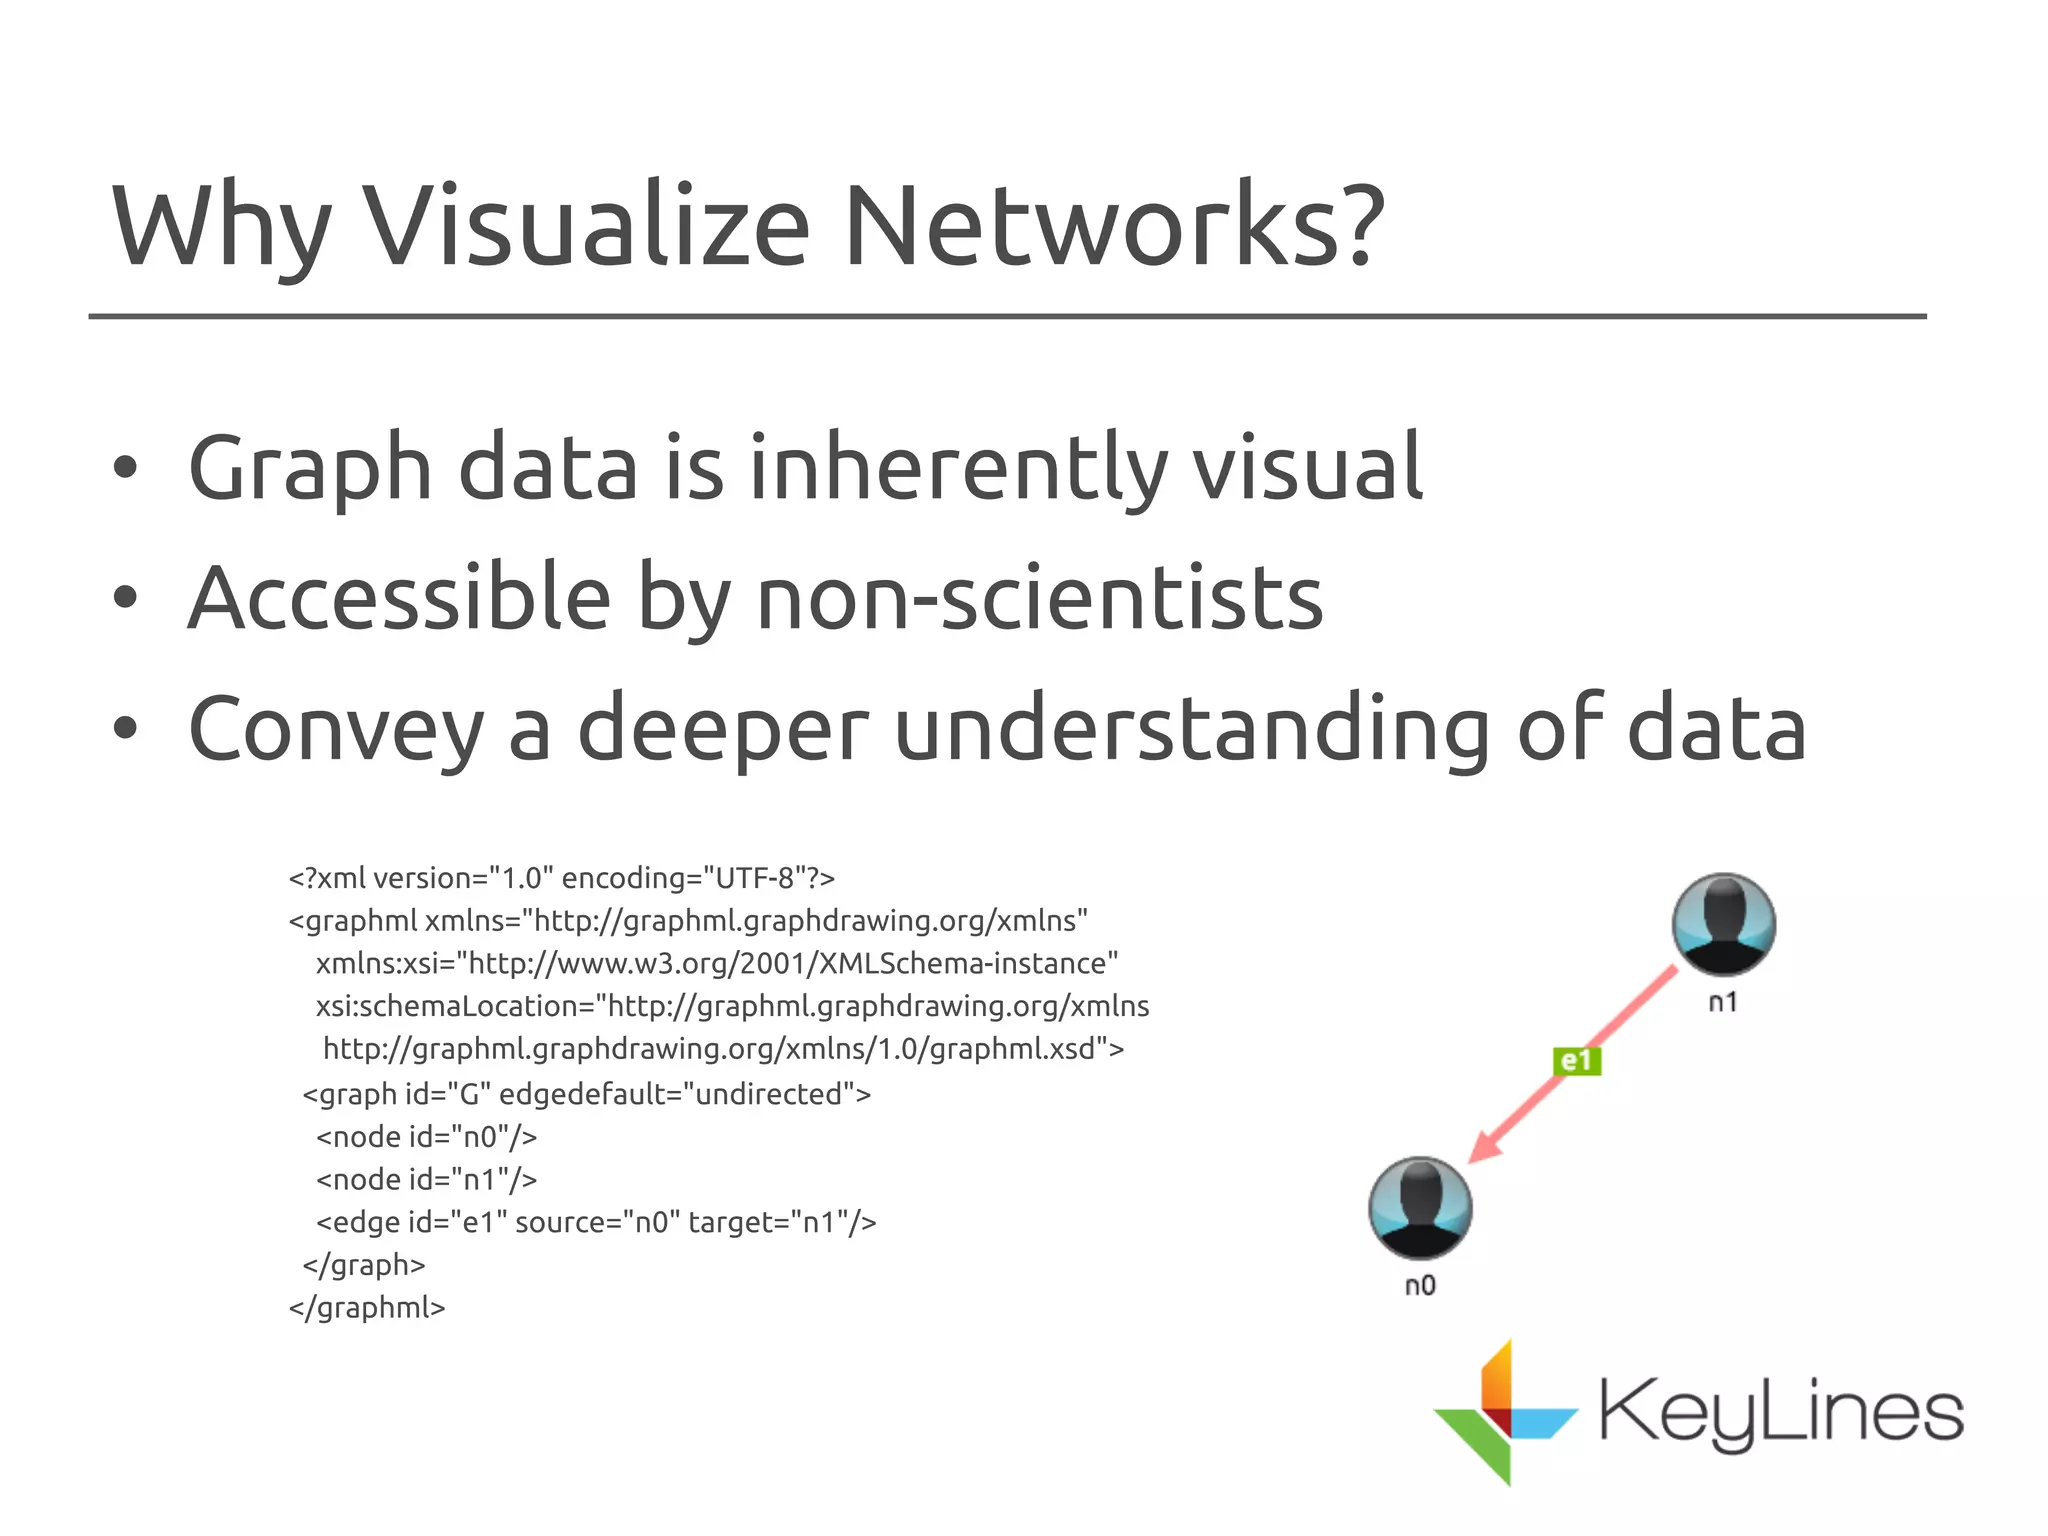
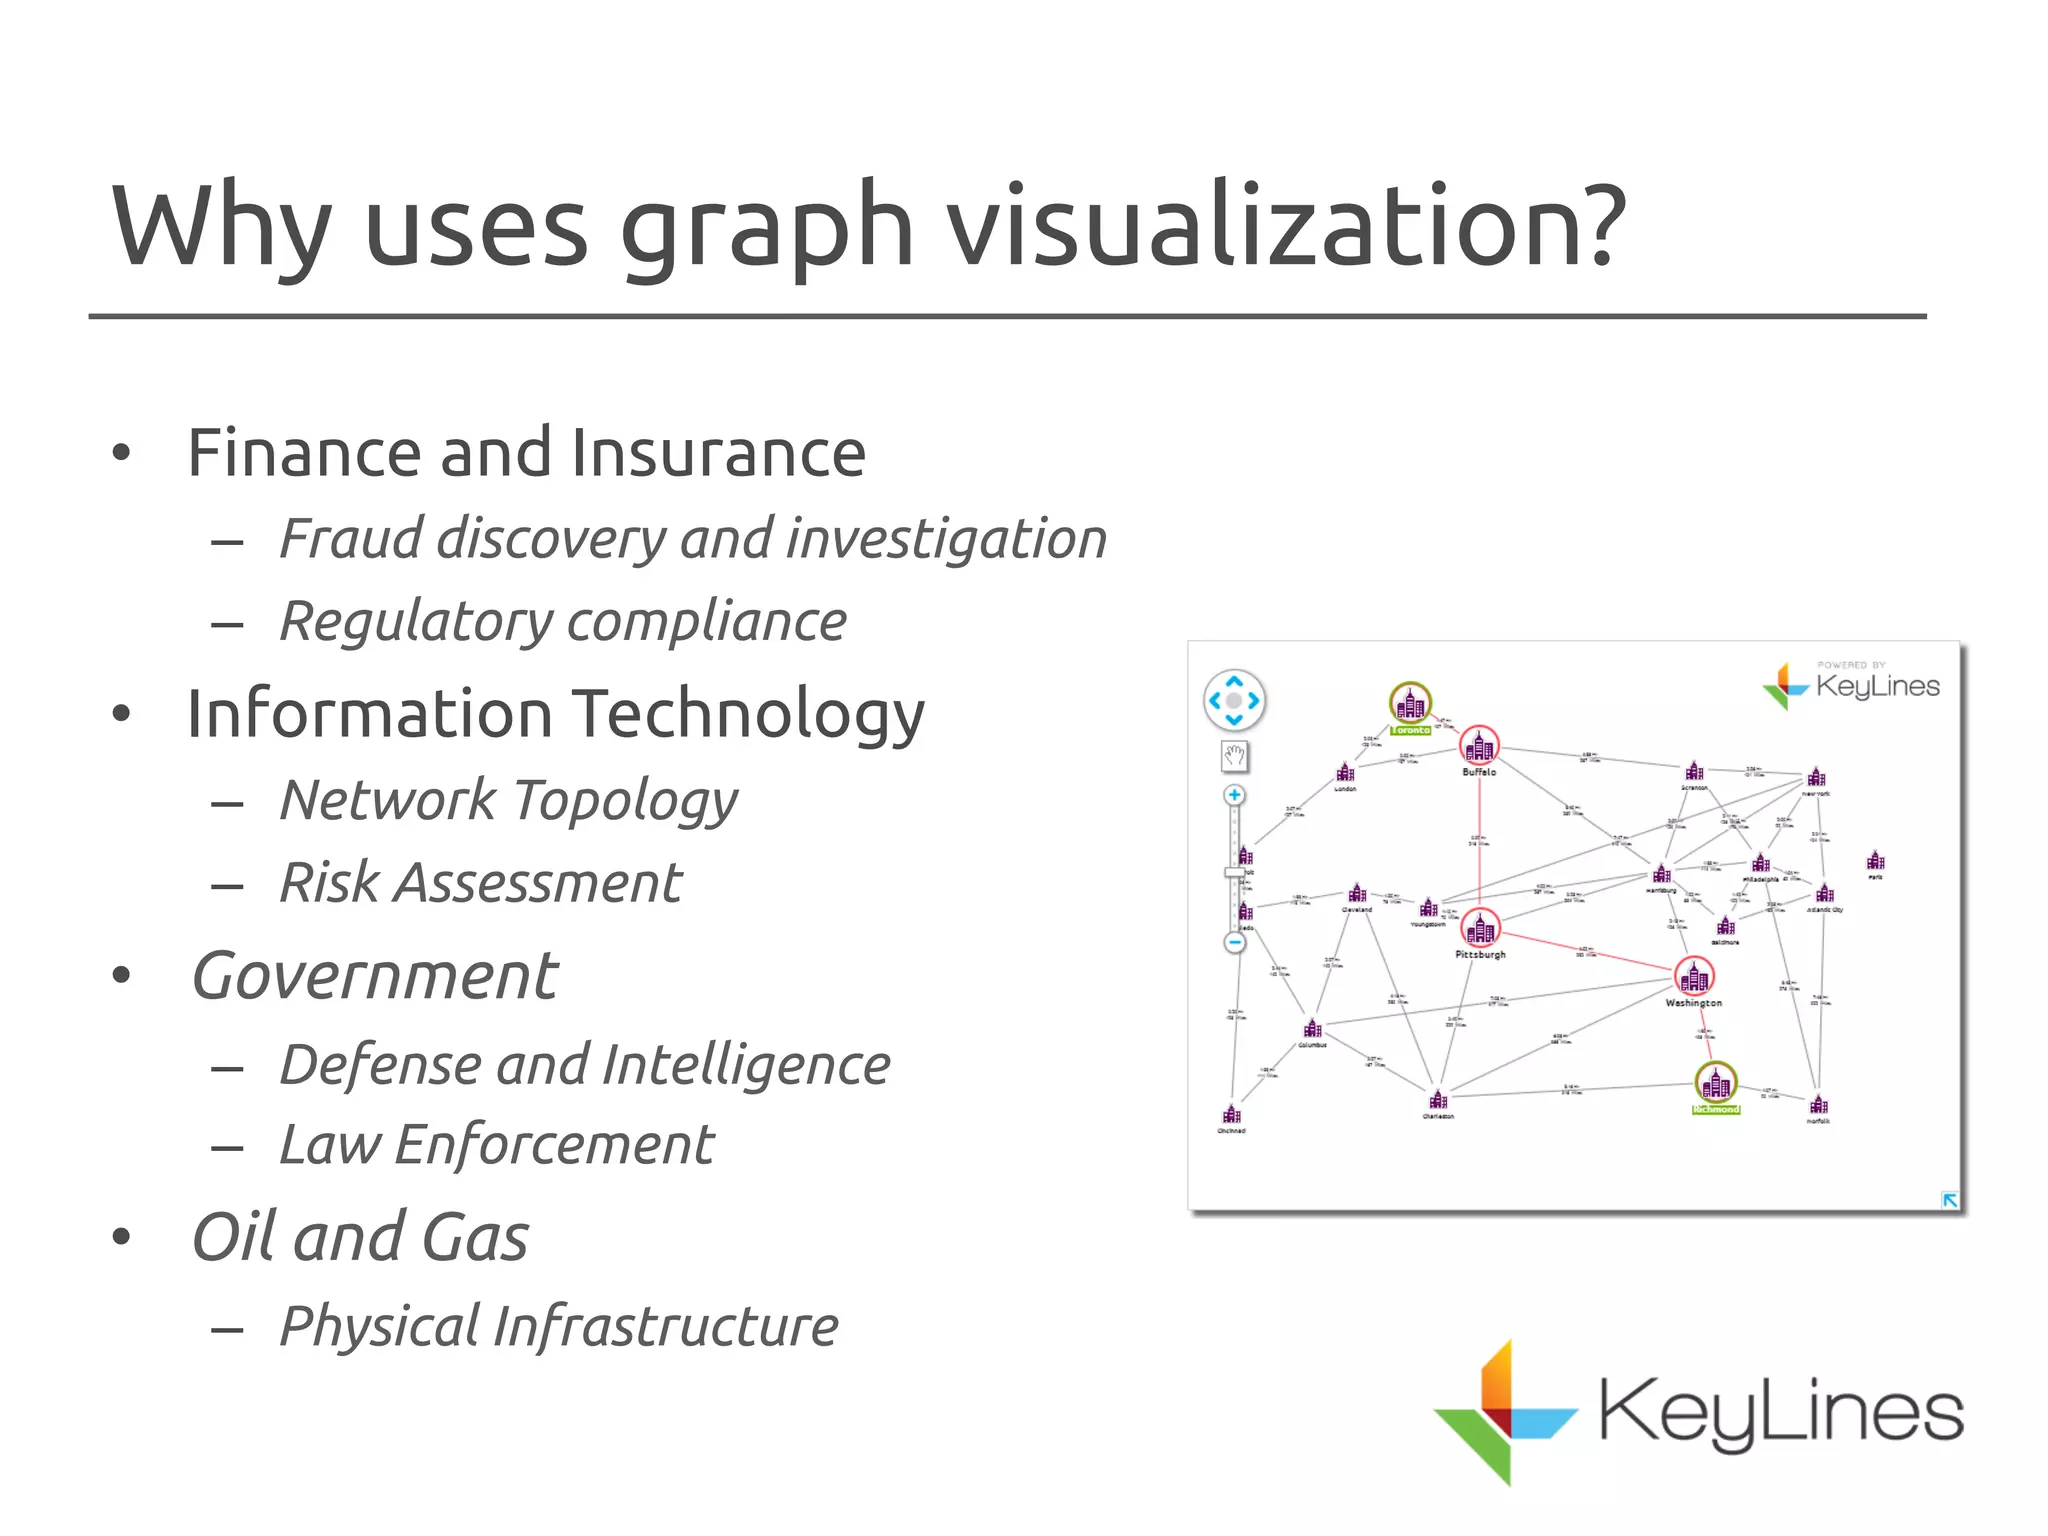

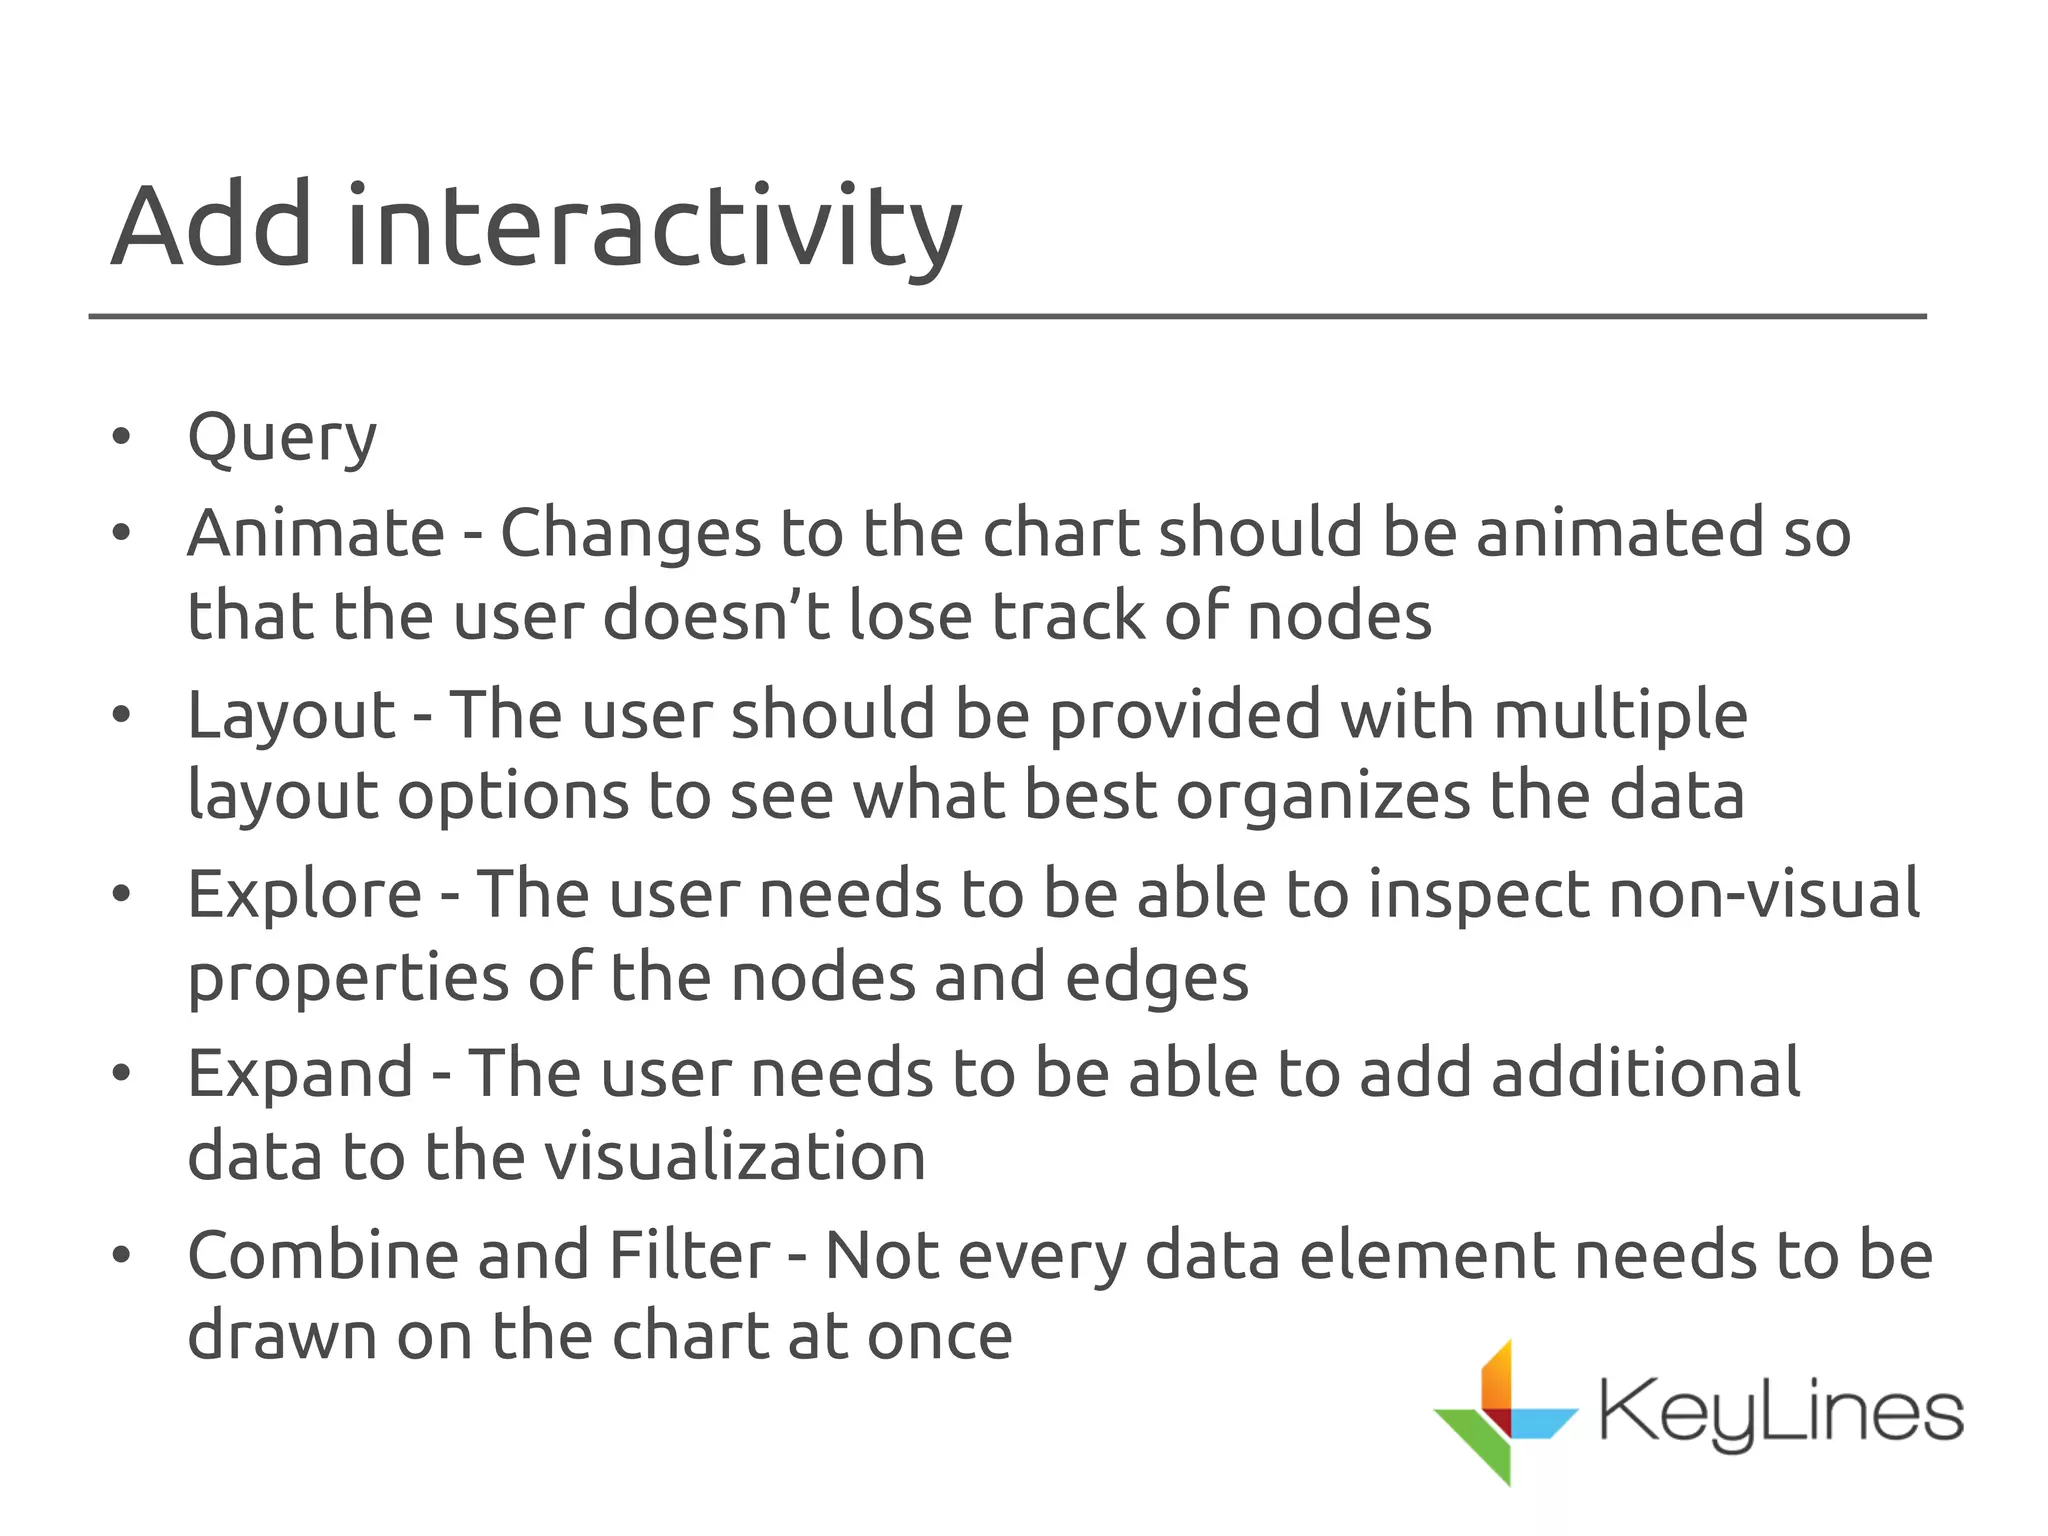
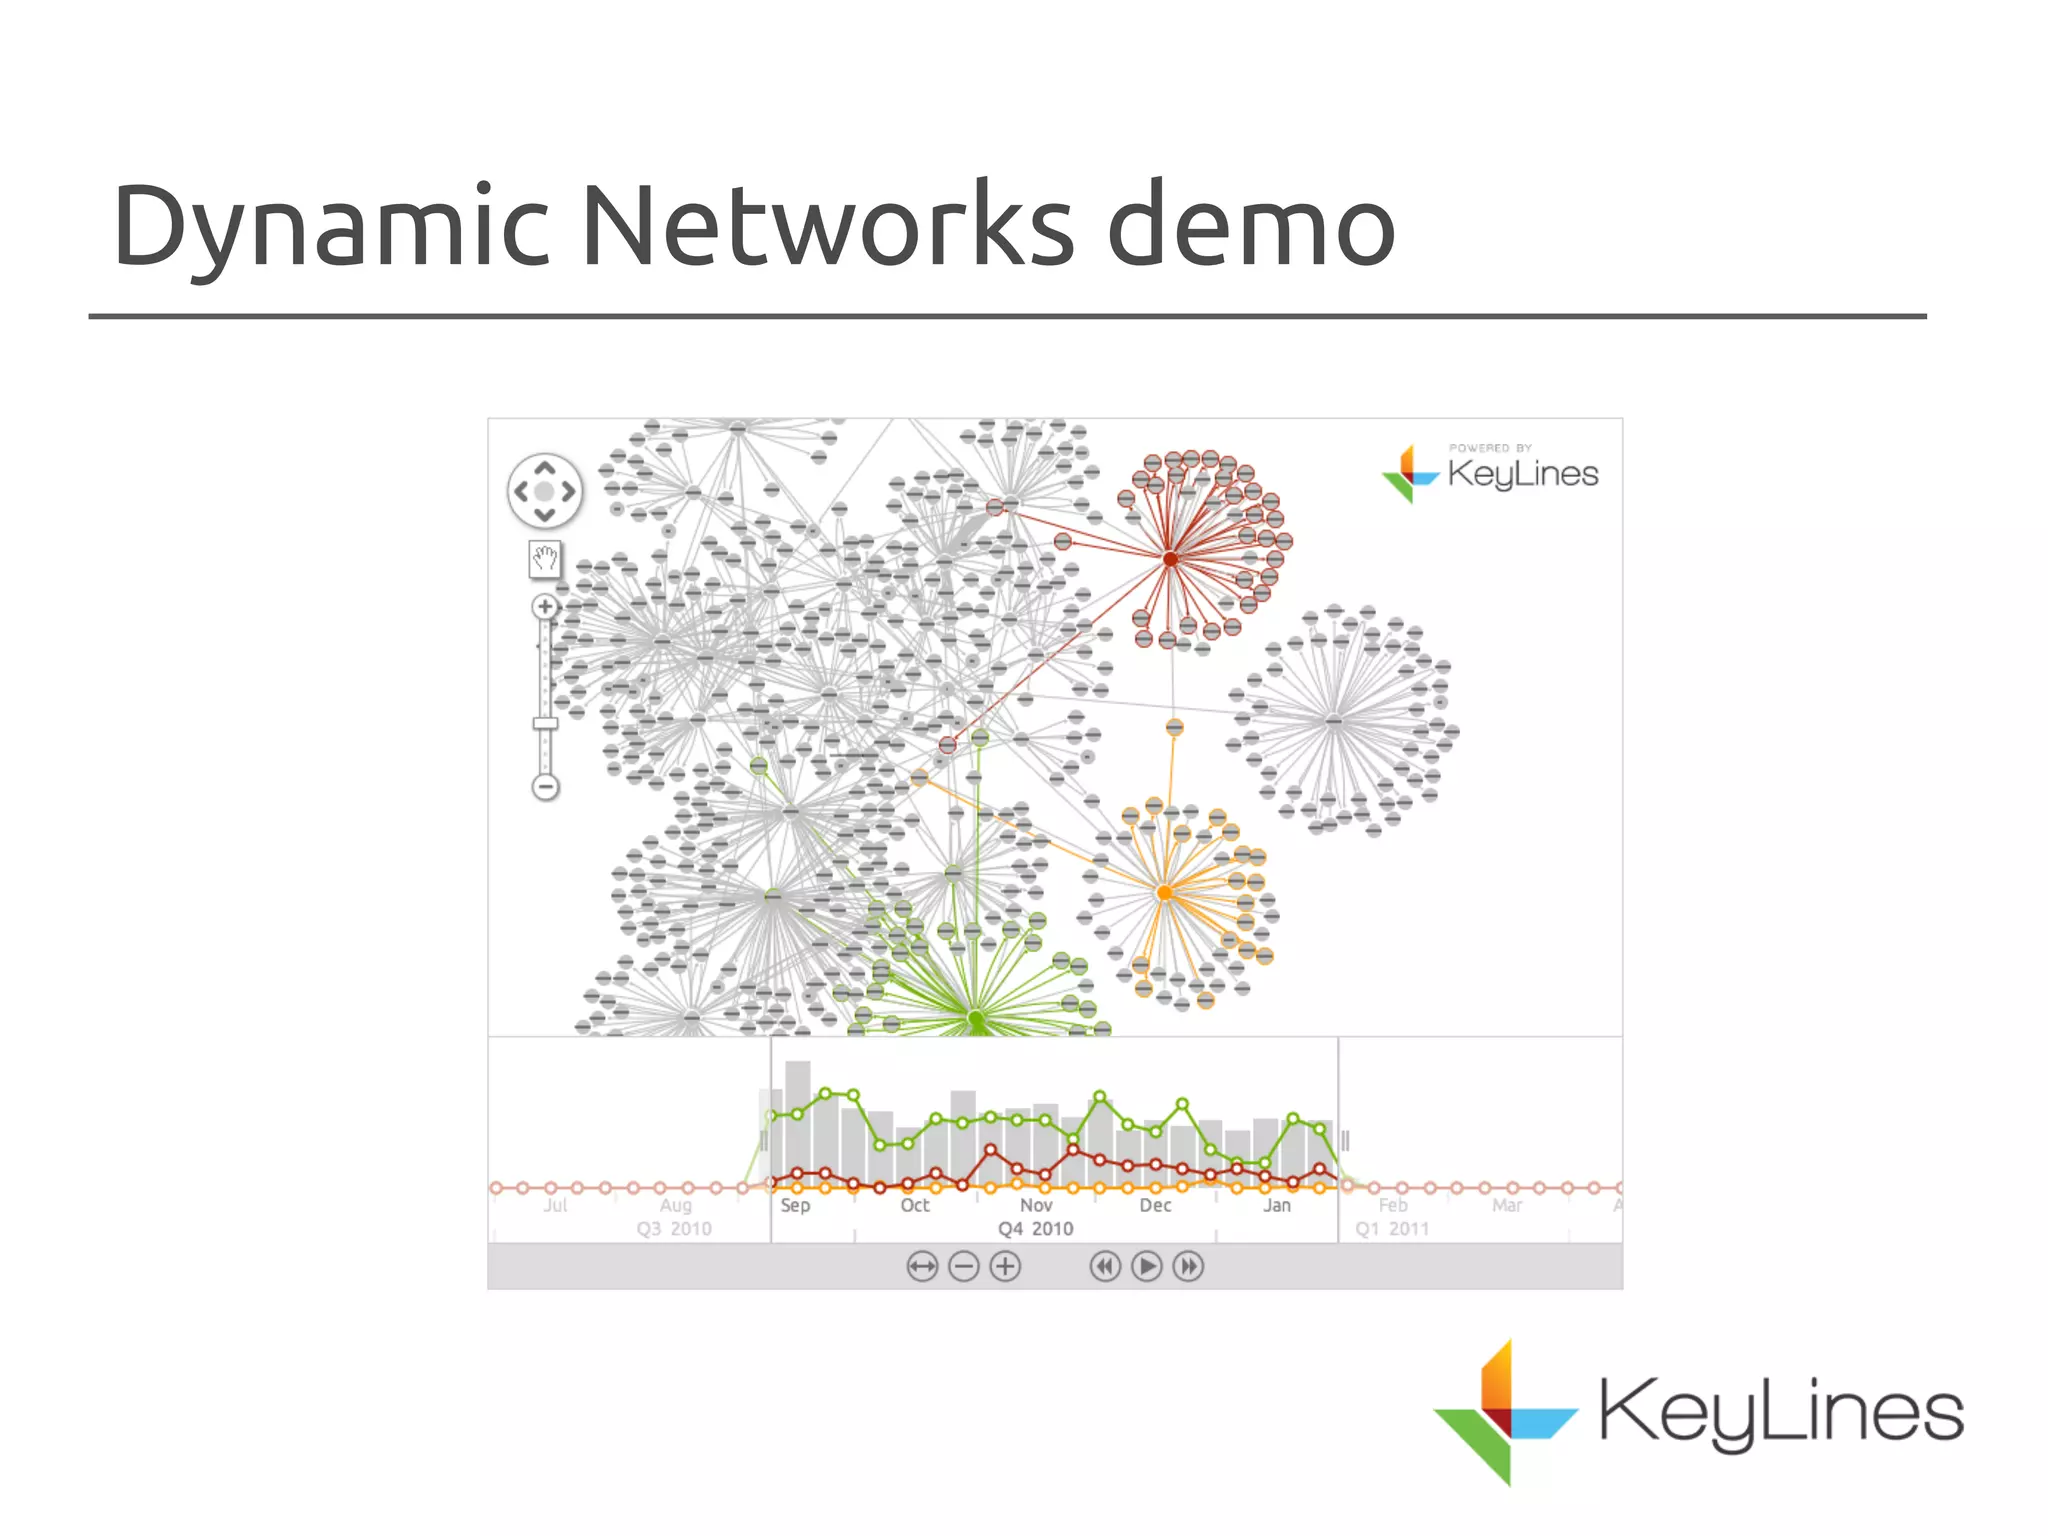


The document discusses the importance of visualizing networks, which are models of interconnected data represented as nodes and edges. It highlights various techniques for creating visualizations, such as animation and interactivity, to enhance understanding of data relationships. The applications of graph visualization span across multiple industries including finance, IT, government, and healthcare.


![[263] s2graph large-scale-graph-database-with-hbase-2](https://cdn.slidesharecdn.com/ss_thumbnails/236s2graph-large-scale-graph-database-with-hbase-2-150915055019-lva1-app6892-thumbnail.jpg?width=640&height=640&fit=bounds)