Downloaded 318 times
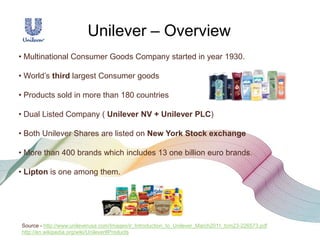
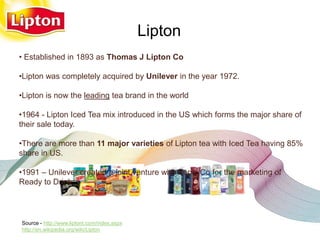


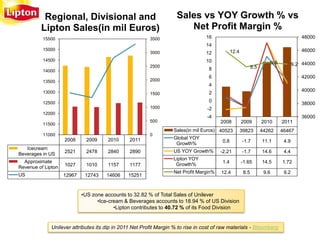
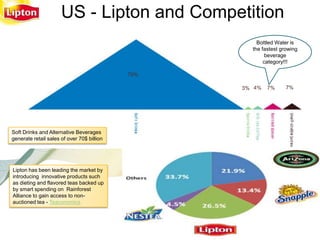
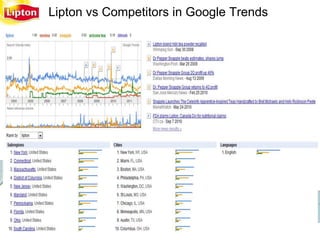

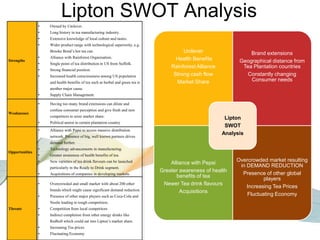
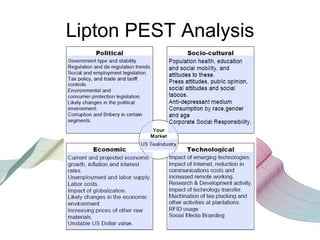
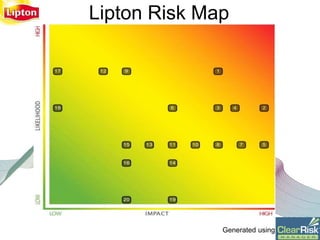
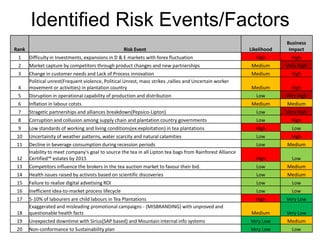
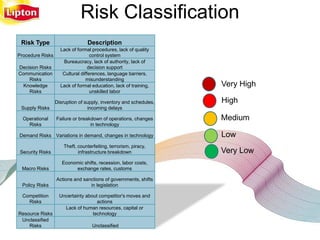


The document provides an overview of Unilever, focusing on its Lipton brand, including its history, supply chain, and risk management strategies. It discusses Lipton's significance as a leading tea brand, its market position, financial performance, and strategic partnerships, as well as risks such as competition and fluctuations in raw material costs. Additionally, it includes a SWOT and PEST analysis to evaluate Lipton's strengths, weaknesses, opportunities, and threats in the competitive tea market.


