Download to read offline
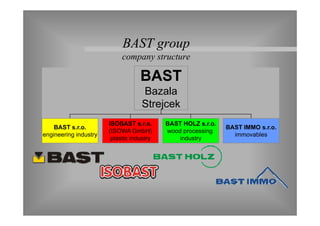
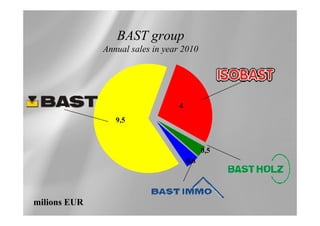
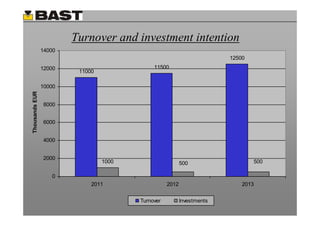
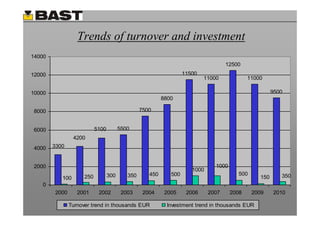
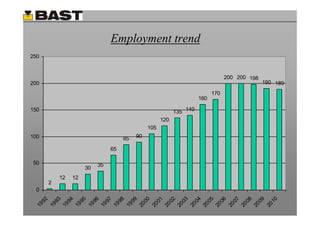
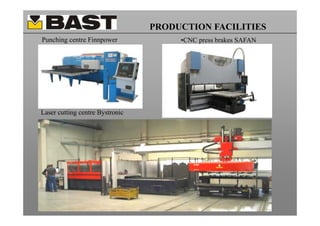
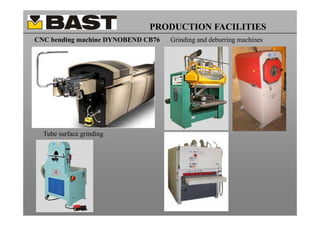
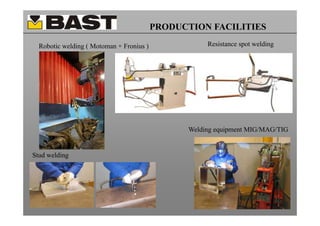
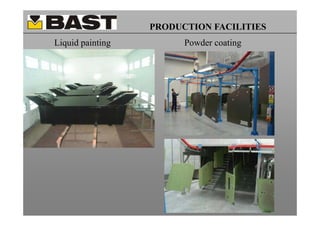
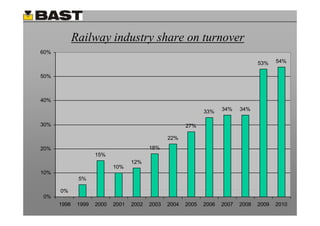
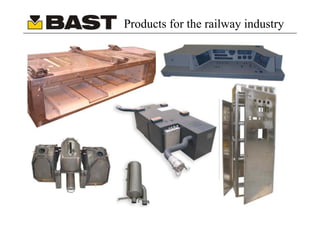
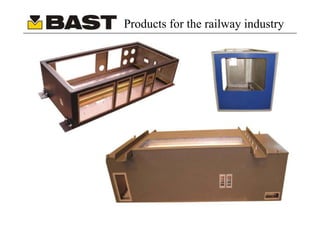
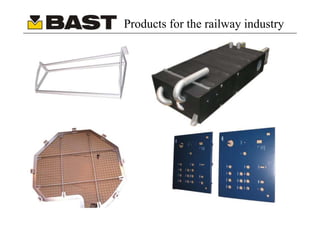
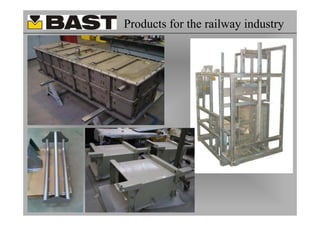

This document summarizes information about the BAST group, including its annual sales, company structure, production facilities, products, markets, and references. The BAST group is an engineering company founded in 1991 that specializes in metal processing and assembly groups for the railway industry. Its annual sales were approximately 10 million EUR in 2010. It has expanded its production capabilities over the years through investments in new machinery. Railway industry customers include Siemens, Alstom, and Bombardier.


