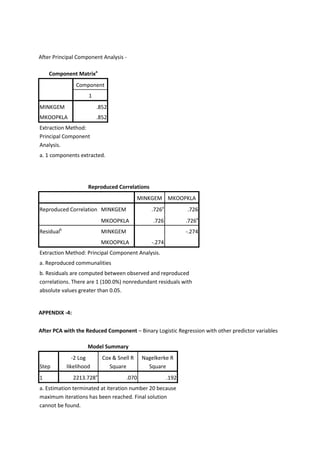
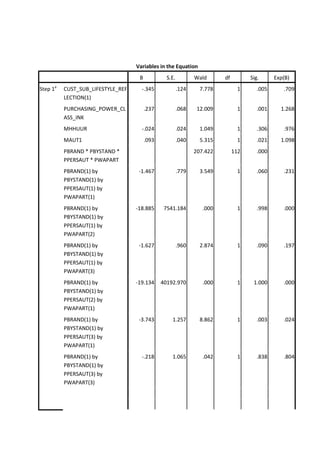
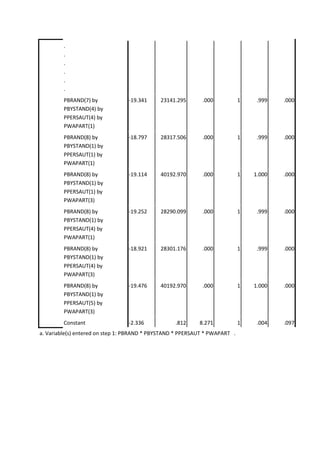
This document provides a statistical analysis of caravan insurance using IBM SPSS. It analyzes a dataset containing 86 variables related to customers of an insurance company. The analysis aims to predict customers interested in caravan insurance and develop a model using the variables. Key steps include:
1) Preparing the data by categorizing the 86 variables into 9 significant predictors related to customers' lifestyle, age, marital status, income, work, and insurance interests.
2) Applying logistic regression to predict the likelihood of customers buying caravan insurance based on the categorized variables. Significant variables are selected in two blocks representing social factors and interaction variables.
3) Further reducing dimensions by principal component analysis to represent correlated variables with a single
Market Segmentation and Targeting with BMWPankaj Chauhan
BMW is one of the best Luxury car Brand available throughout the globe. BMW target only selective segments. This PPT is about different types of Segments available in a genrel market and how BMW has target few of them
Please visit here for voice over presentation https://www.youtube.com/watch?v=_Ha614-Daug
Disclaimer: Lot of material is taken up from Internet. I was not able to give acknowledgment as i lost the track of sources. In case any copyright material used please let me know. Thank You
Cesim SimFirm is a business management simulation game that integrates the functional areas of production, marketing, and logistics. It increases the participants awareness of operating a company from a general management perspective.
Find out more here: https://www.cesim.com/simulations/cesim-simfirm-business-management-simulation-game/
The presentation talks about BMW, its selective target marketing directed towards elites, high advertising costs, changing customer preferences, the need to bring in affordable models and the pros and cons of its strategies.
Marketing strategy
Marketplace live
Marketplace live performance review
Marketplace live assessment of strategy & its execution
Marketplace live lesson learnt
The German Credit data provides variables that help classify observations as good credit vs bad credit. Multiple algorithms such as Logistic Regression, Classification tree, GAM, Neural Net and Linear Discriminant Analysis were used to compare the classification power of the models built.
Solving For The Supply Demand Mis-Match: Strategy and Case Studykelly12504
Presented at ACS 2004 Symposium. ACS is an educational extension of APICS Region XI representing twenty-four APICS chapters from North Carolina, South Carolina
Charlton Bate’s great-grandfather formed the Haverwood Furniture Industry in the early 1900’s. The Company are a medium to high-priced and high-quality producer and sell over 1000 high-quality products in stores nationwide. They are very discerning in selecting merchandising outlets to reflect their products, so they are more of a niche corporation, and do not trade with the usual chain stores or markdown outlets rather they are sellers to High-quality specialty stores and
self-governing furniture department stores (Oliveira, 2009). Their quality furnitures include dressers, tables, bedroom and living room suites, with bedroom and dining room furniture being the majority of sales.
How Social, Mobile, Analytics and Cloud Technologies are Reshaping the Enterprise : By Malcolm Frank, Cognizant Executive Vice President, Strategy & Marketing
http://www.cognizant.com/smac
Dear students get fully solved assignments by professionals
Send your semester & Specialization name to our mail id :
stuffstudy5@gmail.com
or
call us at : 098153-33456
Profiling is a description of a customer or set of customers that includes demographic, geographic, and psychographic characteristics.
Customer profile is needed when you are trying to market your product.
Government insurance and pension scheme as PMSBY, PMJBY and APY are new security based bank products introduced to market.
Insurers today, big and small, are facing disruption due to the increasing deployment of InsurTech technologies and by engaging EY, insurers stand to reap benefits of the latest innovations and insurance products, capitalize on new markets as well as future-proof business for with the help of EY's expertise in this sector.
This study will help analyze the Recitation of the two types of insurance companies
and to take remedial measures in the sphere of their insurance products. Today, in this
liberalized world, in order to sustain good Recitation, the insurance companies have to ensure
quality products at a competitive price. Companies can lower the price of the product by
reducing the cost. Their survival depends upon their policyholder policyholder’s recitation of
public and private sector general insurance industry in Structural Equation Model (SEM)
approach in the chosen study area. The study has to evaluate the policyholder’s perception
towards non-life insurance industry.
Dear students get fully solved assignments
Send your semester & Specialization name to our mail id :
“ help.mbaassignments@gmail.com ”
or
Call us at : 08263069601
Dear students get fully solved assignments
Send your semester & Specialization name to our mail id :
“ help.mbaassignments@gmail.com ”
or
Call us at : 08263069601
Data Mining Applied To Construct Risk Factors For Building Claim on Fire Insu...theijes
The International Journal of Engineering & Science is aimed at providing a platform for researchers, engineers, scientists, or educators to publish their original research results, to exchange new ideas, to disseminate information in innovative designs, engineering experiences and technological skills. It is also the Journal's objective to promote engineering and technology education. All papers submitted to the Journal will be blind peer-reviewed. Only original articles will be published.
The papers for publication in The International Journal of Engineering& Science are selected through rigorous peer reviews to ensure originality, timeliness, relevance, and readability.
Theoretical work submitted to the Journal should be original in its motivation or modeling structure. Empirical analysis should be based on a theoretical framework and should be capable of replication. It is expected that all materials required for replication (including computer programs and data sets) should be available upon request to the authors.
The International Journal of Engineering & Science would take much care in making your article published without much delay with your kind cooperation
A critical discussion on the statement with a BI framework - “Enterprises today have access to large amounts of information from internal as well as external sources. The information
typically comes in either structured or less structured forms. However, enterprises generally do not make the best use of the information they have access to, tending instead to focus on just internal structured data generated by core transactional
systems.”
Climate Impact of Software Testing at Nordic Testing DaysKari Kakkonen
My slides at Nordic Testing Days 6.6.2024
Climate impact / sustainability of software testing discussed on the talk. ICT and testing must carry their part of global responsibility to help with the climat warming. We can minimize the carbon footprint but we can also have a carbon handprint, a positive impact on the climate. Quality characteristics can be added with sustainability, and then measured continuously. Test environments can be used less, and in smaller scale and on demand. Test techniques can be used in optimizing or minimizing number of tests. Test automation can be used to speed up testing.
Unlocking Productivity: Leveraging the Potential of Copilot in Microsoft 365, a presentation by Christoforos Vlachos, Senior Solutions Manager – Modern Workplace, Uni Systems
LF Energy Webinar: Electrical Grid Modelling and Simulation Through PowSyBl -...DanBrown980551
Do you want to learn how to model and simulate an electrical network from scratch in under an hour?
Then welcome to this PowSyBl workshop, hosted by Rte, the French Transmission System Operator (TSO)!
During the webinar, you will discover the PowSyBl ecosystem as well as handle and study an electrical network through an interactive Python notebook.
PowSyBl is an open source project hosted by LF Energy, which offers a comprehensive set of features for electrical grid modelling and simulation. Among other advanced features, PowSyBl provides:
- A fully editable and extendable library for grid component modelling;
- Visualization tools to display your network;
- Grid simulation tools, such as power flows, security analyses (with or without remedial actions) and sensitivity analyses;
The framework is mostly written in Java, with a Python binding so that Python developers can access PowSyBl functionalities as well.
What you will learn during the webinar:
- For beginners: discover PowSyBl's functionalities through a quick general presentation and the notebook, without needing any expert coding skills;
- For advanced developers: master the skills to efficiently apply PowSyBl functionalities to your real-world scenarios.
Communications Mining Series - Zero to Hero - Session 1DianaGray10
This session provides introduction to UiPath Communication Mining, importance and platform overview. You will acquire a good understand of the phases in Communication Mining as we go over the platform with you. Topics covered:
• Communication Mining Overview
• Why is it important?
• How can it help today’s business and the benefits
• Phases in Communication Mining
• Demo on Platform overview
• Q/A
UiPath Test Automation using UiPath Test Suite series, part 5DianaGray10
Welcome to UiPath Test Automation using UiPath Test Suite series part 5. In this session, we will cover CI/CD with devops.
Topics covered:
CI/CD with in UiPath
End-to-end overview of CI/CD pipeline with Azure devops
Speaker:
Lyndsey Byblow, Test Suite Sales Engineer @ UiPath, Inc.
Encryption in Microsoft 365 - ExpertsLive Netherlands 2024Albert Hoitingh
In this session I delve into the encryption technology used in Microsoft 365 and Microsoft Purview. Including the concepts of Customer Key and Double Key Encryption.
Essentials of Automations: The Art of Triggers and Actions in FMESafe Software
In this second installment of our Essentials of Automations webinar series, we’ll explore the landscape of triggers and actions, guiding you through the nuances of authoring and adapting workspaces for seamless automations. Gain an understanding of the full spectrum of triggers and actions available in FME, empowering you to enhance your workspaces for efficient automation.
We’ll kick things off by showcasing the most commonly used event-based triggers, introducing you to various automation workflows like manual triggers, schedules, directory watchers, and more. Plus, see how these elements play out in real scenarios.
Whether you’re tweaking your current setup or building from the ground up, this session will arm you with the tools and insights needed to transform your FME usage into a powerhouse of productivity. Join us to discover effective strategies that simplify complex processes, enhancing your productivity and transforming your data management practices with FME. Let’s turn complexity into clarity and make your workspaces work wonders!
Pushing the limits of ePRTC: 100ns holdover for 100 daysAdtran
At WSTS 2024, Alon Stern explored the topic of parametric holdover and explained how recent research findings can be implemented in real-world PNT networks to achieve 100 nanoseconds of accuracy for up to 100 days.
GraphRAG is All You need? LLM & Knowledge GraphGuy Korland
Guy Korland, CEO and Co-founder of FalkorDB, will review two articles on the integration of language models with knowledge graphs.
1. Unifying Large Language Models and Knowledge Graphs: A Roadmap.
https://arxiv.org/abs/2306.08302
2. Microsoft Research's GraphRAG paper and a review paper on various uses of knowledge graphs:
https://www.microsoft.com/en-us/research/blog/graphrag-unlocking-llm-discovery-on-narrative-private-data/
How to Get CNIC Information System with Paksim Ga.pptxdanishmna97
Pakdata Cf is a groundbreaking system designed to streamline and facilitate access to CNIC information. This innovative platform leverages advanced technology to provide users with efficient and secure access to their CNIC details.
Maruthi Prithivirajan, Head of ASEAN & IN Solution Architecture, Neo4j
Get an inside look at the latest Neo4j innovations that enable relationship-driven intelligence at scale. Learn more about the newest cloud integrations and product enhancements that make Neo4j an essential choice for developers building apps with interconnected data and generative AI.
Sudheer Mechineni, Head of Application Frameworks, Standard Chartered Bank
Discover how Standard Chartered Bank harnessed the power of Neo4j to transform complex data access challenges into a dynamic, scalable graph database solution. This keynote will cover their journey from initial adoption to deploying a fully automated, enterprise-grade causal cluster, highlighting key strategies for modelling organisational changes and ensuring robust disaster recovery. Learn how these innovations have not only enhanced Standard Chartered Bank’s data infrastructure but also positioned them as pioneers in the banking sector’s adoption of graph technology.
GridMate - End to end testing is a critical piece to ensure quality and avoid...ThomasParaiso2
End to end testing is a critical piece to ensure quality and avoid regressions. In this session, we share our journey building an E2E testing pipeline for GridMate components (LWC and Aura) using Cypress, JSForce, FakerJS…
GridMate - End to end testing is a critical piece to ensure quality and avoid...
Caravan insurance data mining statistical analysis
1. K6255 – Knowledge Discovery and Data Mining
Statistical Analysis of Caravan Insurance using IBM SPSS
Muthu Kumaar Thangavelu (G1101765E)
Muthu1@e.ntu.edu.sg
1. INTRODUCTION:
The data set contains information on customers of an insurance company which includes the
product usage data and socio-demographic data derived from zip area codes supplied by the Dutch
data mining company Sentient Machine Research. Our aim is to predict a customer circle who will be
interested in buying caravan insurance and predict a model with the given 86 variable values
representing the socio demographic, education, insurance interests and income levels of customers.
2. STATISTICAL ANALYSIS
2.1. DATA PREPARATION:
2.1.1. ANALYZING AND CATEGORIZING THE VARIABLES:
We extract and analyze the raw variables with labels and try to categorize the variables based on the
understanding of the insurance product and the product buyers. We classify the broad range of 86
variables to significant predictors as below
CUST_SUB_LIFESTYLE_REFLECTION:
Customer sub type MOSTYPE variable has 41 value types which can be categorised under two broad
classes which relate to their age, social class, life style and reflection towards investing or spending
as follows
- Middle and Upper Class, middle aged and senior citizens, high risk cultured liberal investors (8, 9,
12, 13, 23, 25, 36, 2, 3, 4, 5, 15, and 27)
- Distributed age and social class, low risk cultured conservative investors
(1,6,7,10,11,14,16,17,18,19,20,21,22,24,26,28,29,30,31,32,33,34,35,37,38,39,40,41)
CUST_LEVEL_LIFECYCLE:
Average age MGEMLEEF holds 6 types of values which can be categorised into three groups and are
based on family status and age.
- Young, family starters (1)
- Middle aged family men (2, 3, and 4)
- Senior, family men (5, 6)
2. CUST_MAIN_SPEND_INVEST_ATTITUDE:
Customer main type MOSHOOFD can be classified into two groups based on the attitude of
customers towards buying / spending.
- Liberals (1, 2, 5, 6)
- Conservatives (3, 4, 7, 8, 9, 10)
CUST_MARITAL_STAT:
MRELGE, MRELSA, MRELOV, MFALLEEN describe the relationship status of a person which can be
combined into two categories signifying the marital status
- Married (MRELGE)
- Unmarried (MRELSA, MRELOV, MFALLEEN)
CUST_WORK_CATEGORY_PROFILE:
Variables 19 – 24 describe the profile of work category of a person which can be of 2 types.
- Potential income generating high profile work category (MBERHOOG, MBERZELF, MBERMIDD)
- Relatively less Potential Income generating low profile work category (MBERBOER, MBERARBG,
MBERARBO)
CUST_INCOME_LEVEL:
Variables 37 to 41 represent the income of a person which can be grouped into three classes
Low (MINKM30)
Middle (MINK3045, MINK4575)
High (MINK7512, MINK123M)
These can be best represented by a standalone factor depicting the average income (MINKGEM)
CUST_INSURANCE_INTEREST:
Variables 44 to 85 and 35,36 describe the interest of customers towards various insurance policies
in general starting from much needed insurance policies for life, health, disabilities, family/private
accidents and optimal insurance policies for property, small automobiles of individuals (especially
where cost of replacement of damaged parts are as costly as getting a new vehicle) or delivery
vehicles of companies which are operated by third party drivers or an industrial machine to the most
sophisticated policies offering luxury and high safety in the form of private third party insurance
where the insurer pays off the third party even if the insured is at fault and Car, fire and social
security also represent forms of luxury or high sophistication. Hence here is the classification for
both the number and contribution of policies by different customers:
- Individuals opting sophistication and high safety Insurance policies (WAPART, PERSAUT, BRAND,
BYSTAND)
- Firms/Individuals Opting much needed and Optimal Safety Insurance policies (All others)
3. 2.1.2. MAPPING TARGET VARIABLES AS PREDICTORS OF CARAVAN INSURANCE BUYERS:
These predictions have been made with descriptive statistics results of the data set along with the
real world logical themes (Appendix-1)
FACTOR 1: AGE
Middle aged people are more likely to get caravan insurance
FACTOR 2: ATTITUDE TOWARDS SPENDING/ BUYING
People with a liberal attitude predicted by Customer Main type are more likely to get caravan
insurance
FACTOR 3: SOCIAL LIFE STYLE REFLECTOR
People who are modern, professional, middle and upper class and liberal investors of their income
as predicted Customer Sub type are likely to get caravan insurance.
FACTOR 4: MARITAL STATUS
Married Family Men are more likely to buy caravan insurance
FACTOR 5: WORK CATEGORY PROFILE
Potential income generating high profile work category people are more likely to get the insurance.
FACTOR 6: INCOME LEVEL
Average, middle scale Income generators are more likely to get caravan insurance
Here the variable MINKGEM acts as a standalone factor to represent the average income of a
person.
FACTOR 7: INSURANCE INTEREST
Individuals opting highly sophisticated high safety Insurance policies are more likely to buy caravan
insurance
FACTOR 8: PURCHASING POWER CLASS
Individuals who purchase or afford to buy high cost products as caravan insurance is not a need but
a luxury which is aimed at the average and high income generators.
FACTOR 9: RENTED HOME RESIDENTS
Residents who stay in rented home might have their own house in their native or settled elsewhere
in a rented home for work and family convenience or might not have enough savings for investing on
4. home. All these individuals are more likely to be interested in caravan insurance as they are in need
of a local Asset.
FACTOR 10: CAR OWNERSHIP:
People who own a car signify their buying power, average income and also their interest in cars and
driving and can be interested in buying a caravan and its insurance scheme.
People who own more than one car are unusual and must be car freaks who will be considering the
best quality and fashion symbolizing new models; Caravans are most unlikely to suit their needs.
2.2. DATA TRANSFORMATION
2.2.1. INDEPENDENCE OF DEPENDENT VARIABLES WITH RESPECT TO PREDICTION PARAMETERS:
CUSTOMER SUB TYPE (MOSTYPE) variable represents a combination of the age factor,
spending/buying attitude and social life style. Hence it can be used as a standalone factor for
predicting the potential buyers.
MARRIED PEOPLE are represented by MRELGE and the rest of the variables describing relationship
status can be ignored
2.2.2. INTERACTION VARIABLES DEFINITION FOR INDEPENDENT REPRESENTATION OF A
COMBINATION:
PURCHASING POWER CLASS * AVERAGE INCOME
Work Category, Income Level and purchasing power class can be combined and accurately predicted
as Average Income generators with a high profile work category belonging to the purchasing power
class category represented by the interaction of Independent variables Average Income and
Purchasing Power Class.
PWAPART*PBRAND*PBYSTAND*PERSAUT
People who are already interested in buying sophisticated insurance policies are most likely to
choose caravan insurance. Interaction or Cross Product of Contribution to fire, third party, social
security and car insurance represents a high probability of getting caravan insurance
2.2.3. DIMENSION REDUCTION BY PRINCIPAL COMPONENT ANALYSIS:
Almost all variables used in the final model are significantly independent predicting different factors
of the caravan insurance buying factor.
CUST_SUB_LIFESTYLE_REFLECTION – Social Lifestyle and Attitude towards Spending/investing
MRELGE – Marital Status
MAUT1 – Single Car Owner
MHHUUR – Rented Home Resident
5. PBRAND, PPERSAUT, PBYSTAND, PWAPART – Contribution towards different sophisticated and high
safety Insurance policies.
The two factors with significant correlation are MINKGEM and MKOOPKLA where there can be a
bigger overlap in the population logically. It means that Potential Purchasing Class should have a
high or middle scaled average Income which form most part of MINIKGEM variable. So these two
dimensions can be reduced into one that represents high orthogonality of the variable.
Factor Analysis was carried out and the extracted component was rotated and coded as a regression
variable in the data set.
This new variable PURCHASING_POWER_CLASS_INK represents the reduced component of
MINKGEM and MKOOPKLA through PCA.
The factor analysis results are attached in Appendix-3
2.3. DATA ANALYSIS:
2.3.1. APPLYING LOGISTIC REGRESSION: (WITHOUT INCLUDING THE VARIABLE REDUCED BY PCA)
2.3.1.1. CHOSEN VARIABLES REPRESENTING INDEPENDENT FACTORS TO PREDICT THE CARAVAN
INSURANCE BUYERS:
The predictor variables are represented in 2 blocks of covariates for the dependent variable,
CARAVAN (0- Customers will not buy, 1- will buy)
BLOCK 1:
CUST_SUB_LIFESTYLE_ATTITUDE (Social Life Style Reflector)
MRELEGE (Marital Status)
MAUT1 (Car Ownership factor – Single Car Indicating potential income generation)
MHHUUR (House owners –Potential Earning Factor)
BLOCK 2: (INTERACTION VARIABLES)
PBRAND, PBYSTAND, PPERSAUT, PWAPART (Customer Insurance Interest factor on sophisticated and
high Safety policies)
MKOOPKLA, MINKGEM (Purchasing Power Class with Average Income Level factor)
Method: FORWARD LR
Cut Off Value: 0.5
Probability Entry Criteria: 0.05
Probability Exit Criteria: 0.10
6. 2.3.1.2. CHOOSING THE CATEGORICAL VARIABLES:
The variables which represent a category of users internally are to be marked as categorical in a
logistic regression
In our case
Contribution to various insurance policies (PWAPART, PPERSAUT, PBRAND, and PBYSTAND)
represents internal categories such as high, average and low. They are not evenly distributed across
their base value types as seen in the fig1.3, 1.4, 1.5, 1.6 and hence they can be indicated as
categorical.
Customer Sub type (CUST_SUB_LIFESTYLE_REFLECTION) representing two main categories - Middle
and Upper Class, middle aged and senior citizens, high risk cultured liberal investors and Distributed
age and social class, low risk cultured conservative investors and these values are not evenly spread
as seen in fig 1.2 and they can be treated as categorical.
All other variables are continuous which contain values corresponding to single category which it
stands for. MAUT1 (Owning a Single Car), MRELGE (Married), MHHUUR (Rented Home Residents),
MINKGEM (Average Income), MKOOPKLA (Purchasing Power Class)
The Regression Converged in two steps in block 2 and the prediction model is generated.
The model summary and predictor equation is described in the Appendix-2.
2.3.1.3. GENERATED EQUATION BY LOGISTIC REGRESSION FOR PREDICTING POTENTIAL CARAVAN
INSURANCE BUYERS:
0.073 (MAUT1) +0.069 (MRELGE) – 0.018(MHHUUR) -0.376 (CUST_SUB_LIFESTYLE_REFLECTION(1))
+ 0.016(MINKGEM by MKOOPKLA) + (PBRAND by PBYSTAND by PPERSAUT by PWAPART) – 2.924
Accuracy of the model as predicted by the Nagelkerke R square value is 19.3%
2.3.2. APPLYING LOGISTIC REGRESSION: (WITH THE VARIABLE REDUCED BY PCA)
With the new component extracted with PCA, PURCHASING_POWER_CLASS_INK, we can apply
logistic regression along with other variables.
The regression converged in the first step.
The predictor model is almost the same as the one above without the reduced component through
PCA and is given by the equation
0.093 (MAUT1) +0.069 (MRELGE) – 0.024(MHHUUR) -0.345 (CUST_SUB_LIFESTYLE_REFLECTION (1))
+ 0.237(PURCHASING_POWER_CLASS_INK) + (PBRAND by PBYSTAND by PPERSAUT by PWAPART) –
2.336
The model also has a high degree of accuracy with a Nagelkerke R square percentage of 19.2%
The model summary and predictor equation is described in the Appendix-4.
7. 3. MODEL INSIGHTS AND CONCLUSION:
The understanding and classification of the initial variables have been thoroughly done to reflect
properties of socio demographic, education, lifestyle, income, car and insurance interests with
relevance to the product type. The logically predicted significant variables have then been analyzed
based on the descriptive statistics of the target variables in the data set using IBM SPSS. Dimension
Reduction, Variable Recoding and Interaction Variables definition have been done to represent
accurate and independent predictors. The logistic regression then gives the required predictor
model.
The model should be broad in prediction with appropriate real world logical reasons for categorizing
and recoding of variables so that it holds good for most possible cases and avoids OVERFITTING.
Appendix -1
DESCRIPTIVE STATISTICS – CROSS TAB RESULTS
Fig 1.0. Rental Home Residents Caravan Insurance Buying Pattern
8. Fig 1.1. Purchasing Power Class Caravan Insurance Buying Pattern
Fig.1.2. Social Lifestyle based Caravan Insurance Buying Pattern (RECODED VARIABLE)
1 – Middle and Upper Class, middle aged and senior citizens, high risk cultured liberal investors
0 - Distributed age and social class, low risk cultured conservative investors
9. Fig 1.3. Third Party Insurance Buyers and Caravan Insurance buyers
Fig 1.4. Car Insurance Buyers and Caravan Insurance Buyers
10. Fig 1.5. Fire Insurance Contribution and Caravan Insurance Interest
Fig 1.6. Social Security Insurance Vs Caravan Insurance Buyers
11. Appendix -2: (Logistic Regression Summary and Last Convergence Results without PCA Component)
Model Summary
-2 Log Cox & Snell R Nagelkerke R
Step likelihood Square Square
1 2220.272a .069 .189
2 2210.325a .070 .193
a. Estimation terminated at iteration number 20 because
maximum iterations has been reached. Final solution
cannot be found.
Converged Predictors and corresponding Coefficients in
binary logistic regression ( BLOCK 2 - Second Step )
Variables in the Equation
B S.E. Wald df Sig. Exp(B)
.
.
12. .
.
The Cross Product continuing up to (4x4 combinations)
a. Variable(s) entered on step 1: PBRAND * PBYSTAND * PPERSAUT * PWAPART .
b. Variable(s) entered on step 2: MINKGEM * MKOOPKLA .
Appendix -3 (Logistic Regression with reduced component with PCA)
Initial Components (Average Income and Purchasing Power Class) Vs Principle Component Extracted
APPENDIX -3:
PRINCIPLE COMPONENT ANALYSIS:
FACTOR ANALYSIS:
Correlation Matrix
MINKGEM MKOOPKLA
Correlation MINKGEM 1.000 .452
MKOOPKLA .452 1.000
Sig. (1-tailed) MINKGEM .000
MKOOPKLA .000
13. After Principal Component Analysis -
Component Matrixa
Component
1
MINKGEM .852
MKOOPKLA .852
Extraction Method:
Principal Component
Analysis.
a. 1 components extracted.
Reproduced Correlations
MINKGEM MKOOPKLA
Reproduced Correlation MINKGEM .726a .726
MKOOPKLA .726 .726a
Residualb MINKGEM -.274
MKOOPKLA -.274
Extraction Method: Principal Component Analysis.
a. Reproduced communalities
b. Residuals are computed between observed and reproduced
correlations. There are 1 (100.0%) nonredundant residuals with
absolute values greater than 0.05.
APPENDIX -4:
After PCA with the Reduced Component – Binary Logistic Regression with other predictor variables
Model Summary
-2 Log Cox & Snell R Nagelkerke R
Step likelihood Square Square
1 2213.728a .070 .192
a. Estimation terminated at iteration number 20 because
maximum iterations has been reached. Final solution
cannot be found.
14. Variables in the Equation
B S.E. Wald df Sig. Exp(B)
Step 1a CUST_SUB_LIFESTYLE_REF -.345 .124 7.778 1 .005 .709
LECTION(1)
PURCHASING_POWER_CL .237 .068 12.009 1 .001 1.268
ASS_INK
MHHUUR -.024 .024 1.049 1 .306 .976
MAUT1 .093 .040 5.315 1 .021 1.098
PBRAND * PBYSTAND * 207.422 112 .000
PPERSAUT * PWAPART
PBRAND(1) by -1.467 .779 3.549 1 .060 .231
PBYSTAND(1) by
PPERSAUT(1) by
PWAPART(1)
PBRAND(1) by -18.885 7541.184 .000 1 .998 .000
PBYSTAND(1) by
PPERSAUT(1) by
PWAPART(2)
PBRAND(1) by -1.627 .960 2.874 1 .090 .197
PBYSTAND(1) by
PPERSAUT(1) by
PWAPART(3)
PBRAND(1) by -19.134 40192.970 .000 1 1.000 .000
PBYSTAND(1) by
PPERSAUT(2) by
PWAPART(1)
PBRAND(1) by -3.743 1.257 8.862 1 .003 .024
PBYSTAND(1) by
PPERSAUT(3) by
PWAPART(1)
PBRAND(1) by -.218 1.065 .042 1 .838 .804
PBYSTAND(1) by
PPERSAUT(3) by
PWAPART(3)
15. .
.
.
.
.
.
PBRAND(7) by -19.341 23141.295 .000 1 .999 .000
PBYSTAND(4) by
PPERSAUT(4) by
PWAPART(1)
PBRAND(8) by -18.797 28317.506 .000 1 .999 .000
PBYSTAND(1) by
PPERSAUT(1) by
PWAPART(1)
PBRAND(8) by -19.114 40192.970 .000 1 1.000 .000
PBYSTAND(1) by
PPERSAUT(1) by
PWAPART(3)
PBRAND(8) by -19.252 28290.099 .000 1 .999 .000
PBYSTAND(1) by
PPERSAUT(4) by
PWAPART(1)
PBRAND(8) by -18.921 28301.176 .000 1 .999 .000
PBYSTAND(1) by
PPERSAUT(4) by
PWAPART(3)
PBRAND(8) by -19.476 40192.970 .000 1 1.000 .000
PBYSTAND(1) by
PPERSAUT(5) by
PWAPART(3)
Constant -2.336 .812 8.271 1 .004 .097
a. Variable(s) entered on step 1: PBRAND * PBYSTAND * PPERSAUT * PWAPART .