Download to read offline
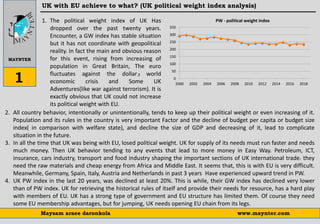

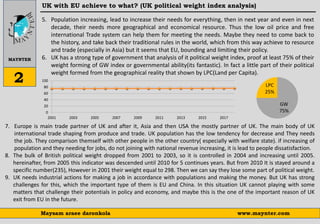
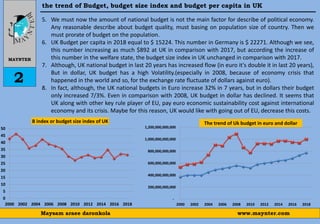

The UK political weight index has significantly declined over the past two decades, impacted by factors such as population growth, economic fluctuations, and challenges posed by EU membership, resulting in a loss of political influence. Despite a strong governmental weight index, the UK's industrial and economic actions are hindered by EU constraints, compelling the nation to seek alternative resources and trade partnerships. The analysis suggests that while current trends indicate a downward trajectory for both political weight and governance indices, the long-term effects of Brexit may lead to structural changes in the UK's political and economic landscape.


