Download to read offline


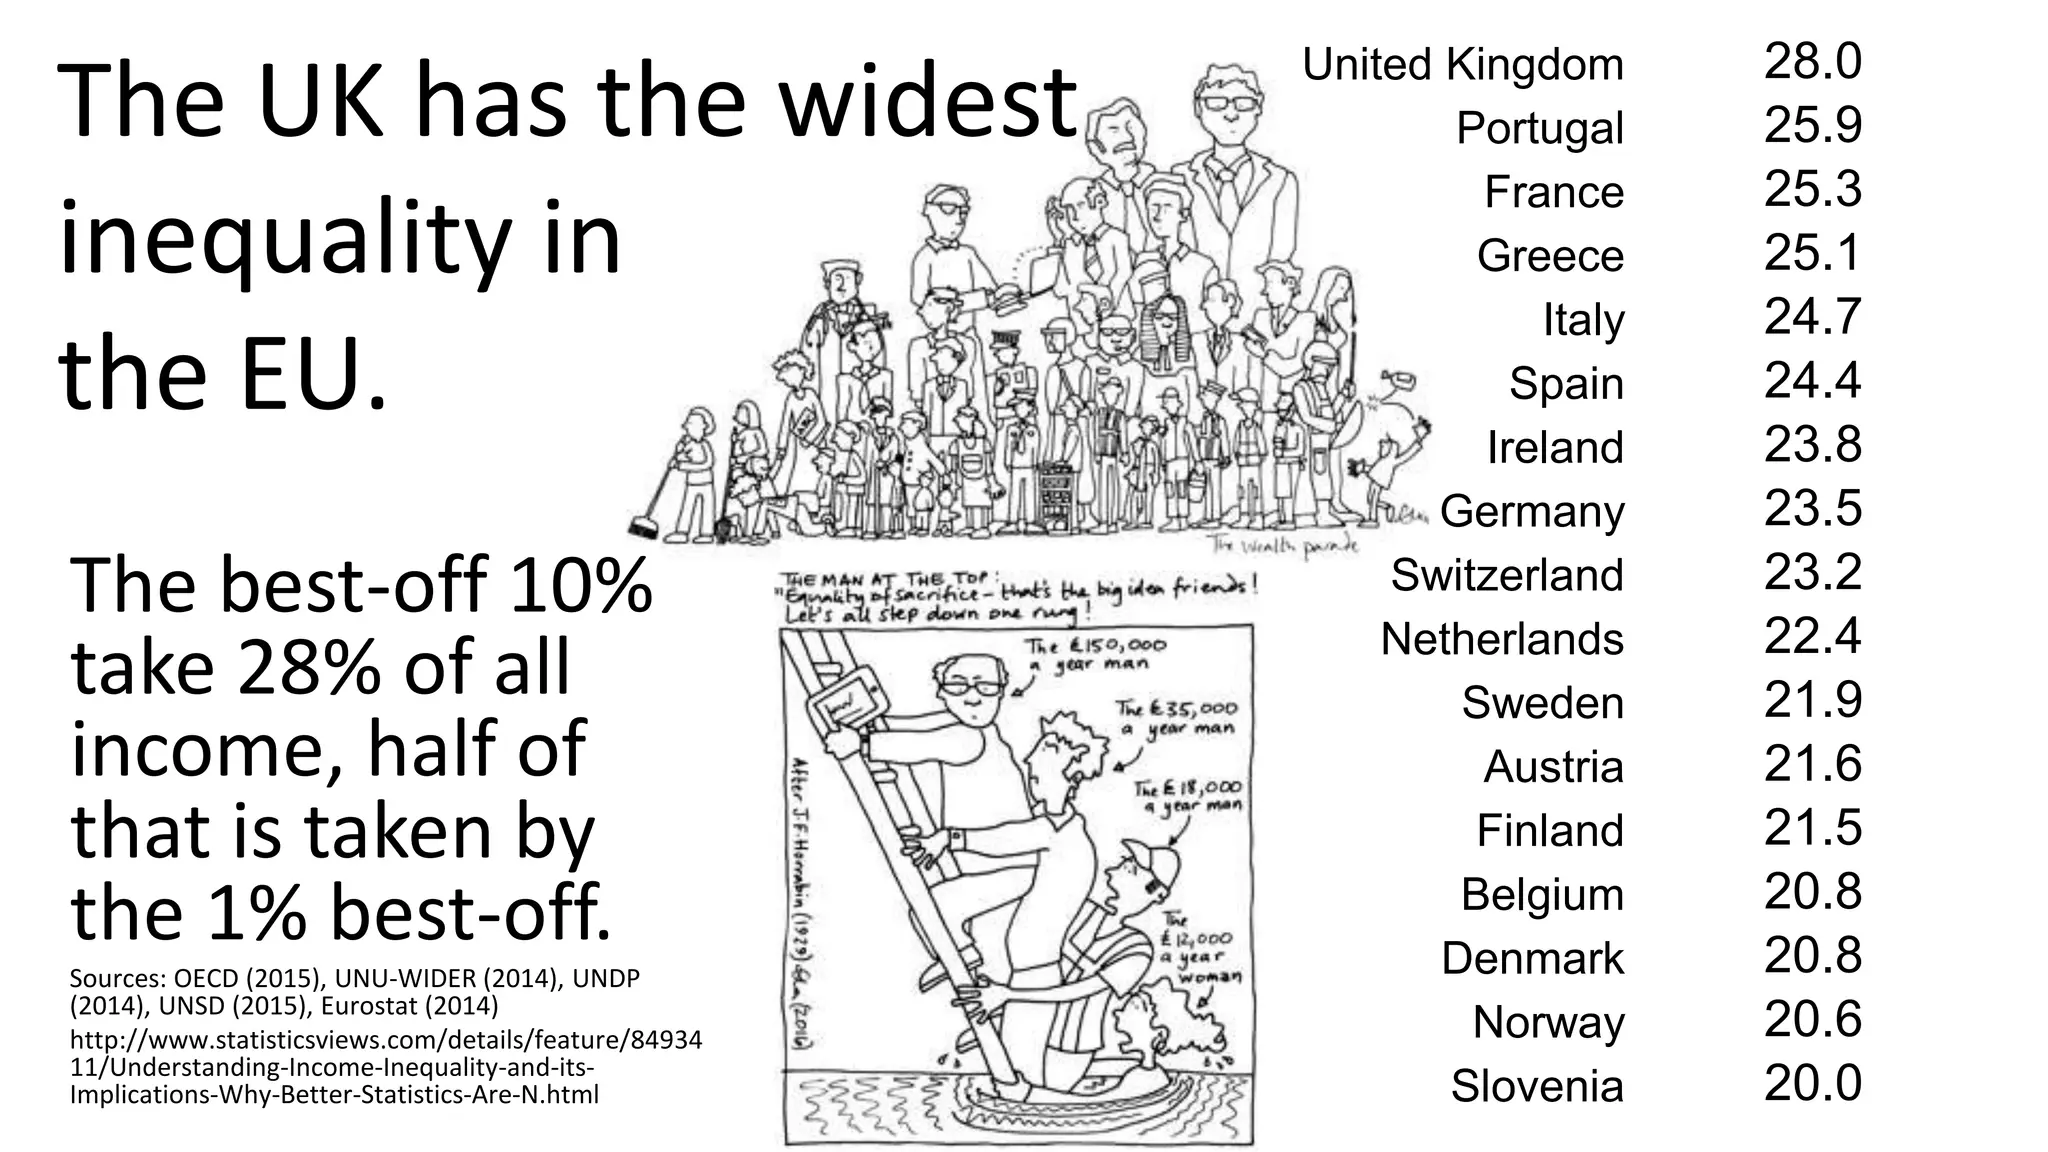


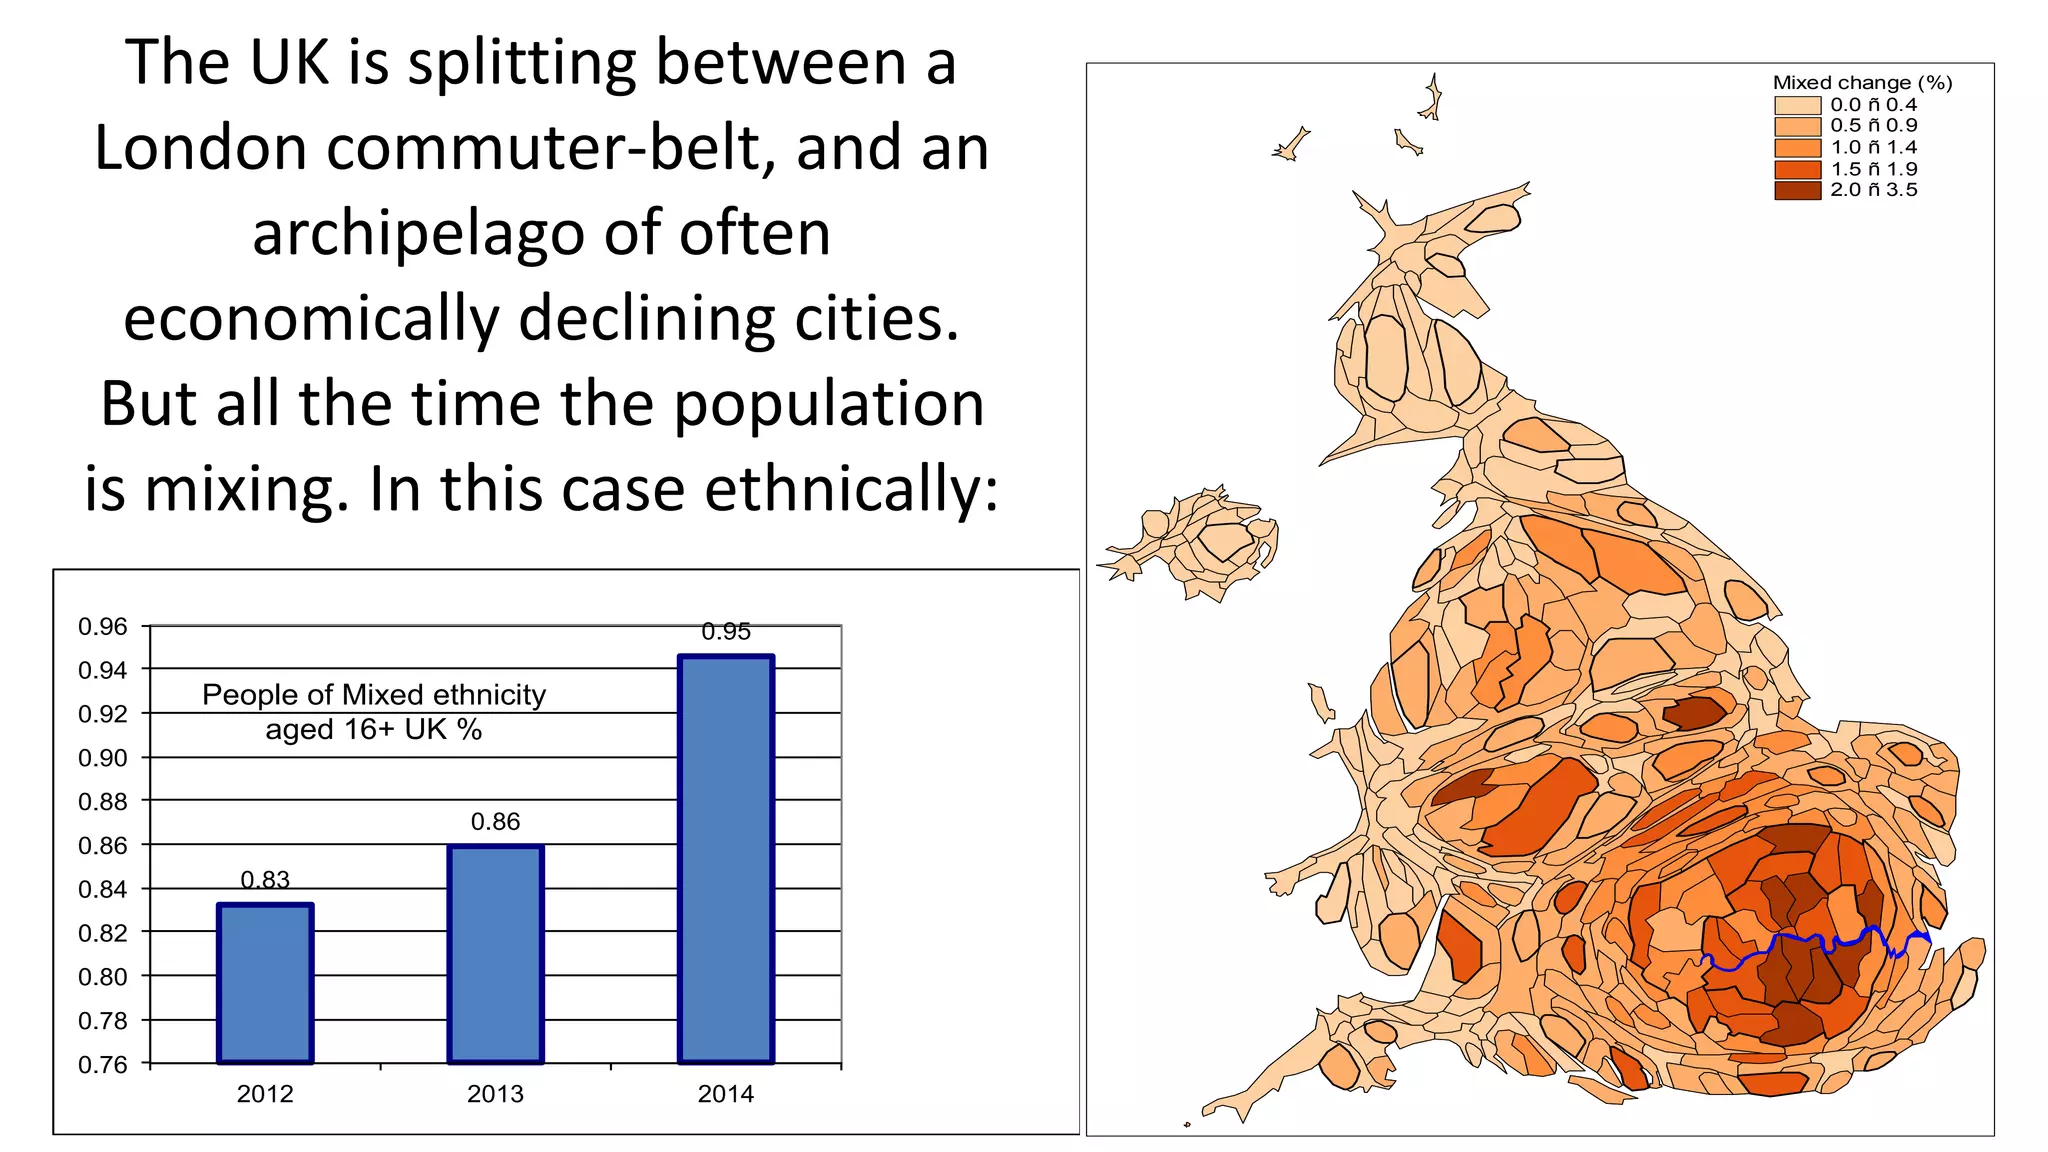
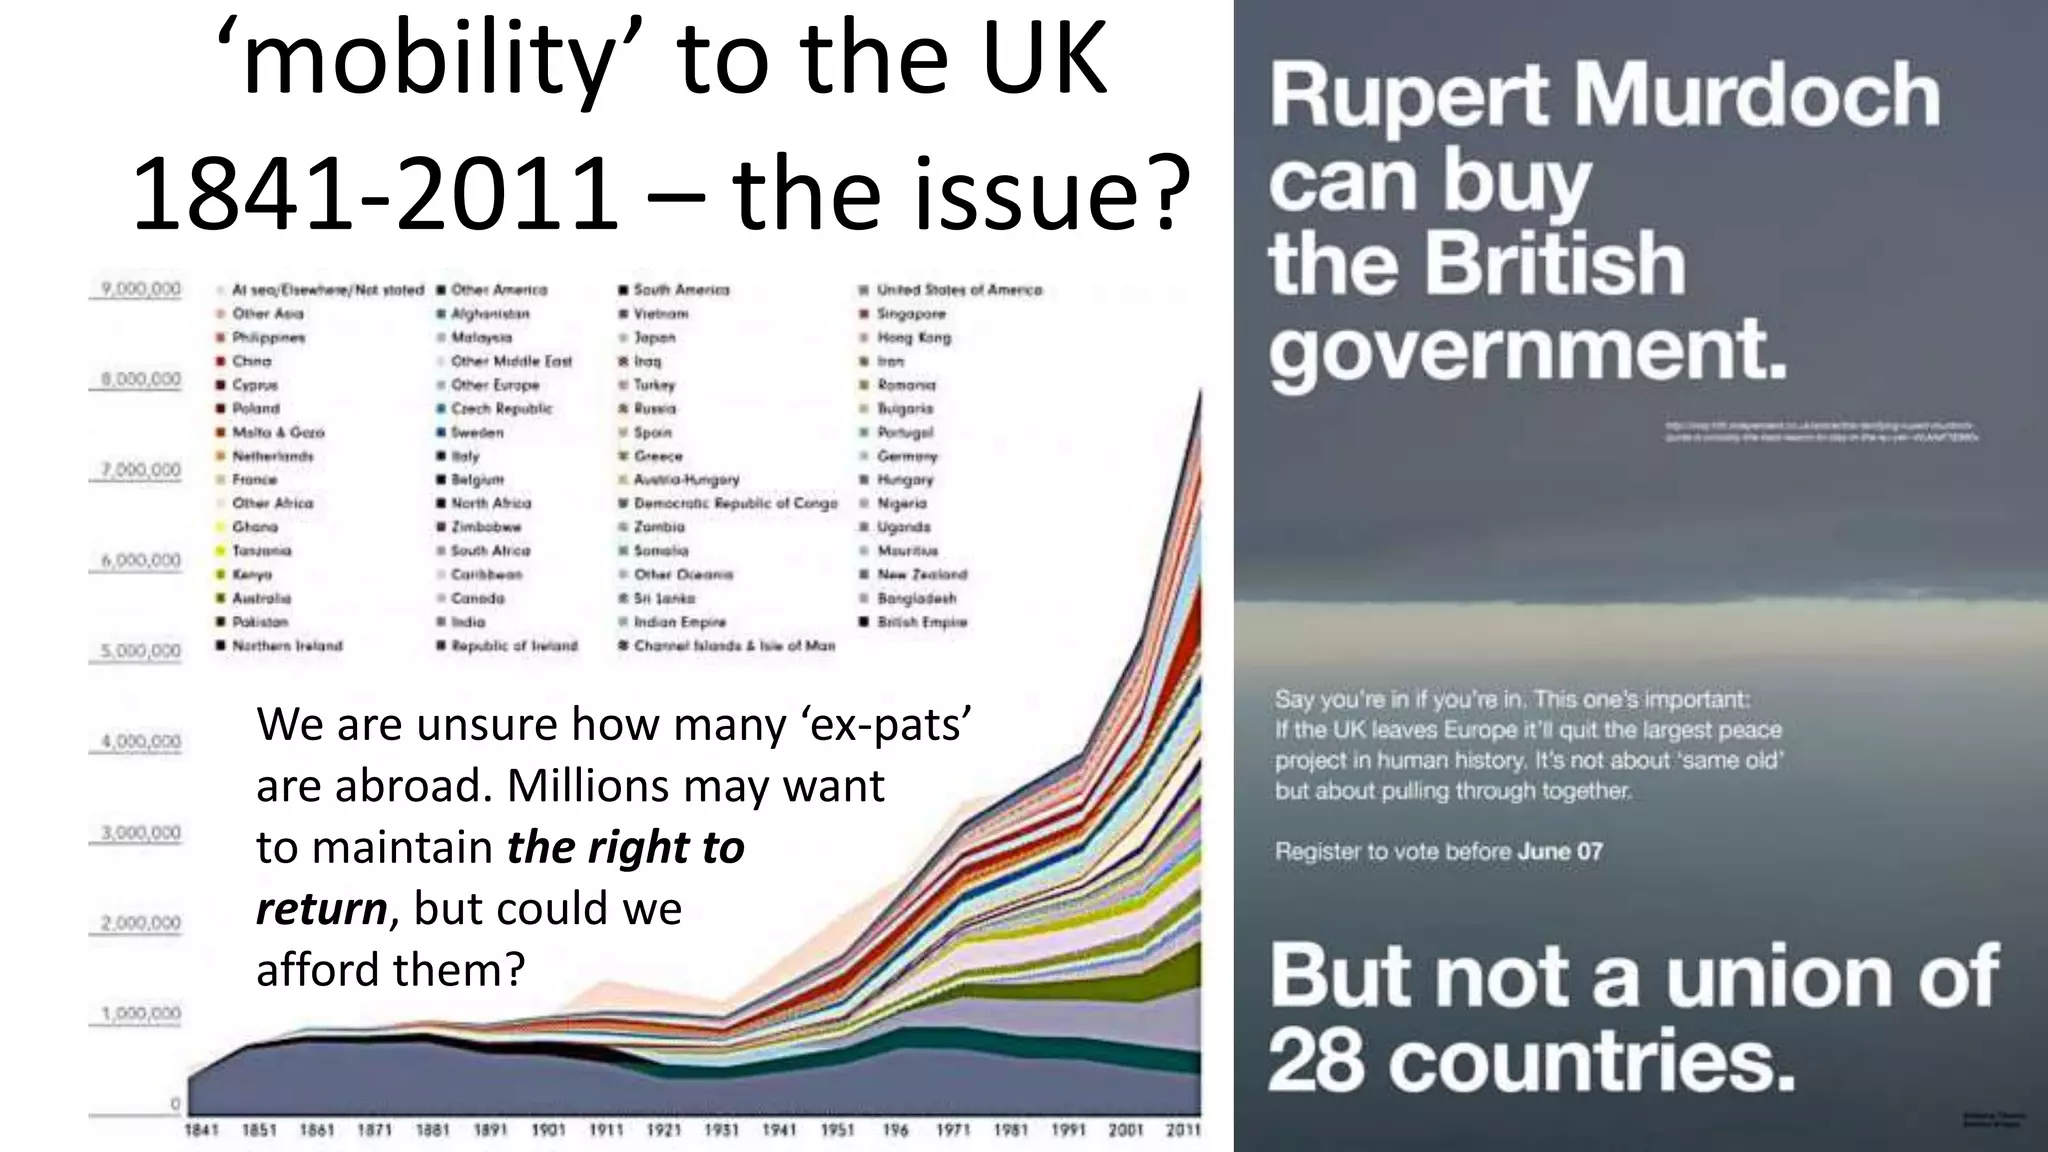
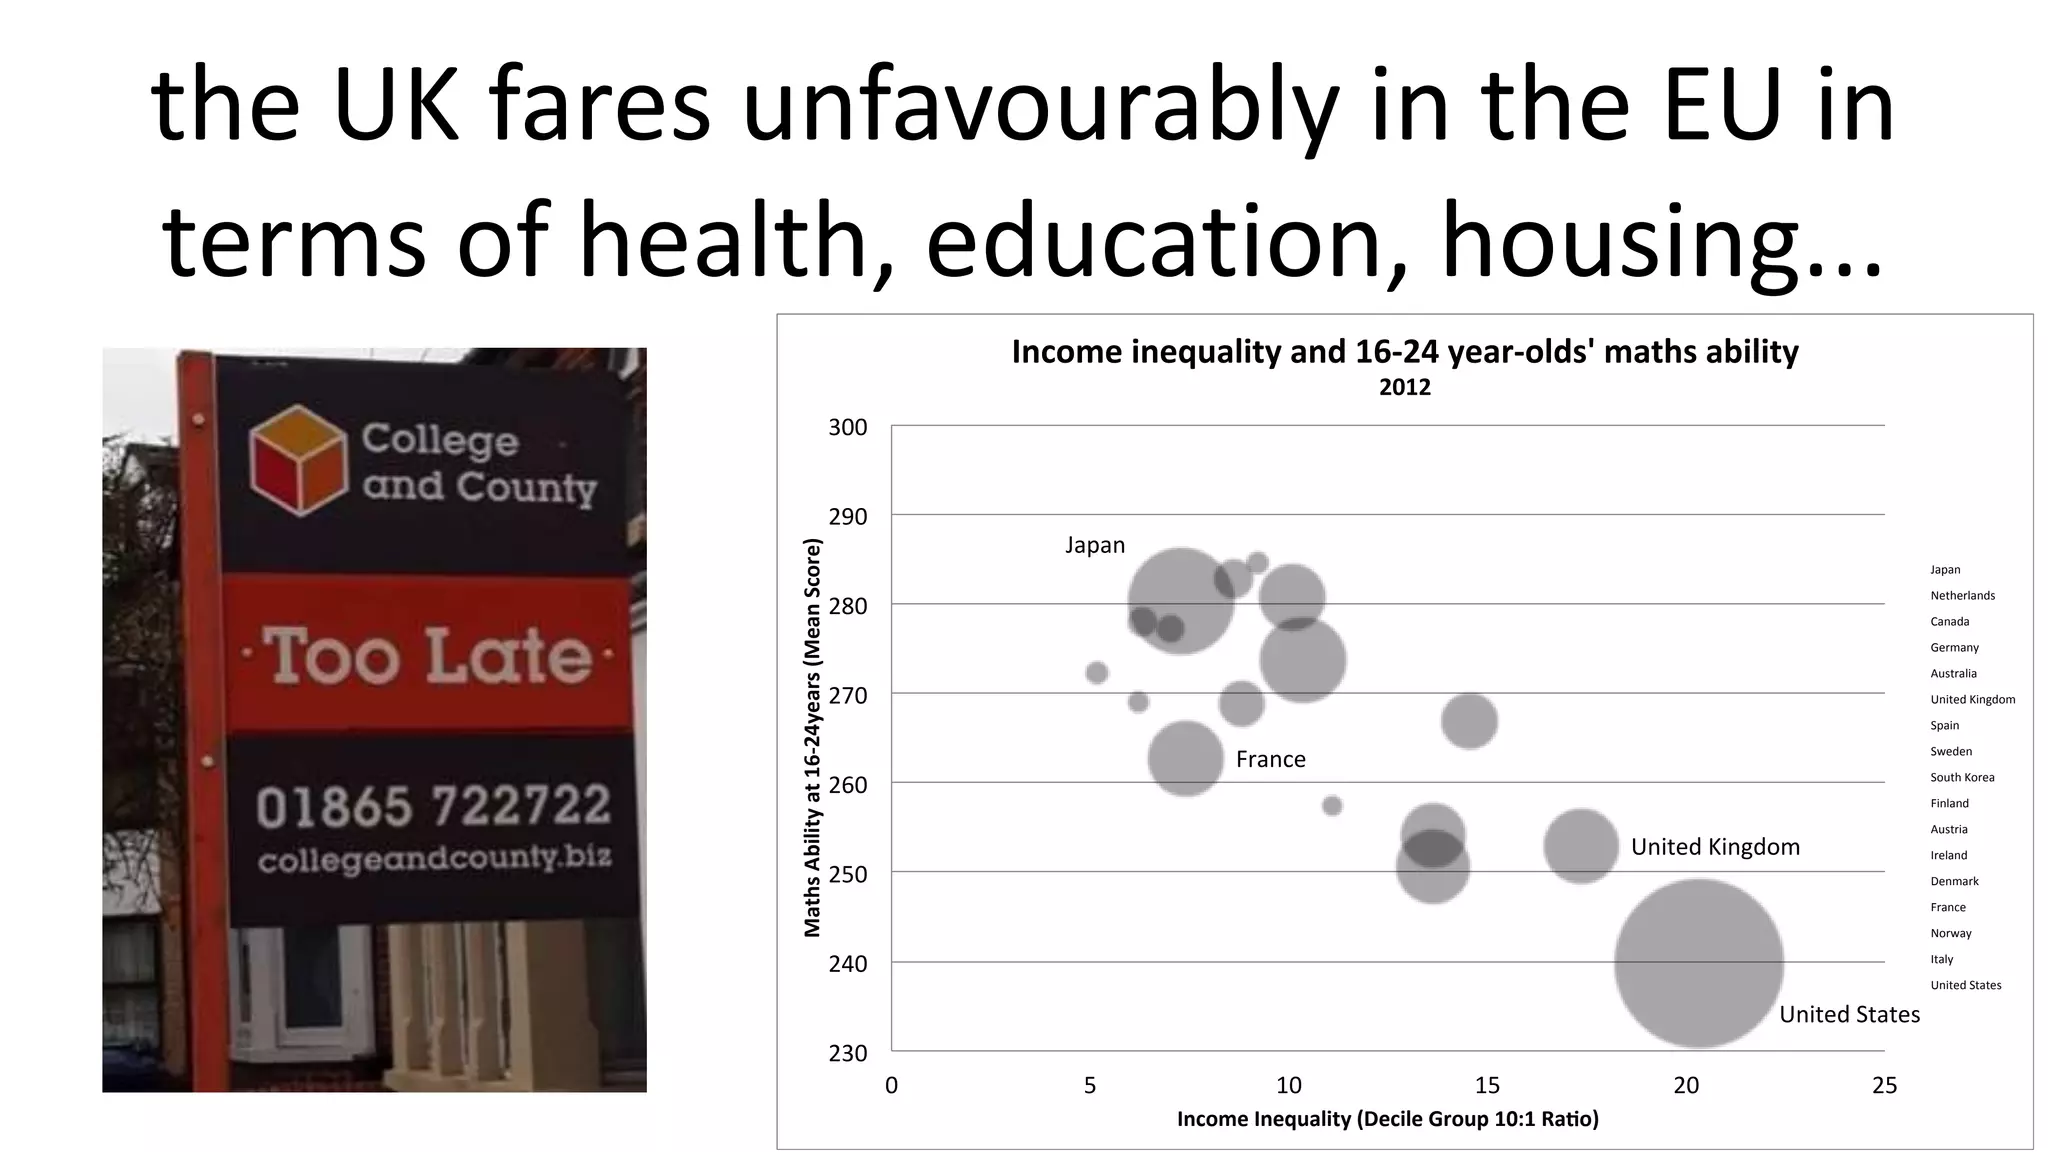

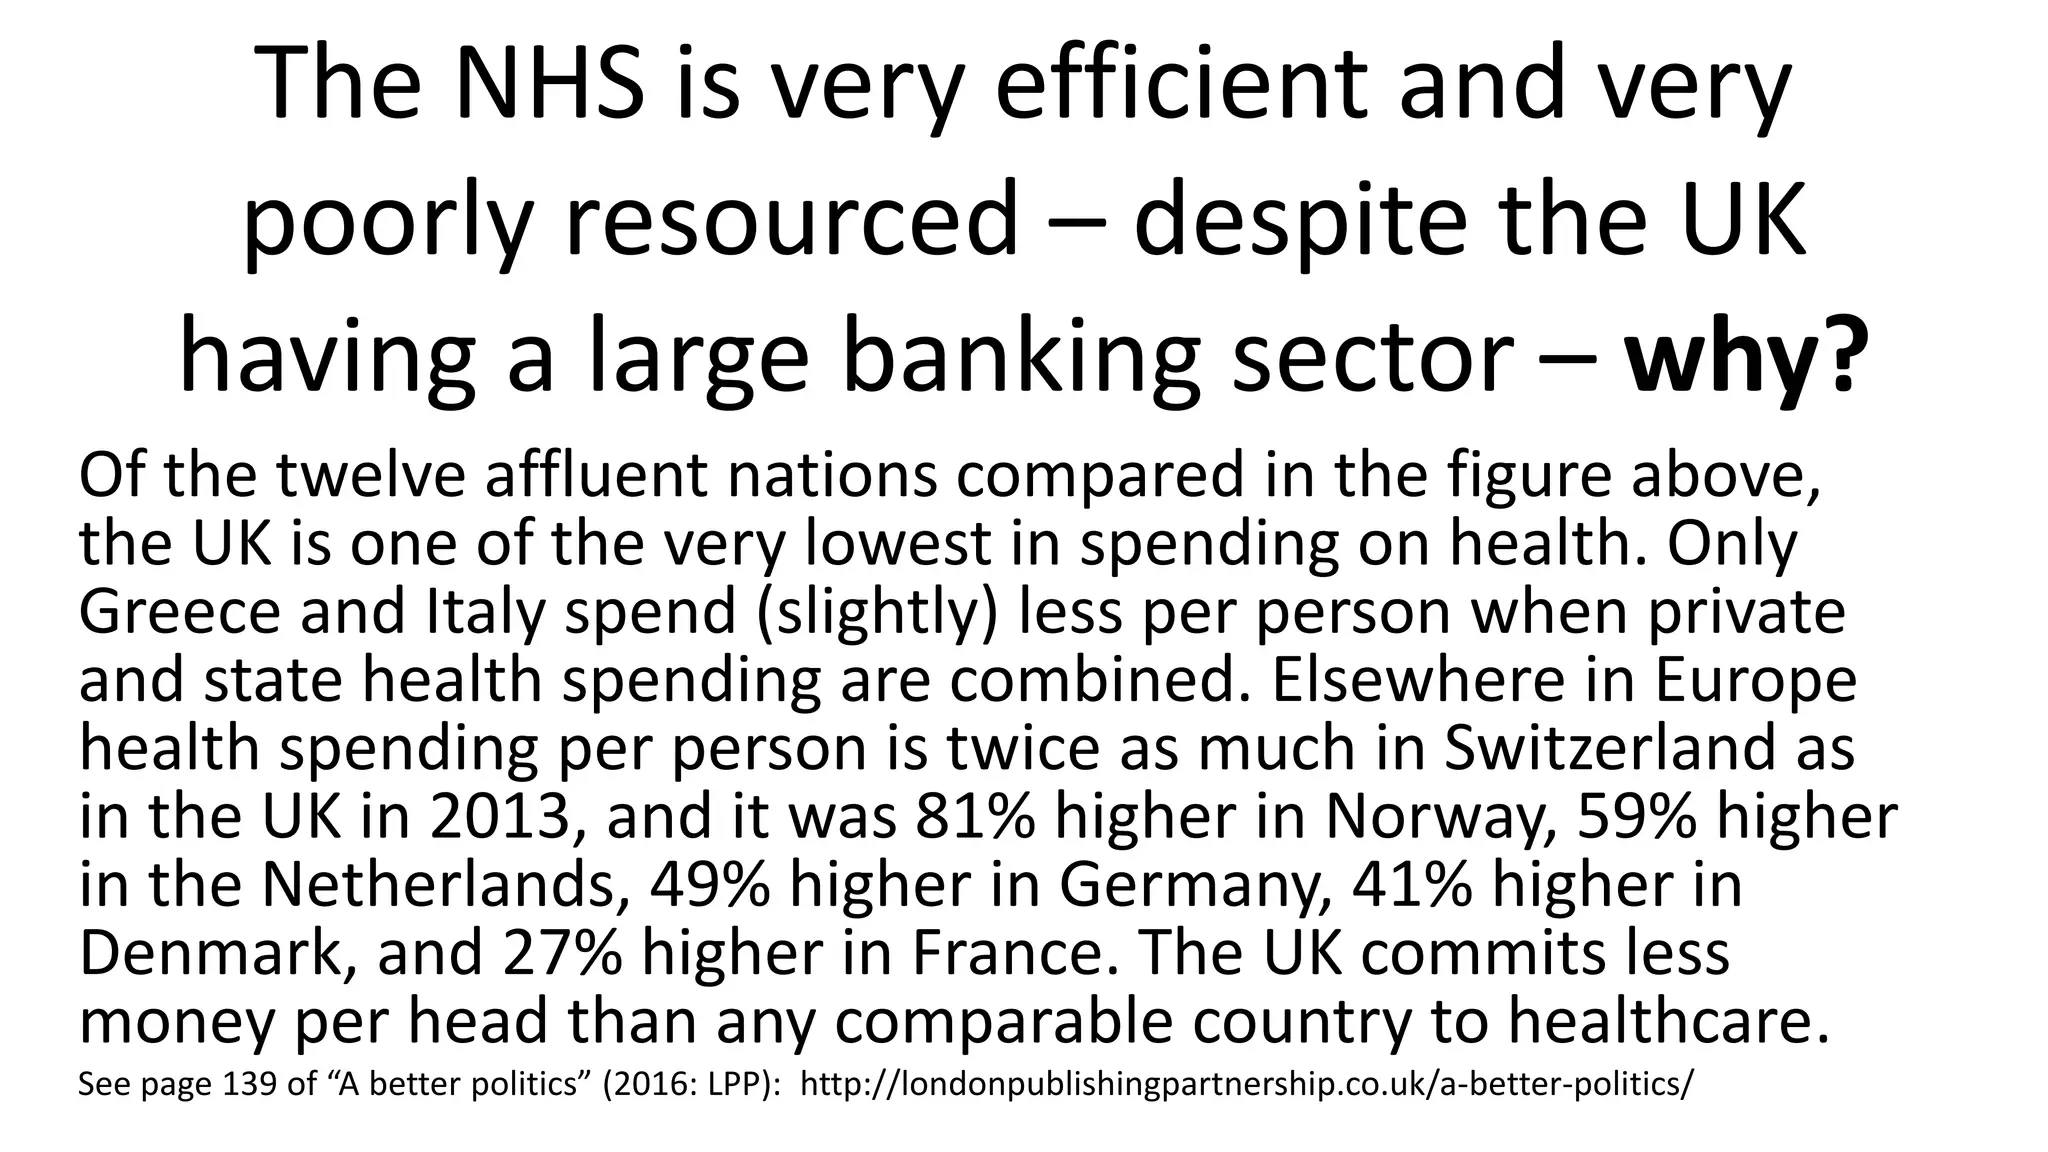

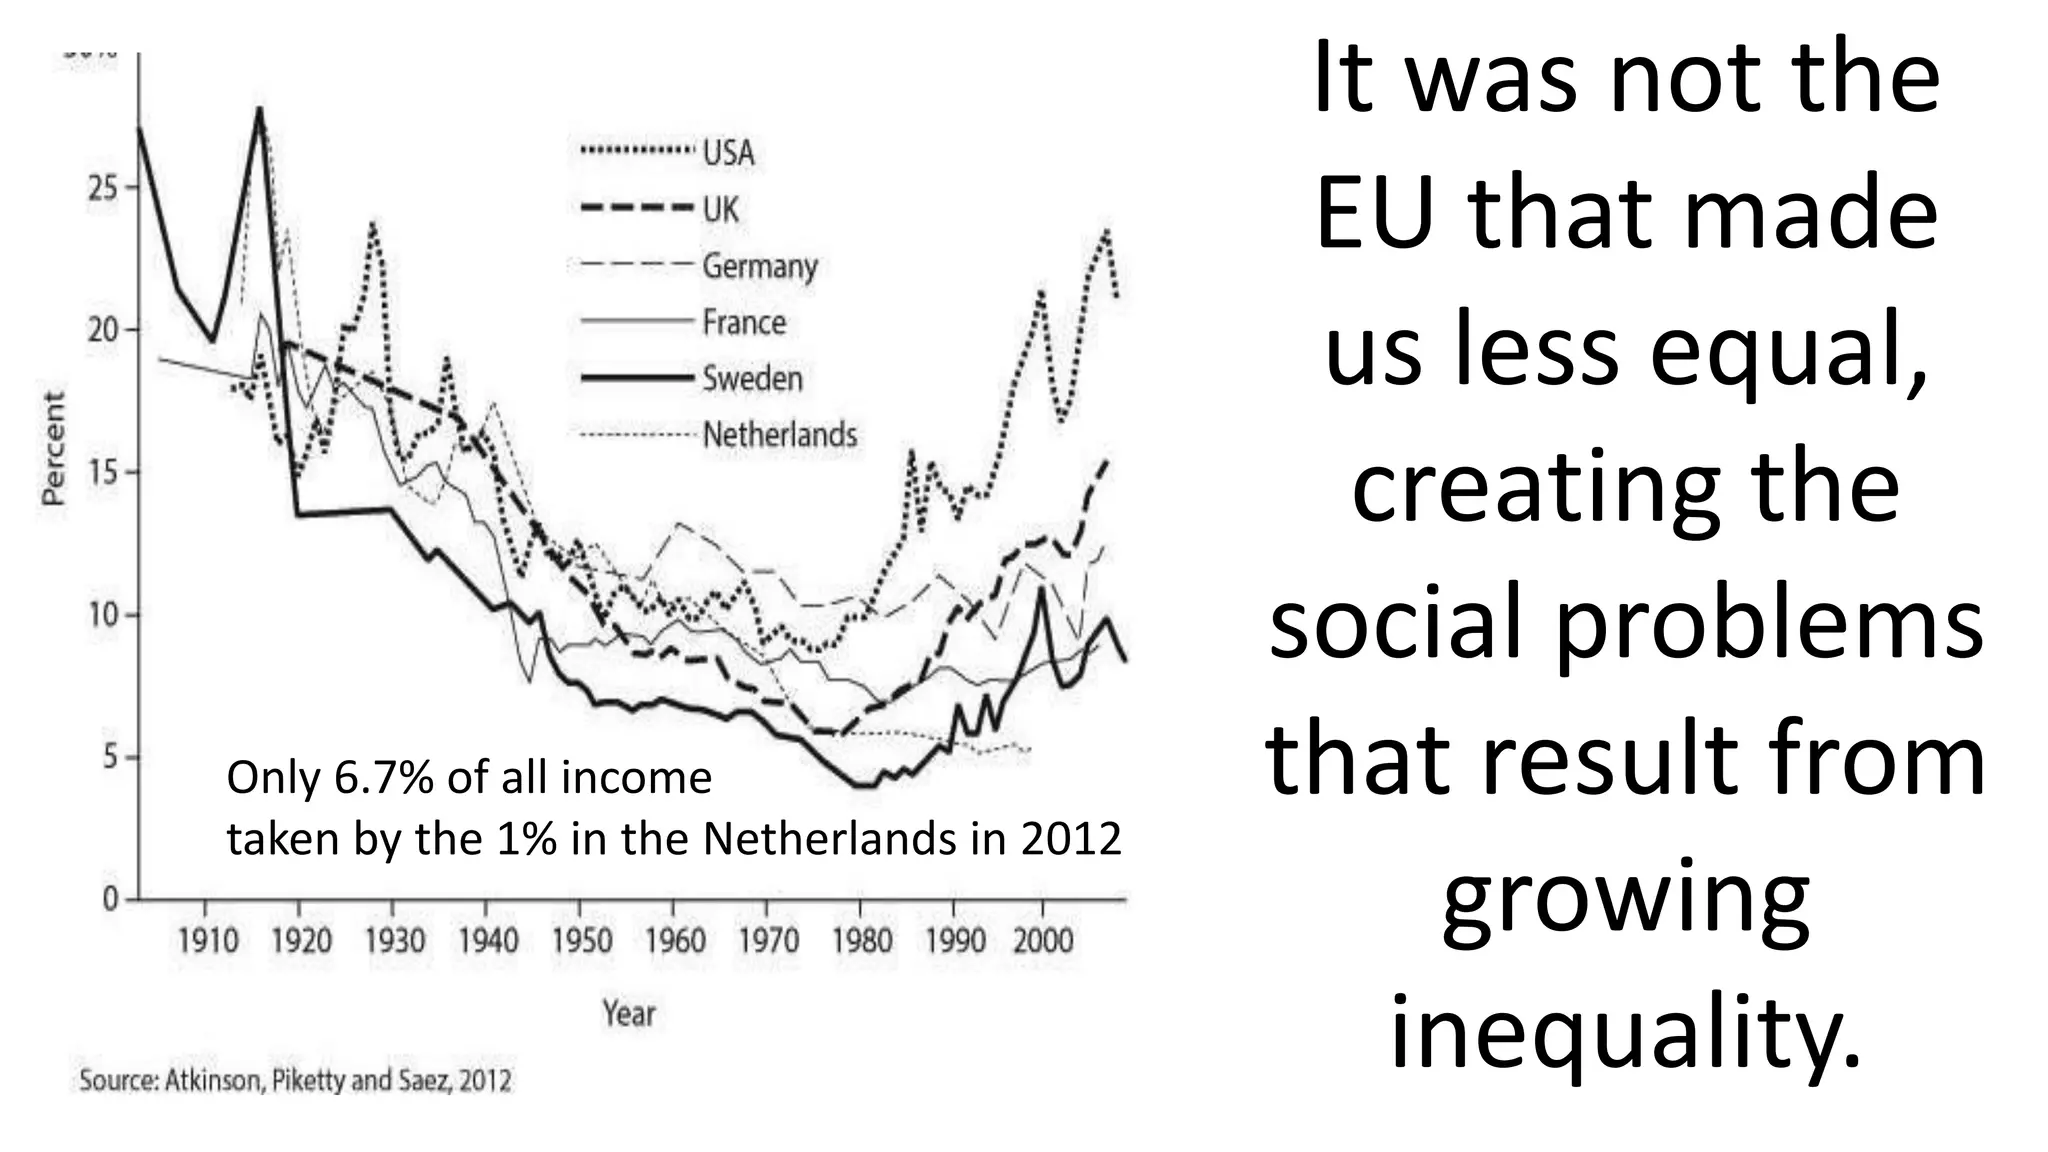

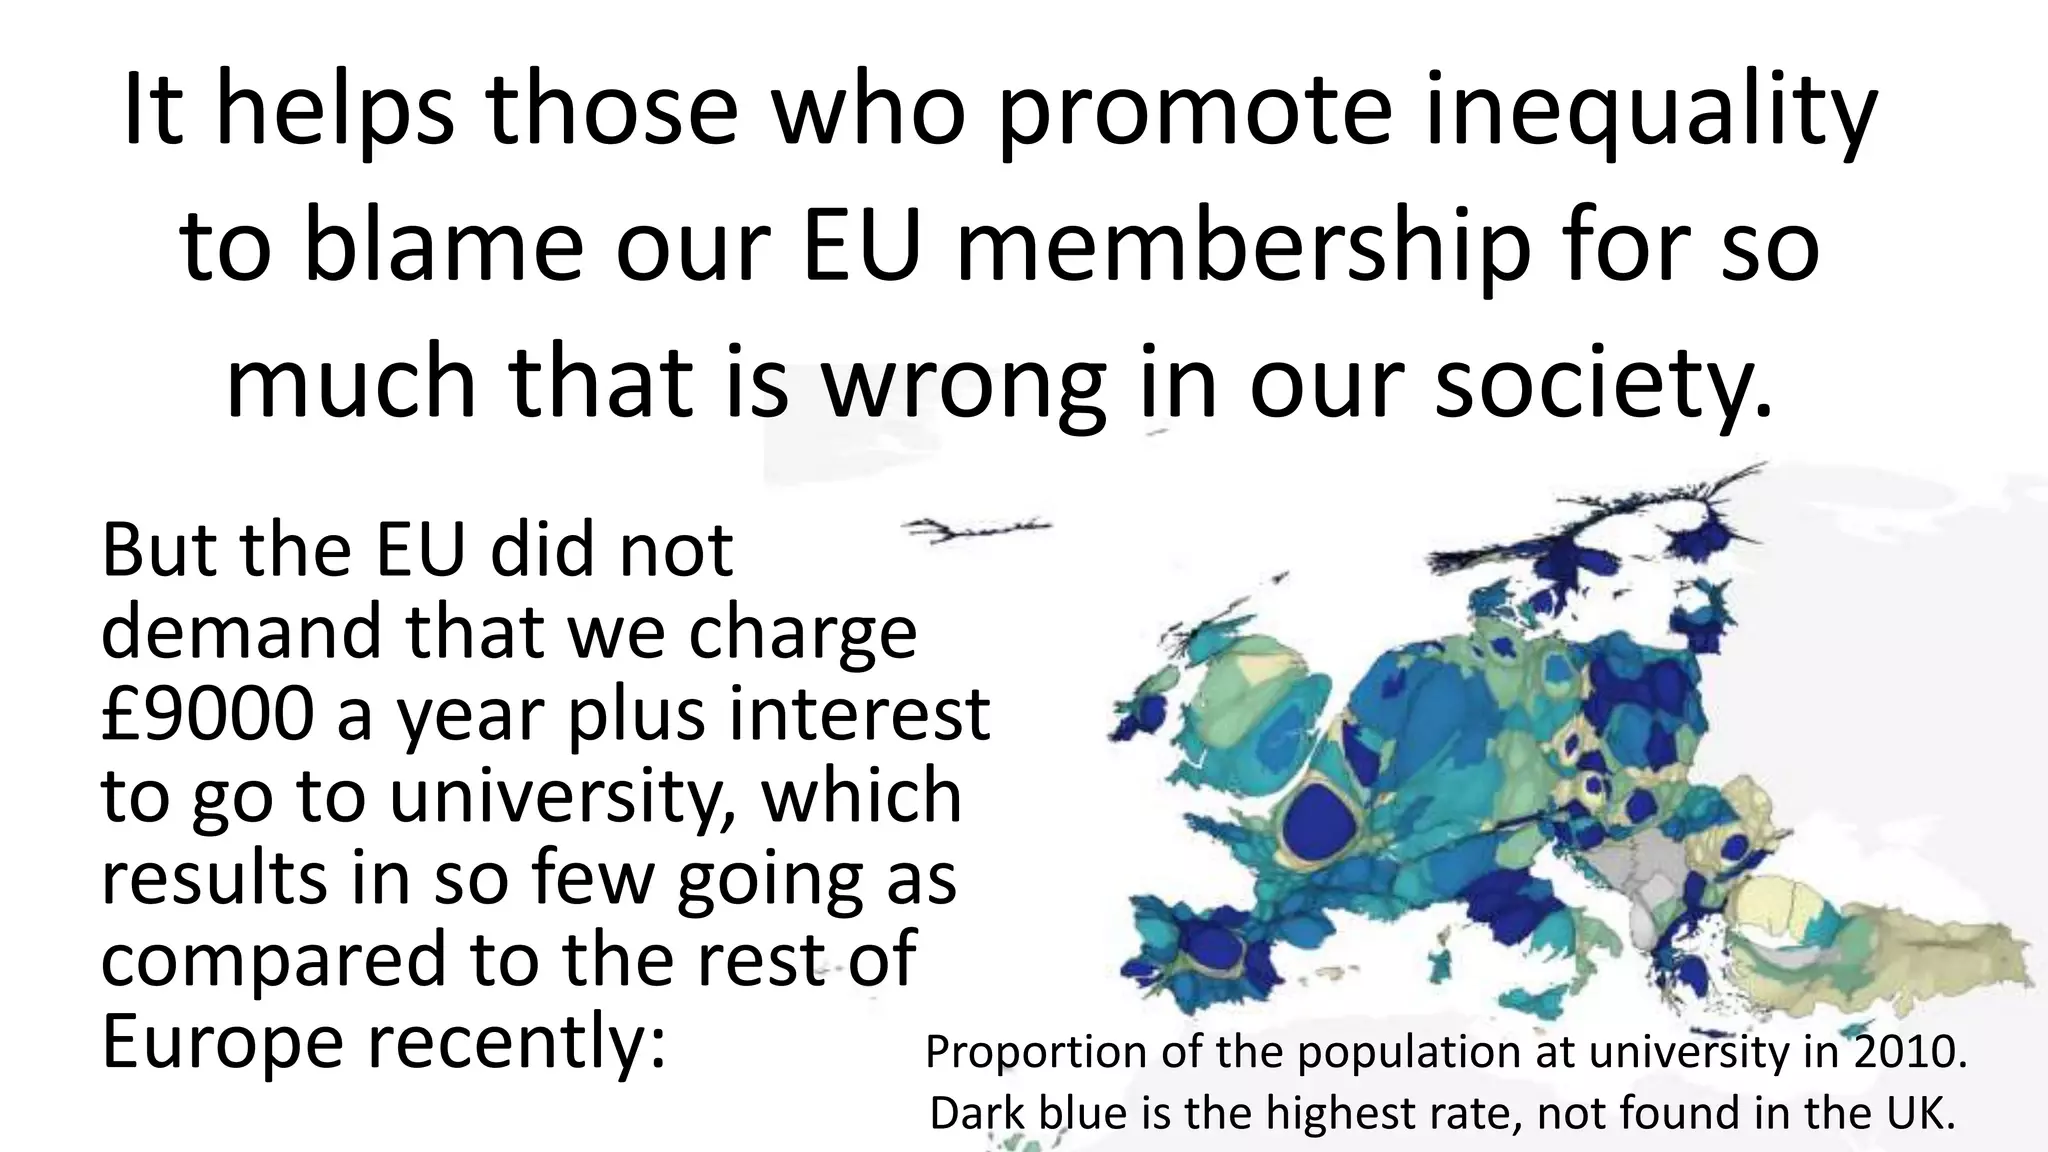

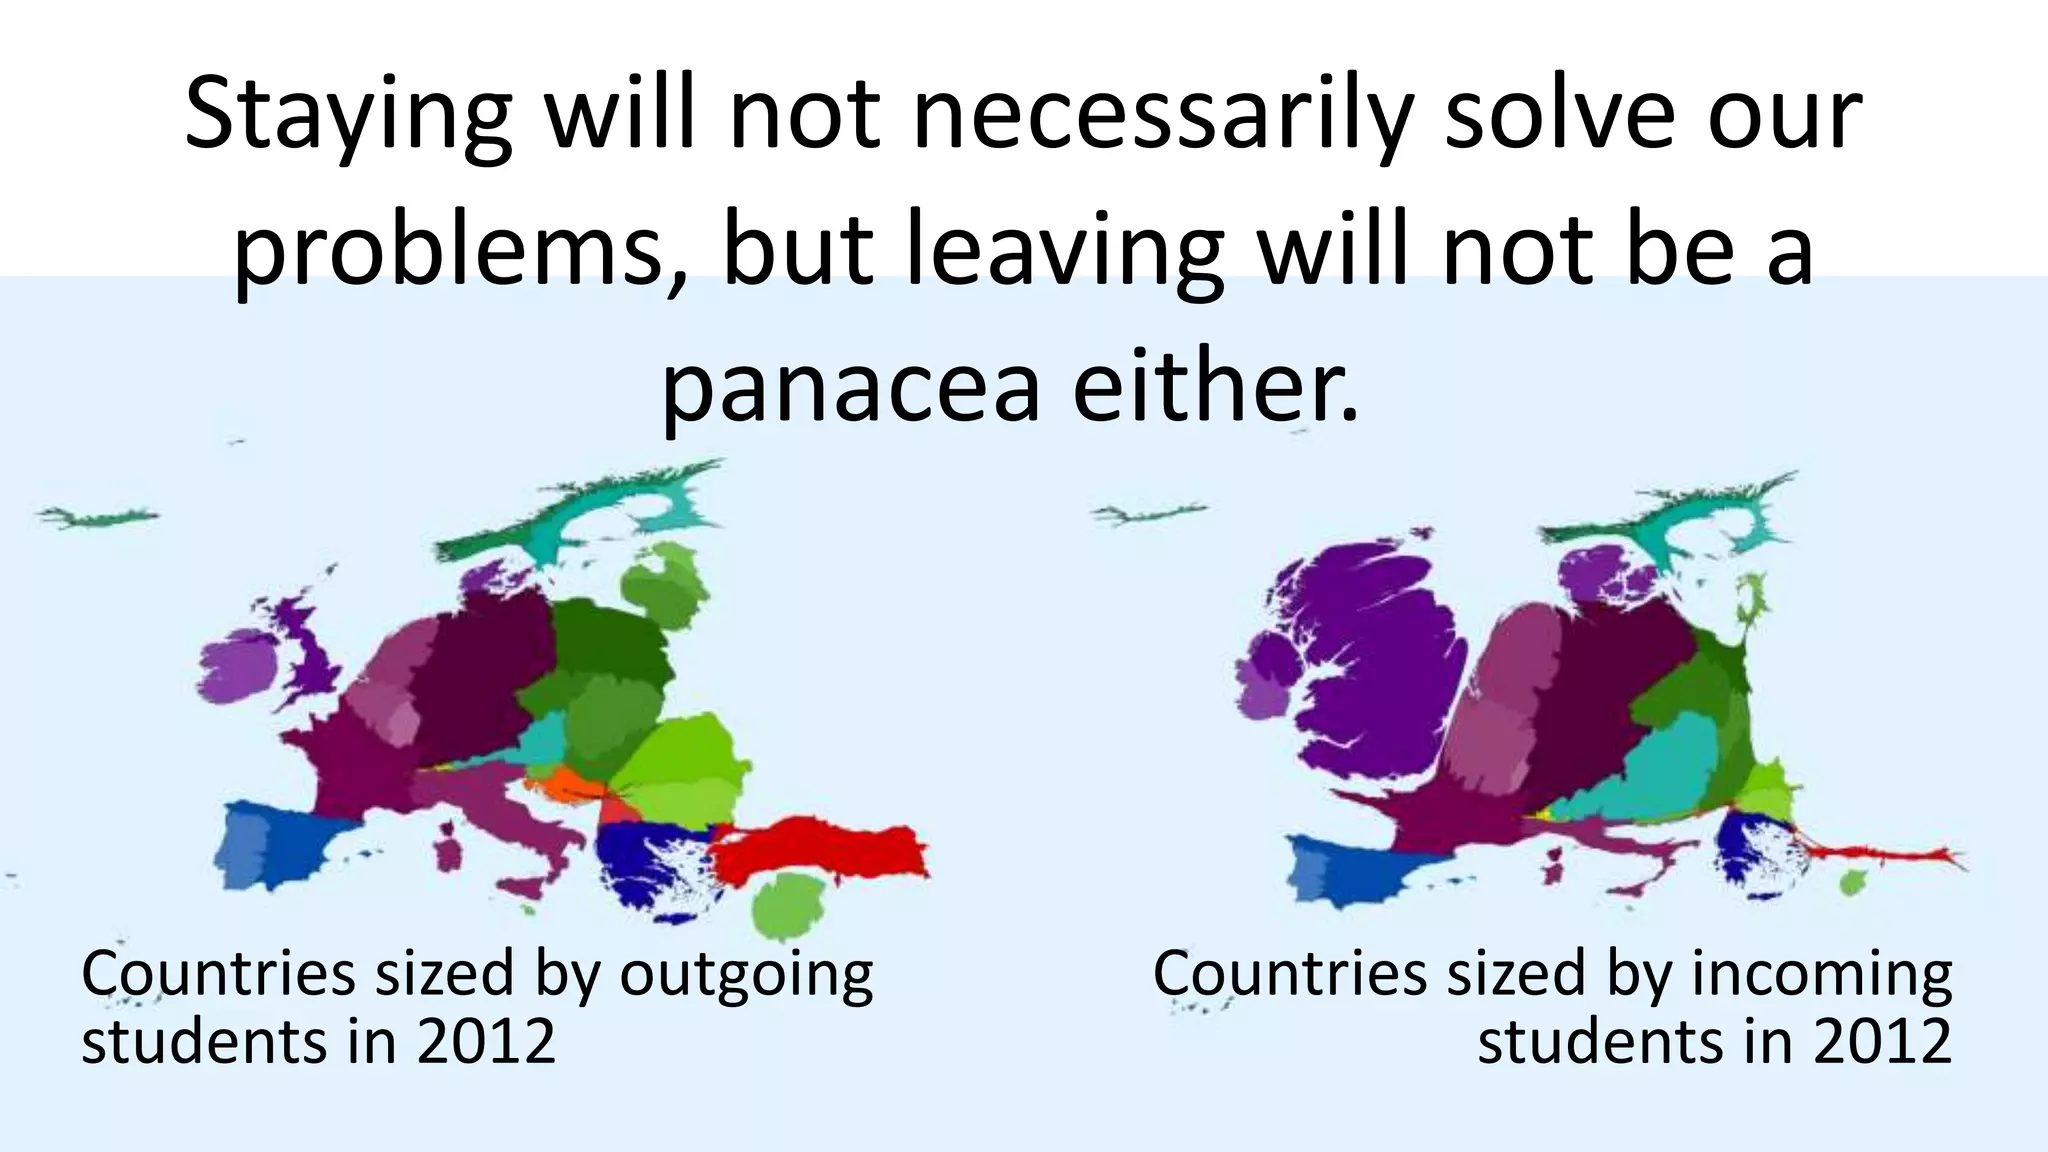


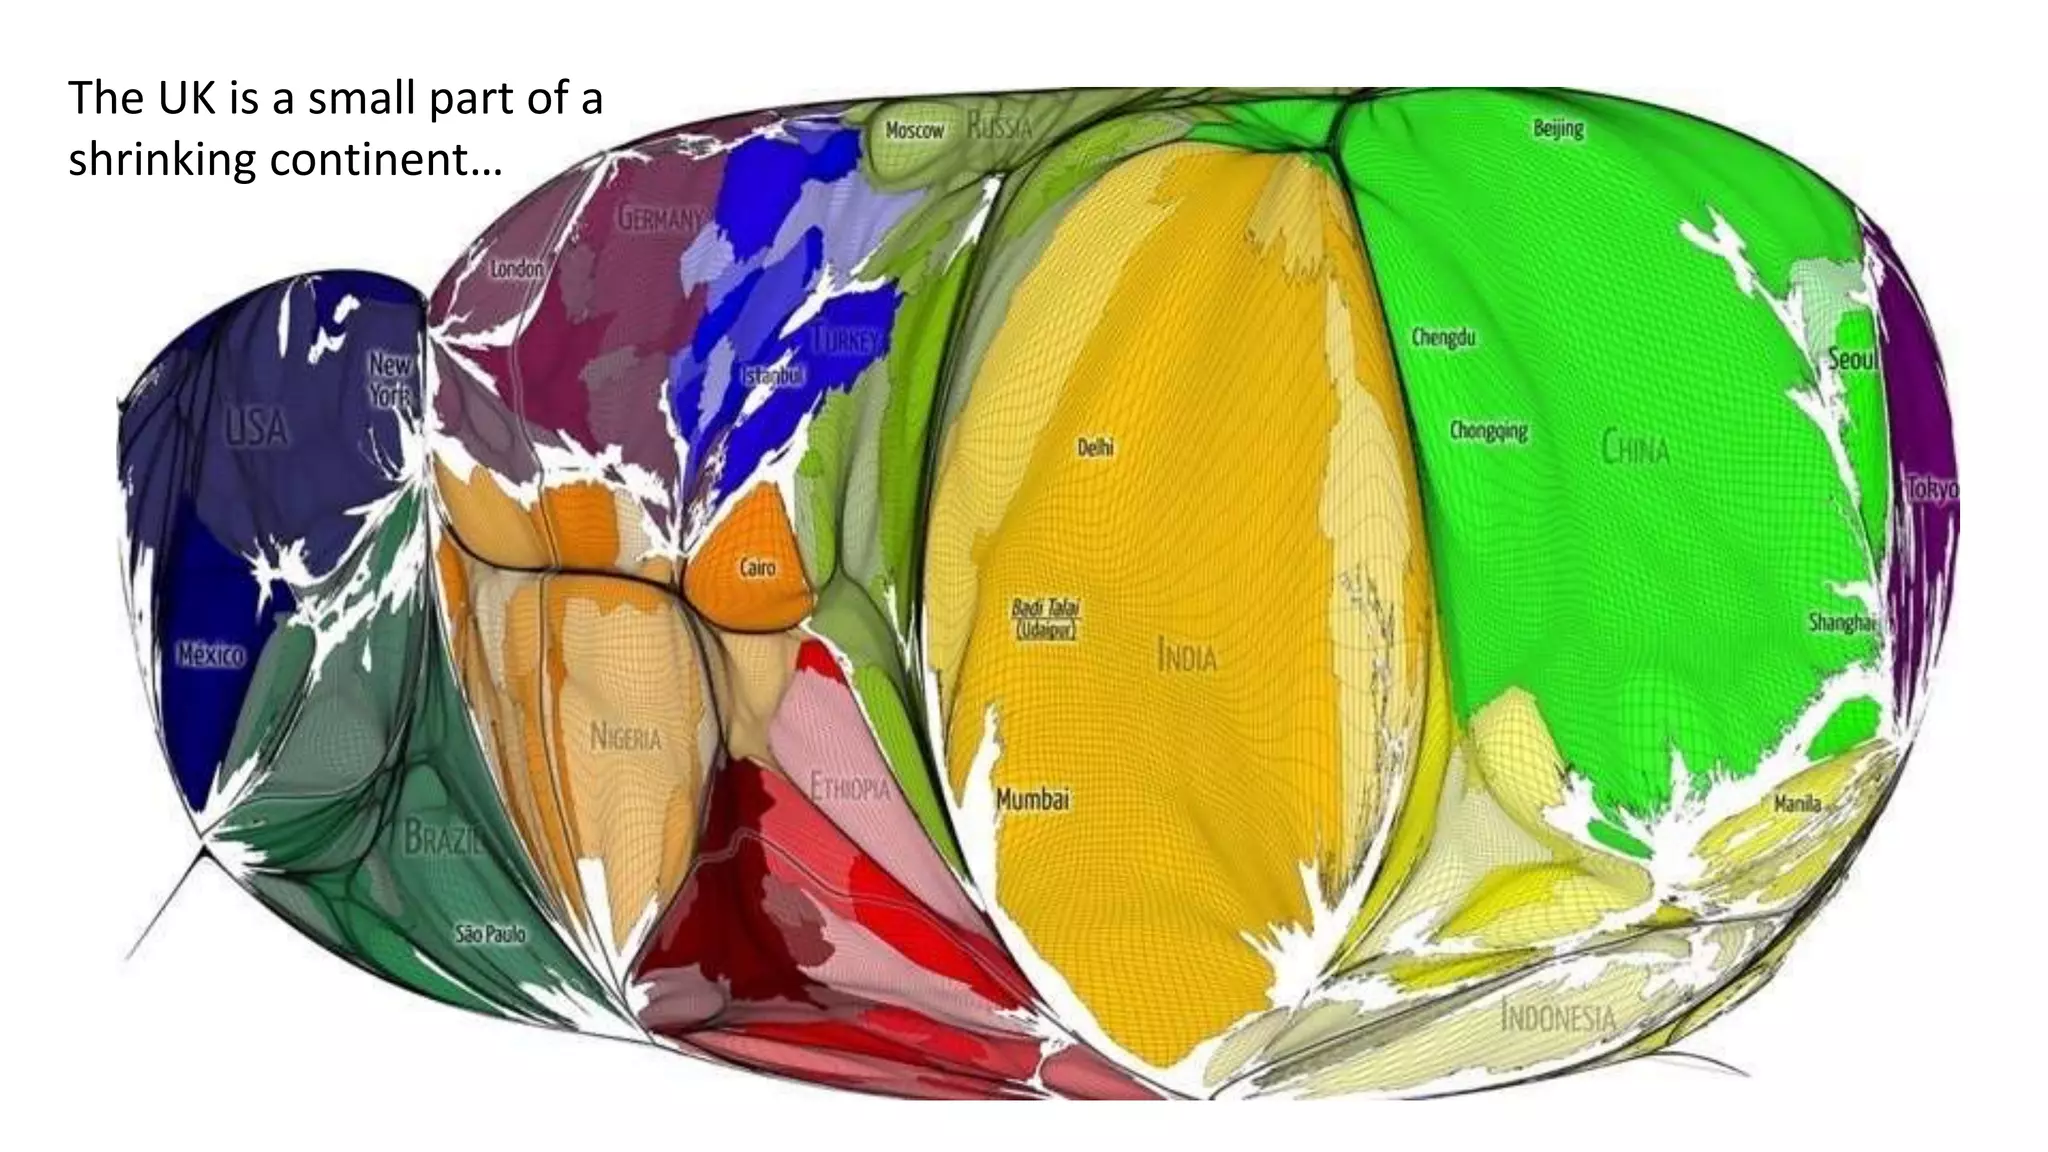

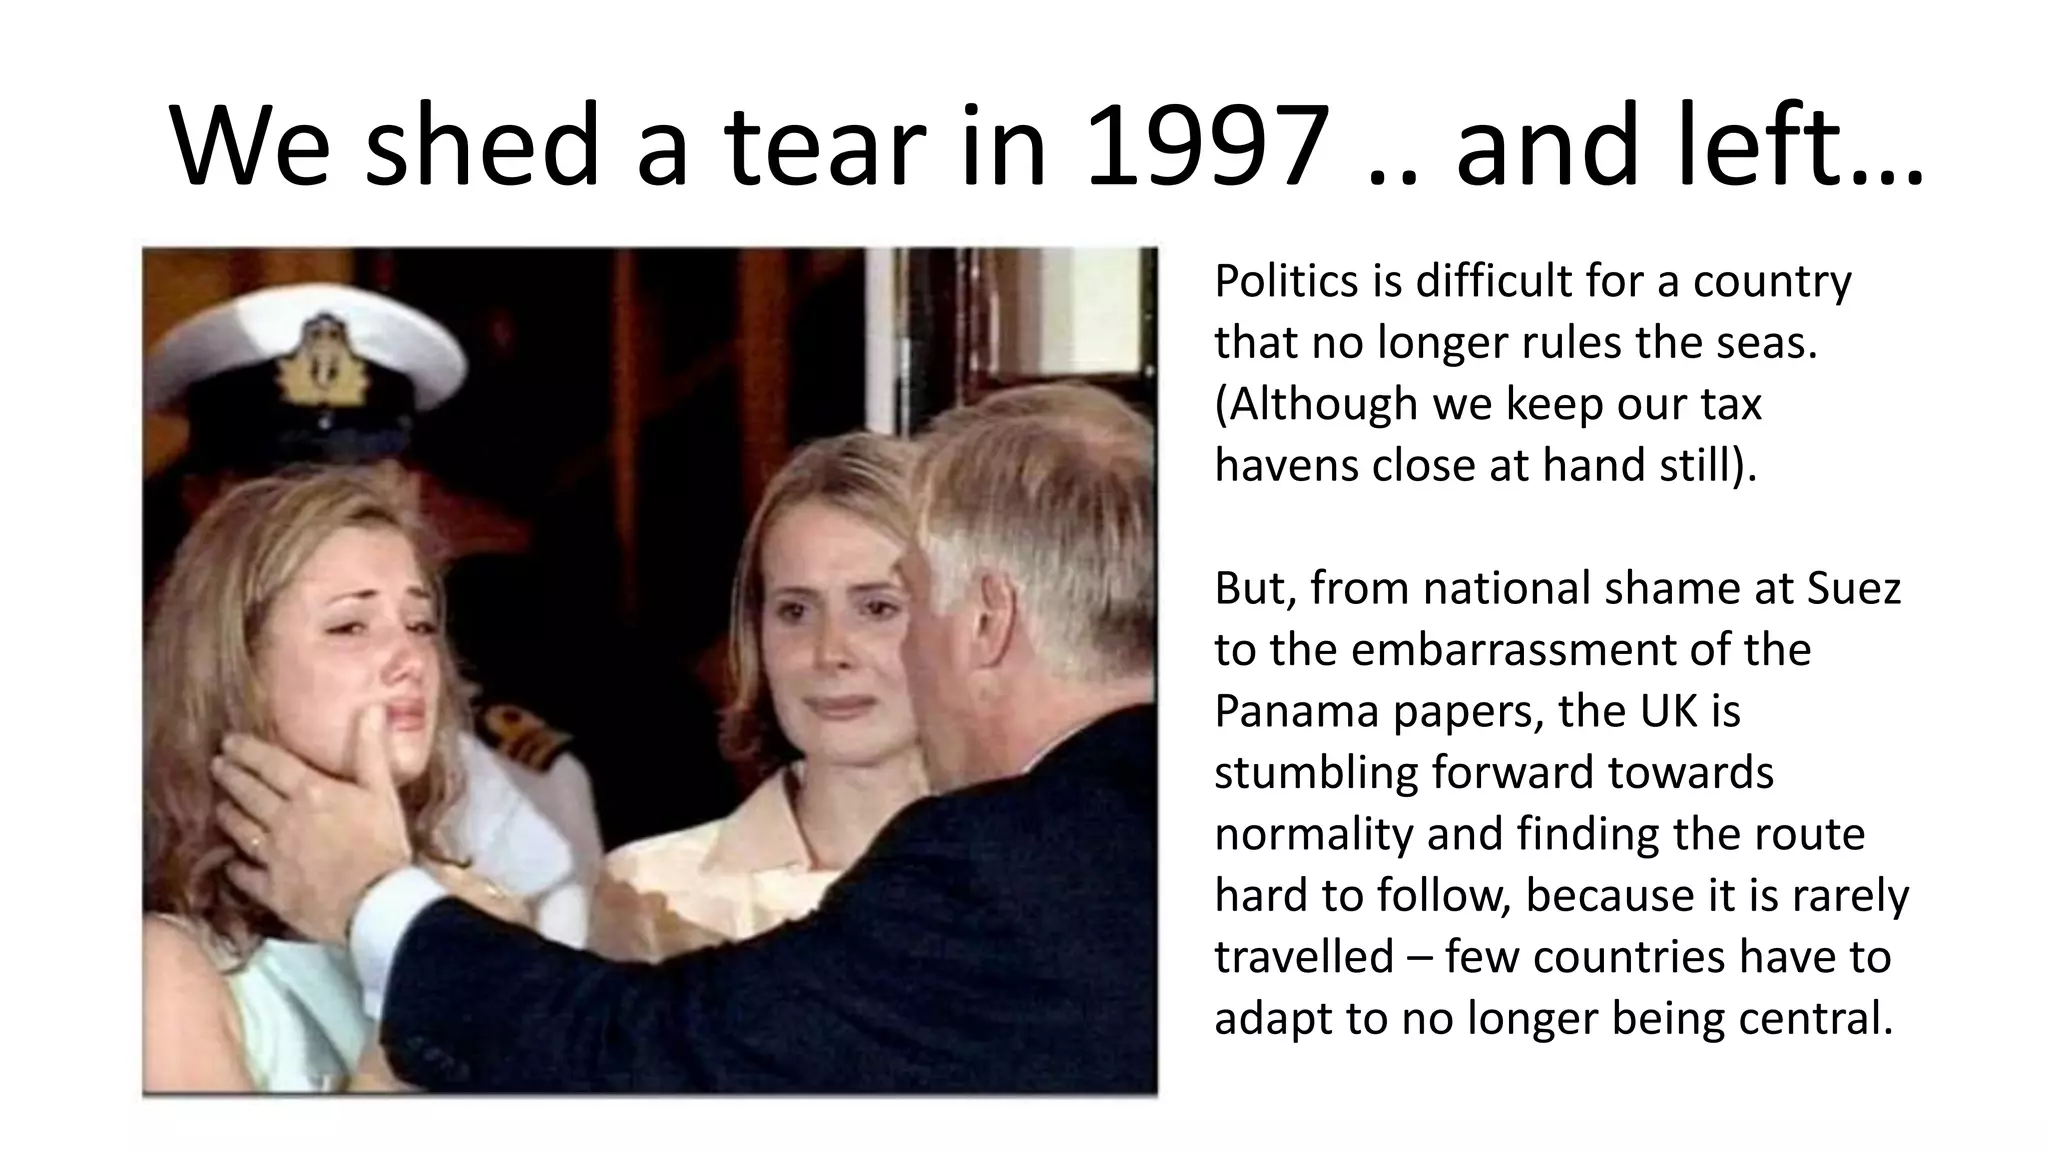


This document discusses several issues related to the UK's membership in the EU. It notes that inequality is higher in the UK than other EU countries. It also discusses polarization in the UK, differences in health and education outcomes compared to other developed nations, and issues related to the UK's declining global power and changing national identity. Overall, it argues that leaving the EU will not necessarily solve the UK's problems and that the EU is not responsible for many domestic issues like inequality and underfunding of healthcare.


