Downloaded 12 times


![Slides for UC Davis EVE161 Course Taught by Jonathan Eisen Winter 2014
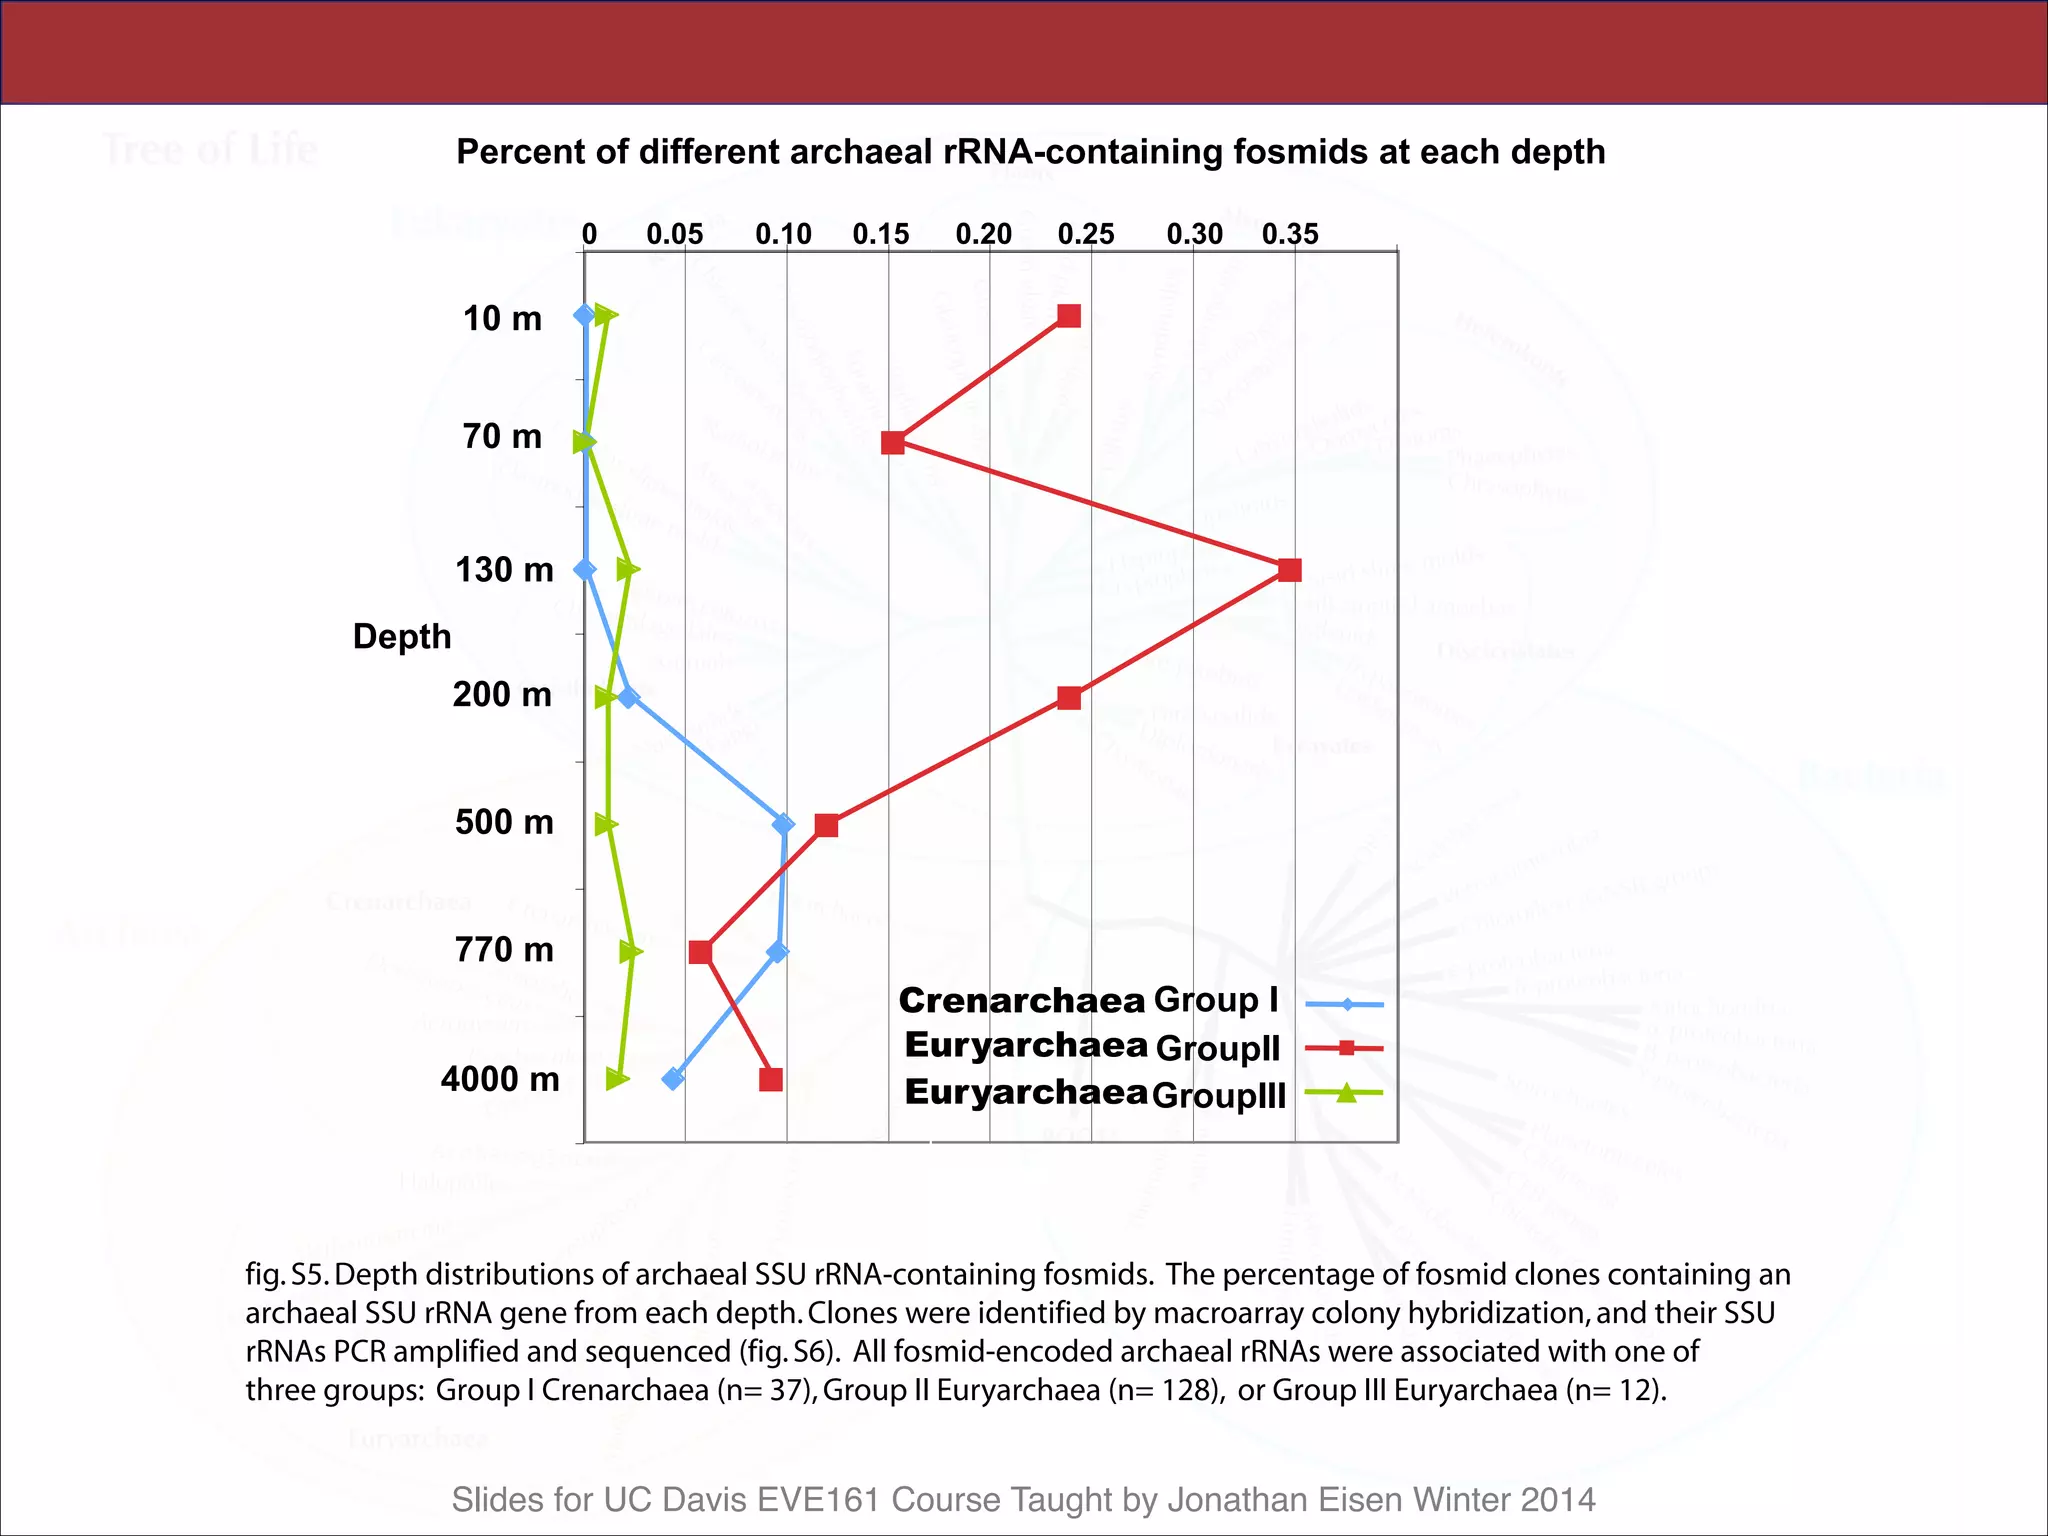
All archaeal SSU rRNA–containing fosmids
were identified at each depth, quantified by mac-
roarray hybridization, and their rRNAs sequenced
500 10/6/02 80 15,264 550 8.86
770 12/21/03 240 11,520 415 11.18
4,000 12/21/03 670 41,472 1,493 11.10
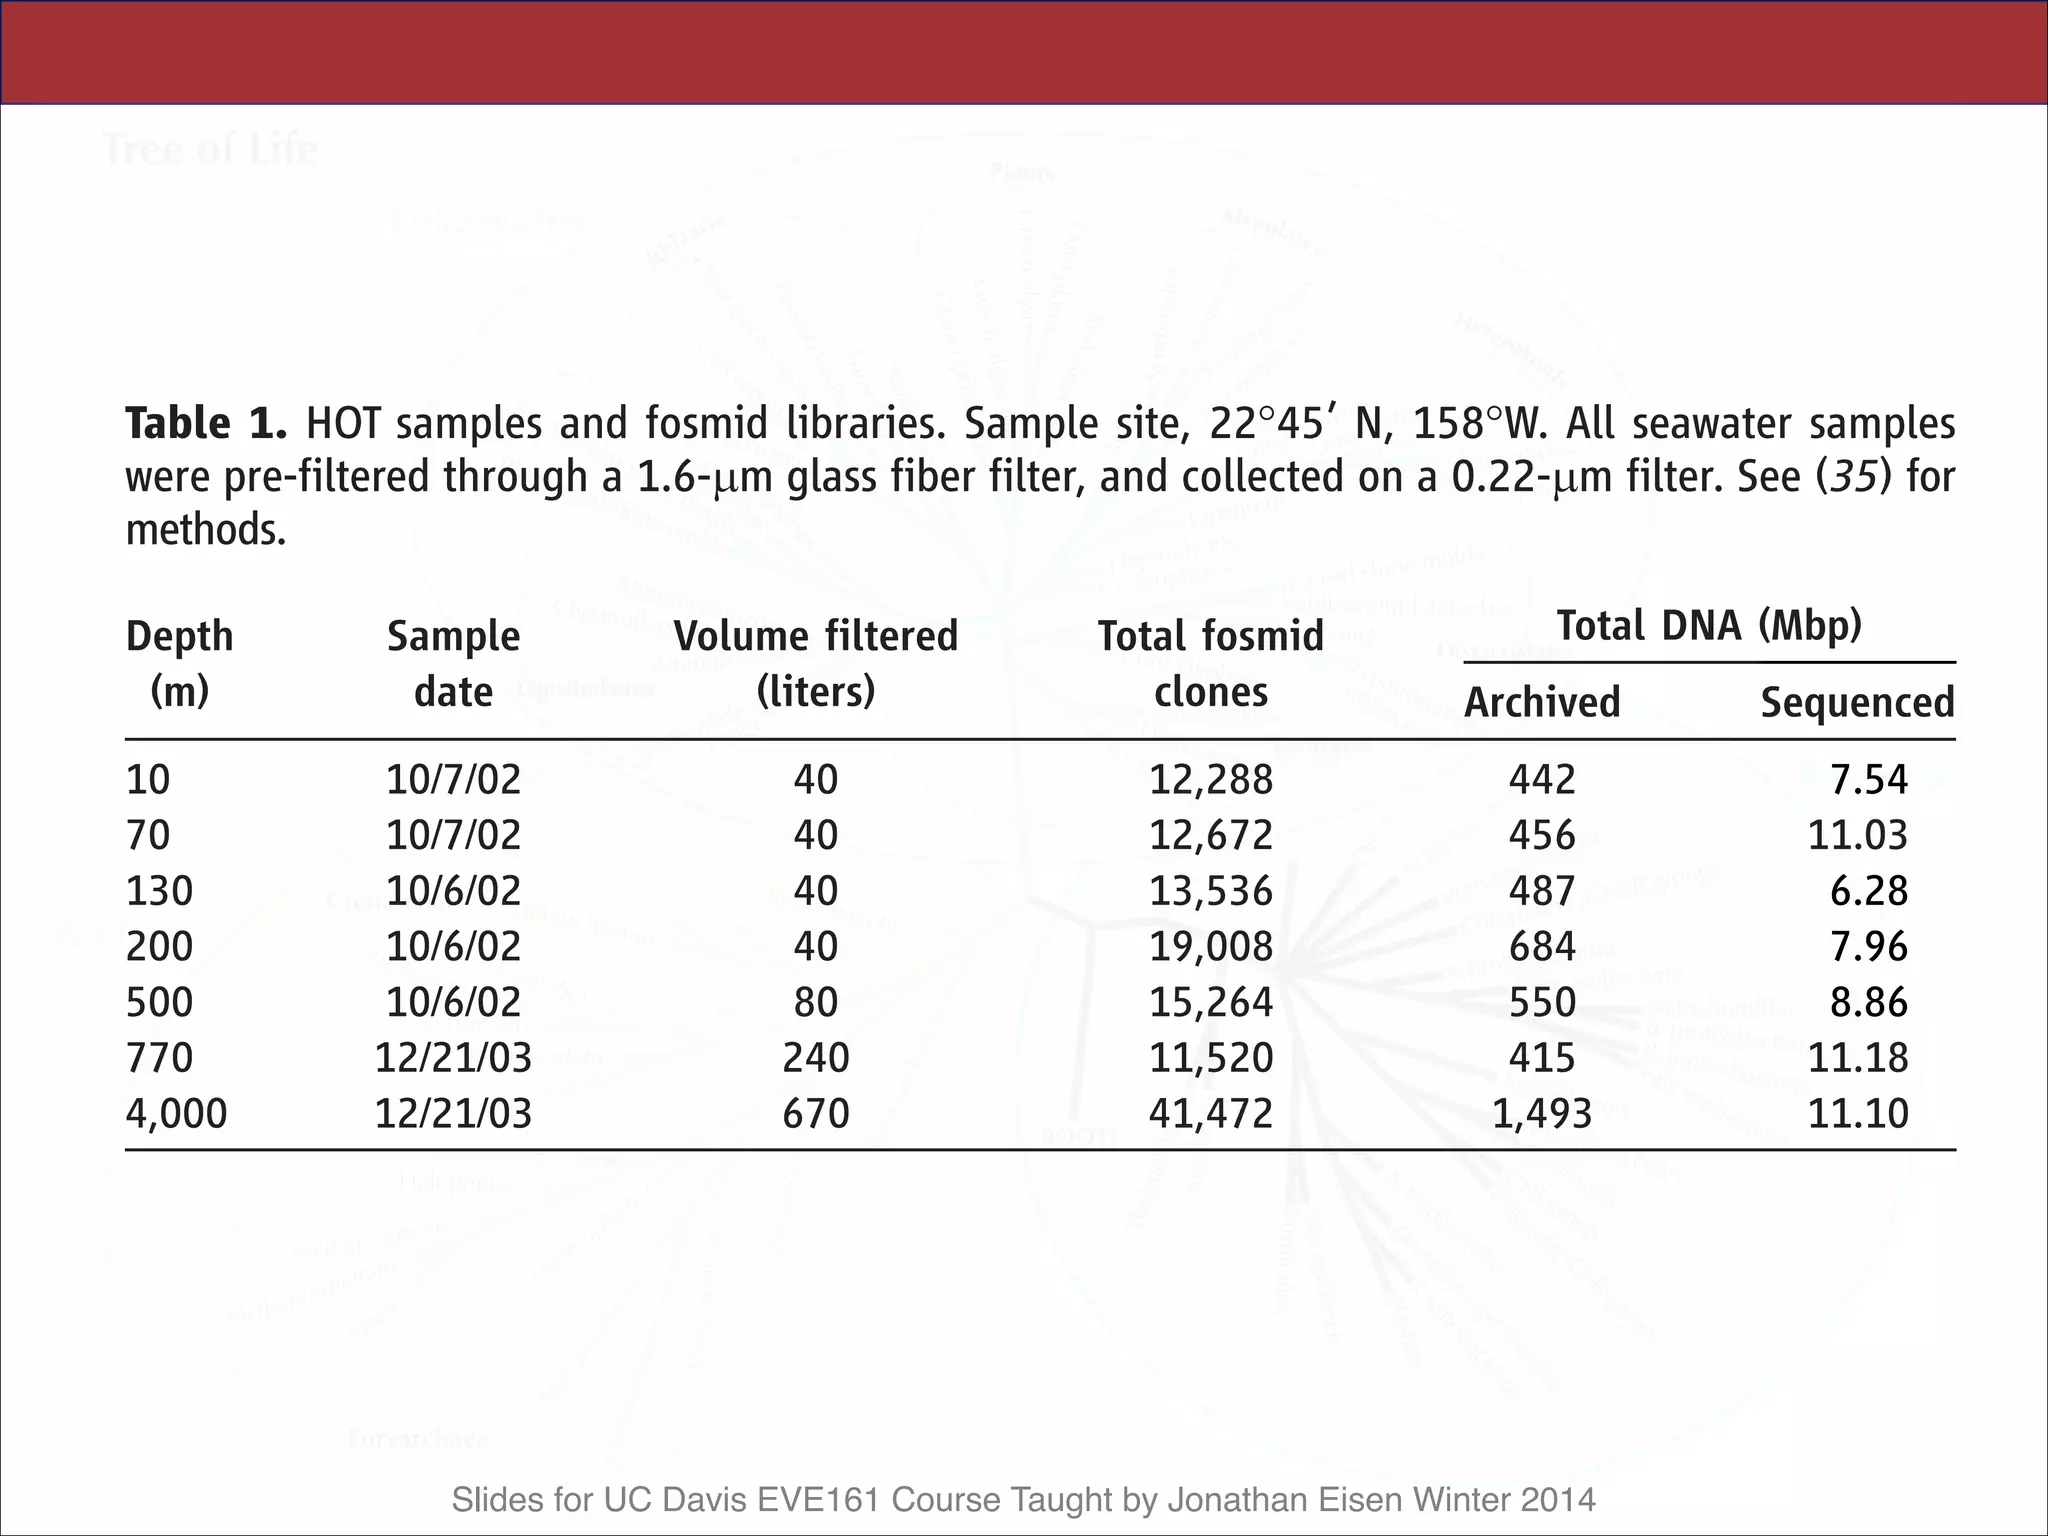
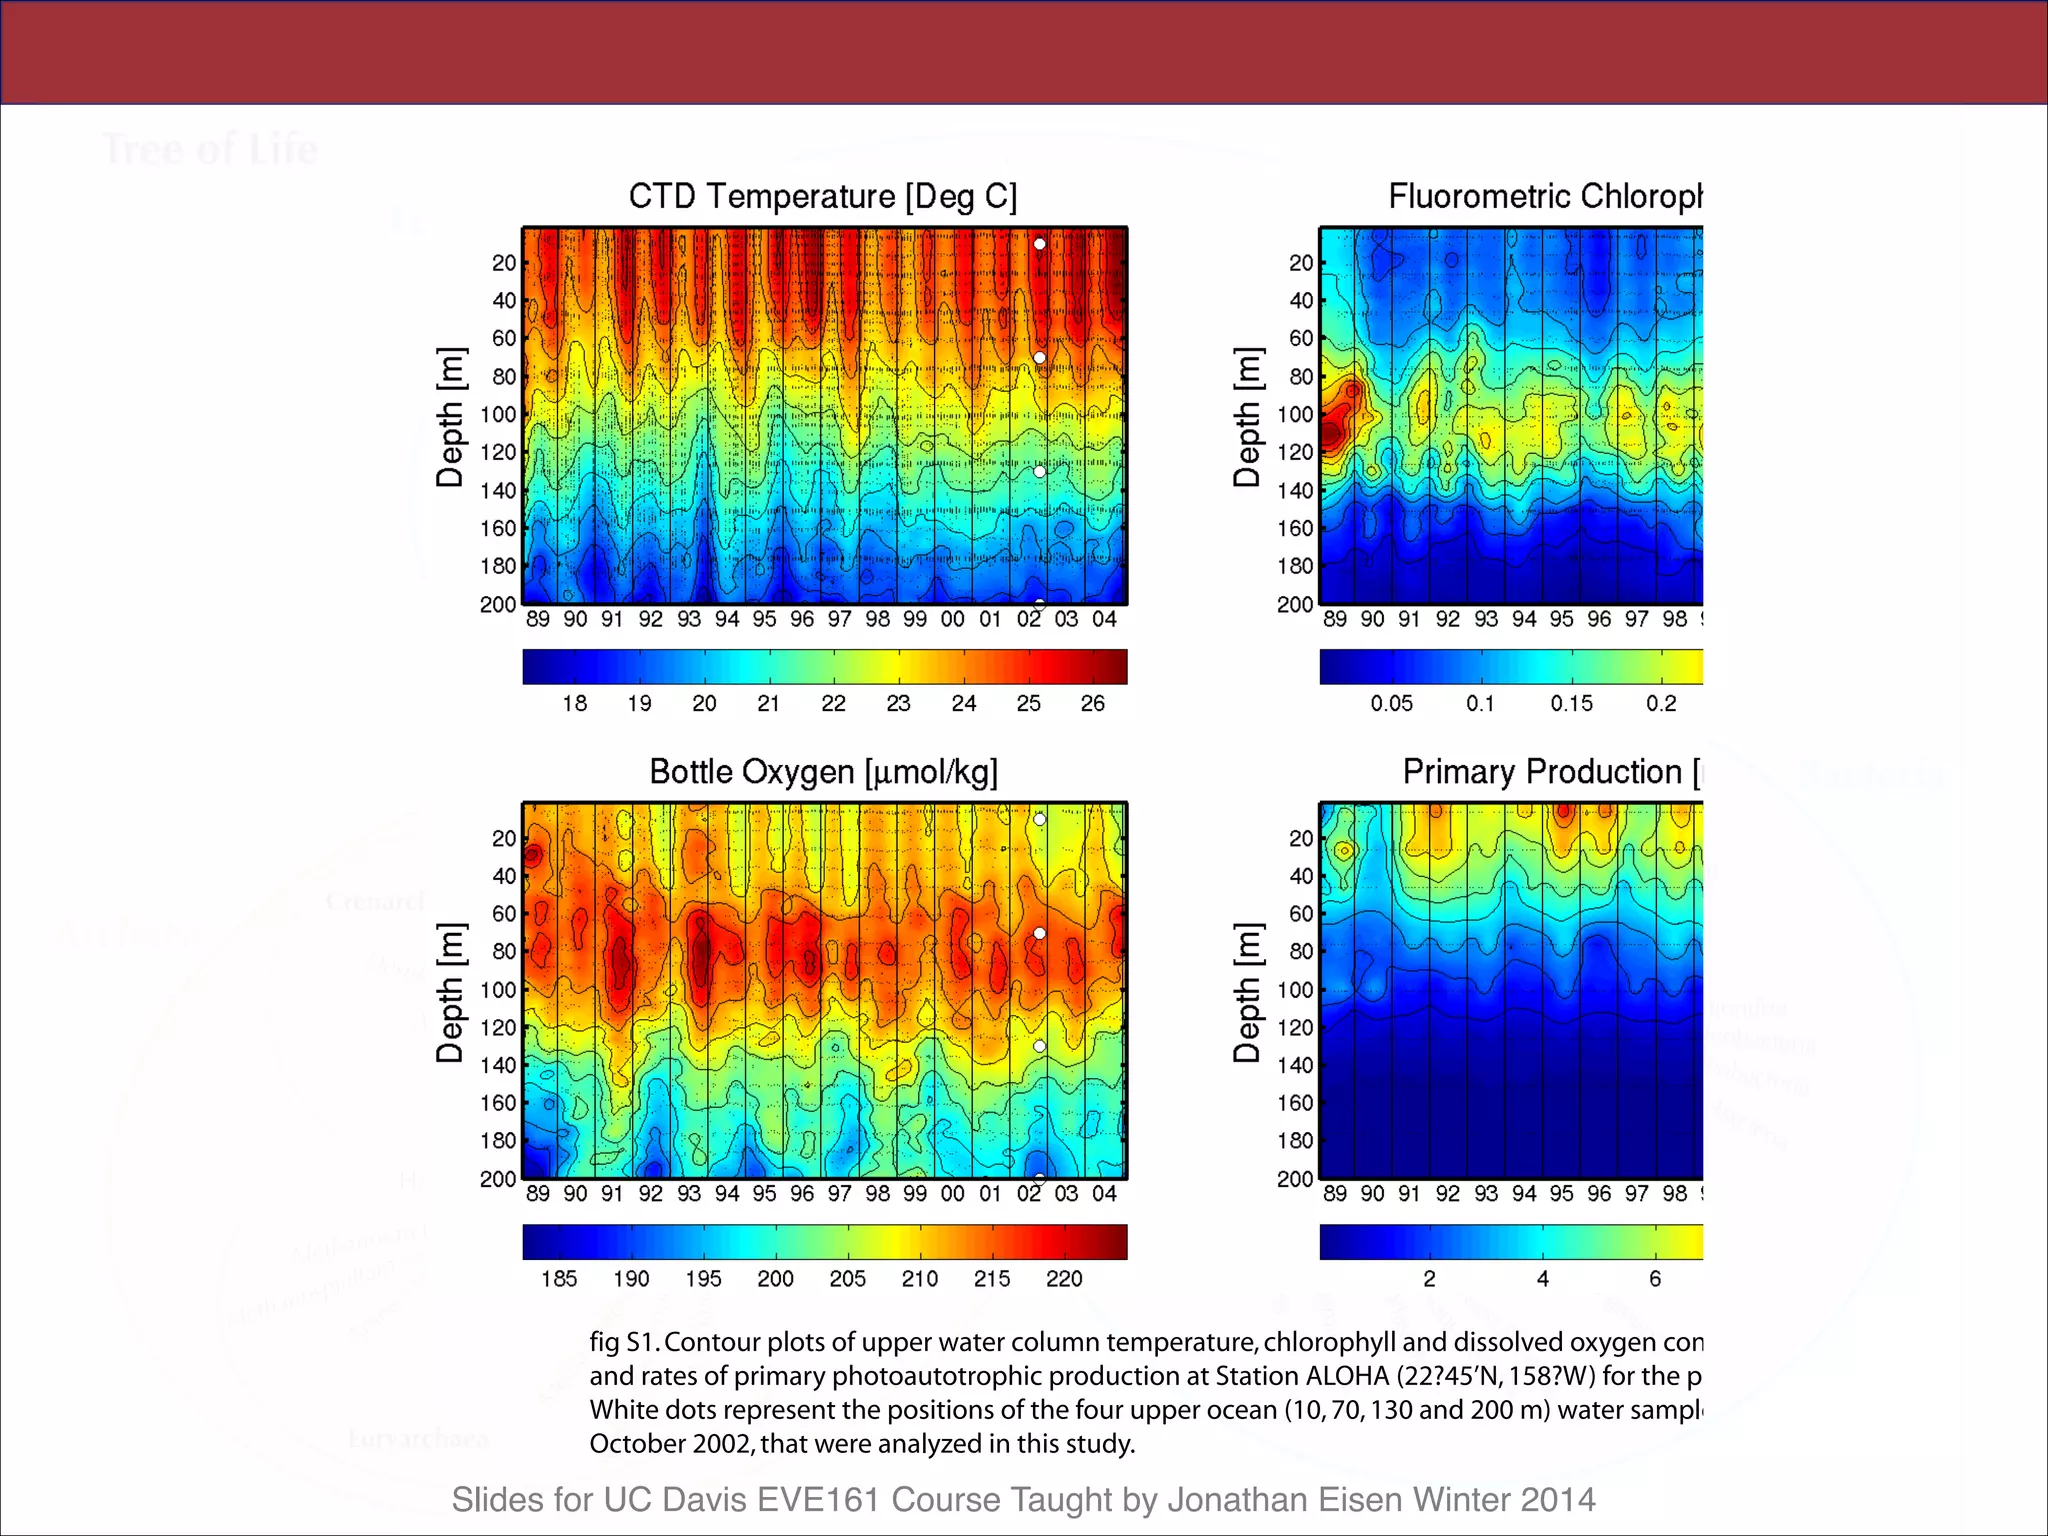
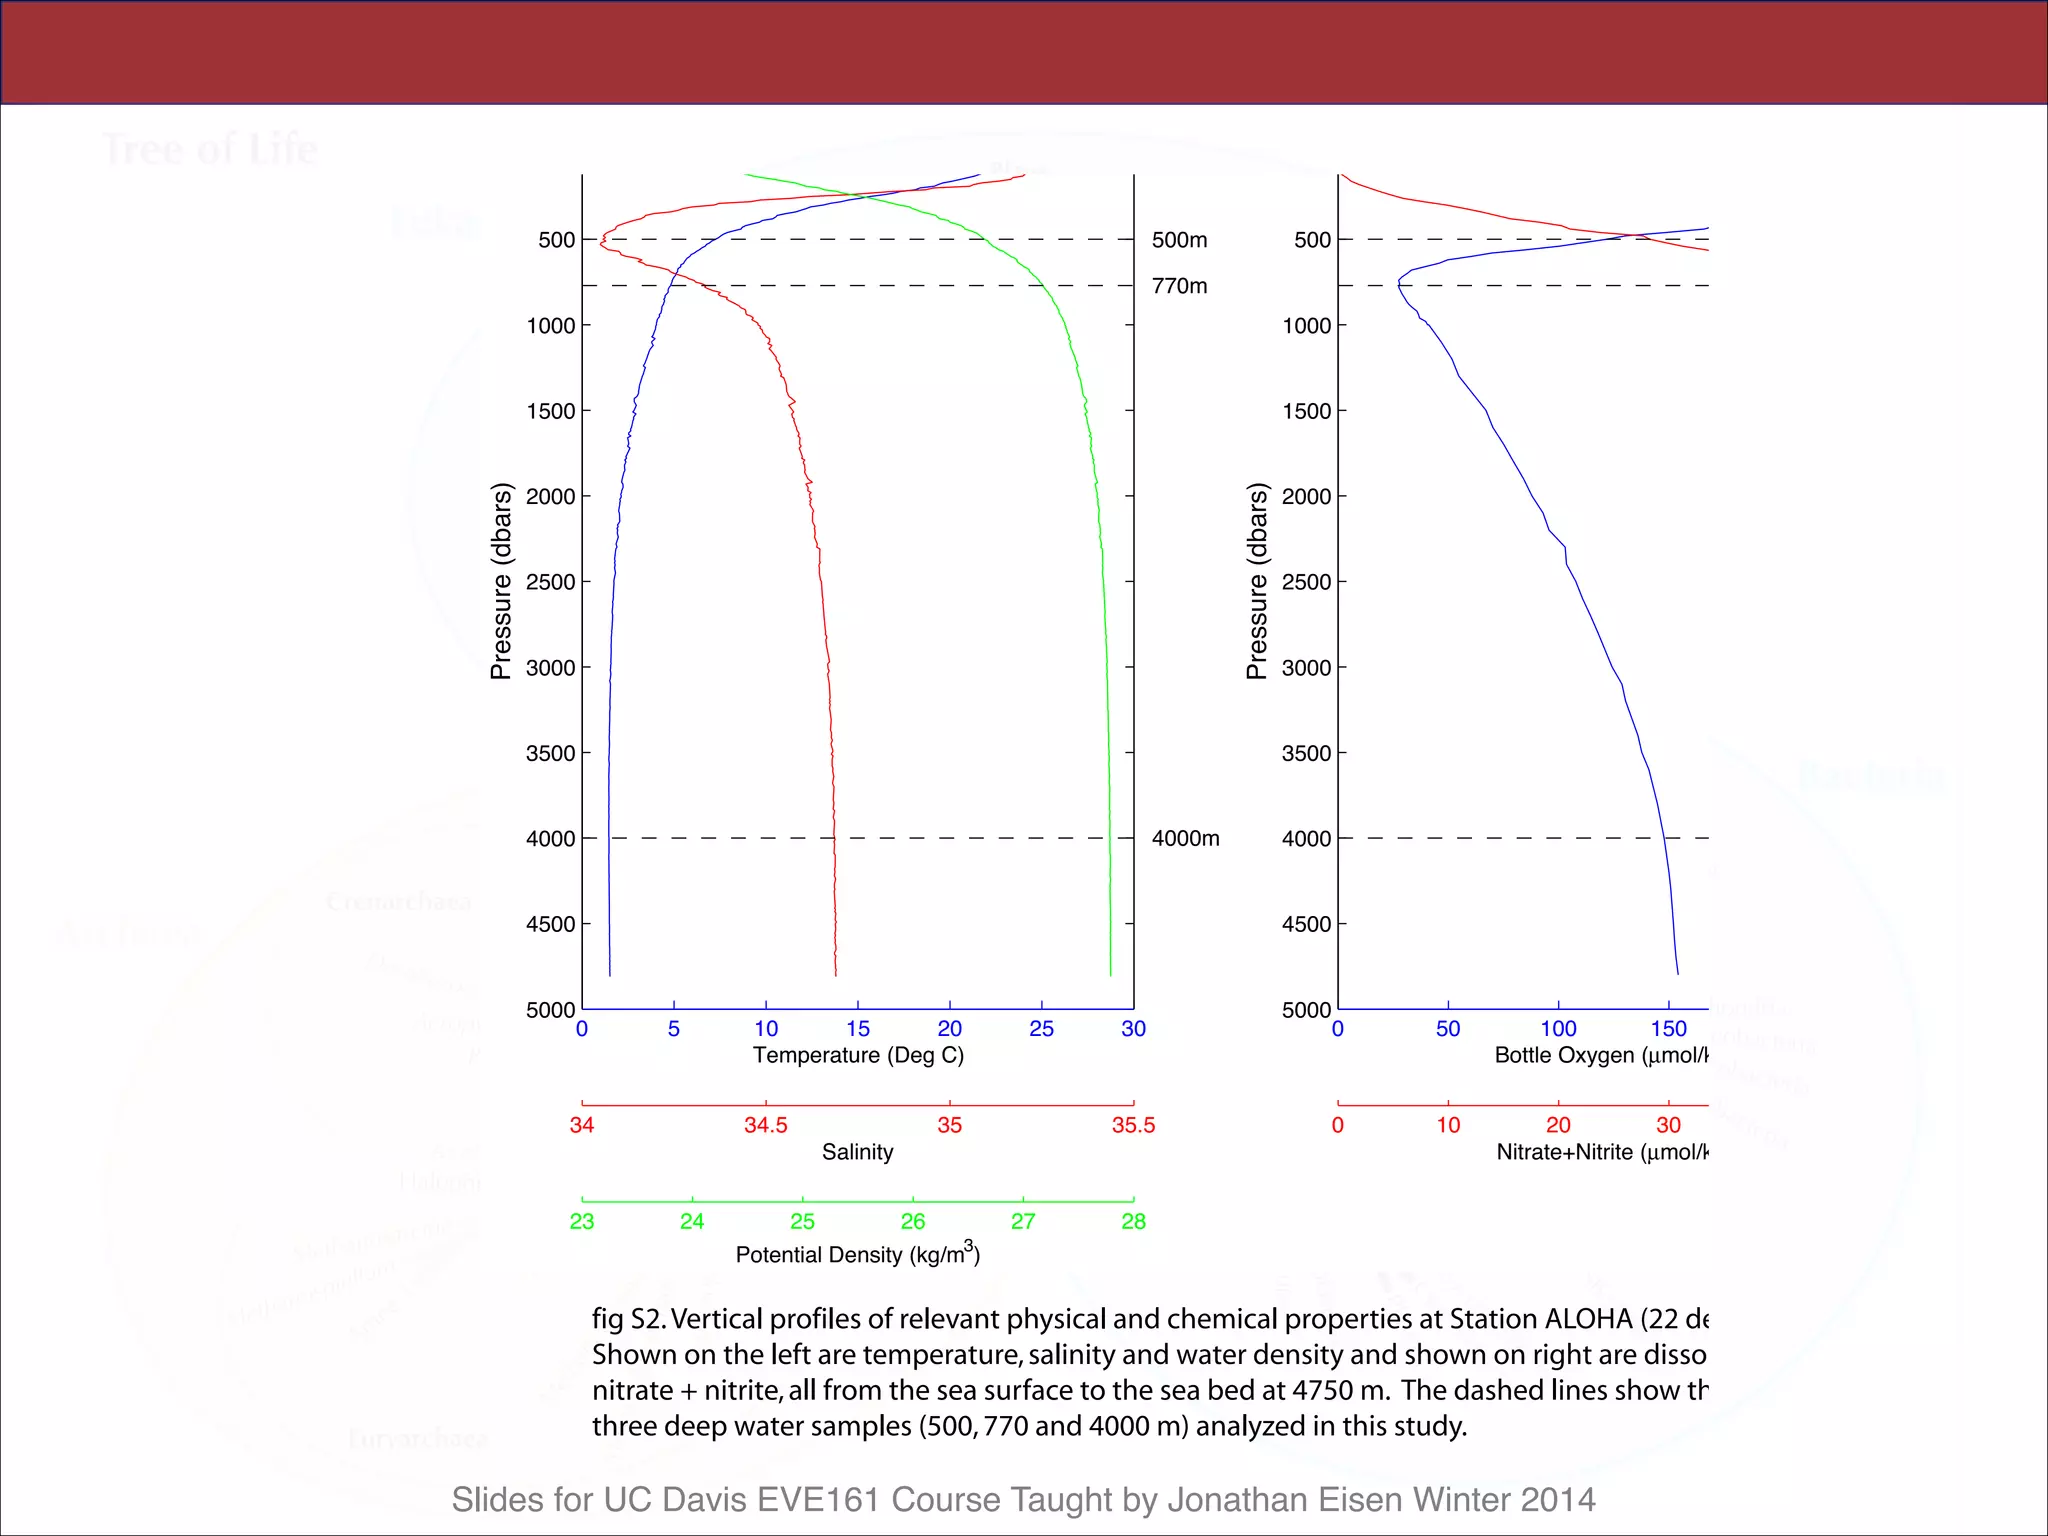
Table 2. HOT sample oceanographic data. Samples described in Table 1.
Oceanographic parameters were measured as specified at (49); values shown
are those from the same CTD casts as the samples, where available. Values in
parentheses are the mean T 1 SD of each core parameter during the period
October 1988 to December 2004, with the total number of measurements
collected for each parameter shown in brackets. The parameter abbreviations
are Temp., Temperature; Chl a, chlorophyll a; DOC, dissolved organic carbon;
NþN, nitrate plus nitrite; DIP, dissolved inorganic phosphate; and DIC,
dissolved inorganic carbon. The estimated photon fluxes for upper water
column samples (assuming a surface irradiance of 32 mol quanta mj2 dj1
and a light extinction coefficient of 0.0425 mj1) were: 10 m 0 20.92 (65%
of surface), 70 m 0 1.63 (5% of surface), 130 m 0 0.128 (0.4% of surface),
200 m 0 0.07 (0.02% of surface). The mean surface mixed-layer during the
October 2002 sampling was 61 m. Data are available at (50). *Biomass
derived from particulate adenosine triphosphate (ATP) measurements as-
suming a carbon:ATP ratio of 250. ND, Not determined.
Depth
(m)
Temp.
(-C)
Salinity
Chl a
(mg/kg)
Biomass*
(mg/kg)
DOC
(mmol/kg)
N þ N
(nmol/kg)
DIP
(nmol/kg)
Oxygen
(mmol/kg)
DIC
(mmol/kg)
10 26.40
(24.83 T 1.27)
[2,104]
35.08
(35.05 T 0.21)
[1,611]
0.08
(0.08 T 0.03)
[320]
7.21 T 2.68
[78]
78
(90.6 T 14.3)
[140]
1.0
(2.6 T 3.7)
[126]
41.0
(56.0 T 33.7)
[146]
204.6
(209.3 T 4.5)
[348]
1,967.6
(1,972.1 T 16.4)
[107]
70 24.93
(23.58 T 1.00)
[1,202]
35.21
(35.17 T 0.16)
[1,084]
0.18
(0.15 T 0.05)
[363]
8.51 T 3.22
[86]
79
(81.4 T 11.3)
[79]
1.3
(14.7 T 60.3)
[78]
16.0
(43.1 T 25.1)
[104]
217.4
(215.8 T 5.4)
[144]
1,981.8
(1,986.9 T 15.4)
[84]
130 22.19
(21.37 T 0.96)
[1,139]
35.31
(35.20 T 0.10)
[980]
0.10
(0.15 T 0.06)
[350]
5.03 T 2.30
[90]
69
(75.2 T 9.1)
[86]
284.8
(282.9 T 270.2)
[78]
66.2
(106.0 T 49.7)
[68]
204.9
(206.6 T 6.2)
[173]
2,026.5
(2,013.4 T 13.4)
[69]
200 18.53
(18.39 T 1.29)
[662]
35.04
(34.96 T 0.18)
[576]
0.02
(0.02 T 0.02)
[97]
1.66 T 0.24
[2]
63
(64.0 T 9.8)
[113]
1,161.9 T 762.5
[7]
274.2 T 109.1
[84]
198.8
(197.6 T 7.1)
[190]
2,047.7
(2,042.8 T 10.5)
[125]
500 7.25
(7.22 T 0.44)
[1,969]
34.07
(34.06 T 0.03)
[1,769]
ND 0.48 T 0.23
[107]
47
(47.8 T 6.3)
[112]
28,850
(28,460 T 2210)
[326]
2,153
(2,051 T 175.7)
[322]
118.0
(120.5 T 18.3)
[505]
2197.3
(2,200.2 T 17.8)
[134]
770 4.78
(4.86 T 0.21)
[888]
34.32
(34.32 T 0.04)
[773]
ND 0.29 T 0.16
[107]
39.9
(41.5 T 4.4)
[34]
41,890
(40,940 T 500)
[137]
3,070
(3,000 T 47.1)
[135]
32.3
(27.9 T 4.1)
[275]
2323.8
(2,324.3 T 6.1)
[34]
4,000 1.46
(1.46 T 0.01)
[262]
34.69
(34.69 T 0.00)
[245]
ND ND 37.5
(42.3 T 4.9)
[83]
36,560
(35,970 T 290)
[108]
2,558
(2,507 T 19)
[104]
147.8
(147.8 T 1.3)
[210]
2325.5
(2,329.1 T 4.8)
[28]
www.sciencemag.org SCIENCE VOL 311 27 JANUARY 2006 497](https://image.slidesharecdn.com/eve161-140323130935-phpapp02/75/UC-Davis-EVE161-Lecture-17-by-phylogenomics-33-2048.jpg)
![Slides for UC Davis EVE161 Course Taught by Jonathan Eisen Winter 2014
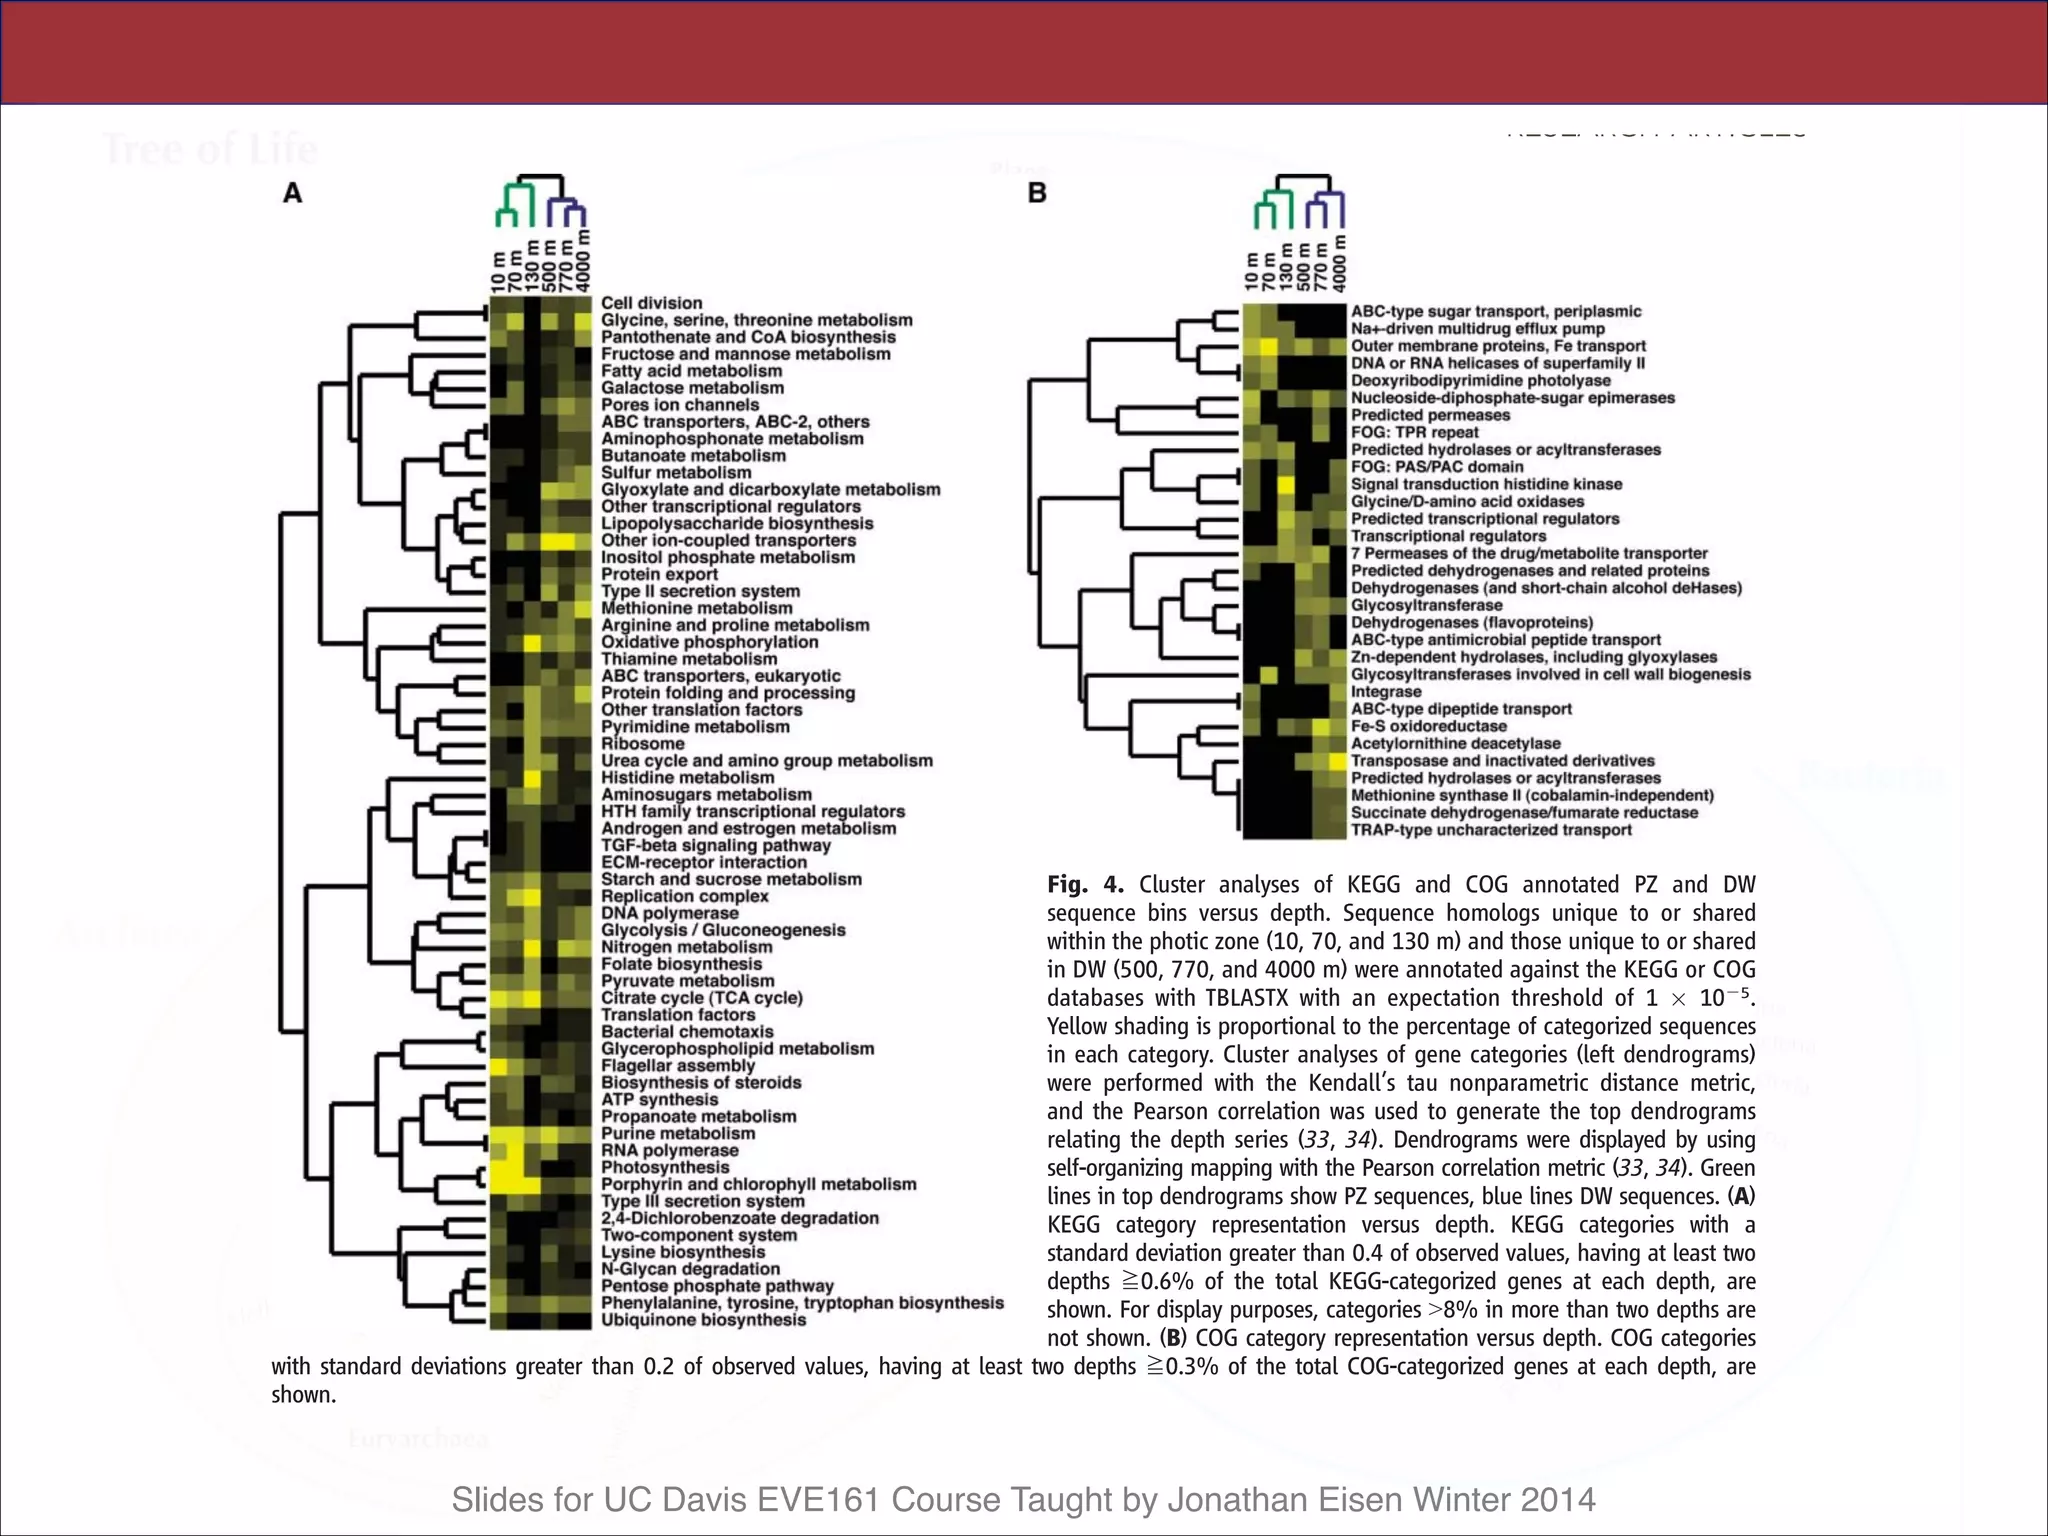
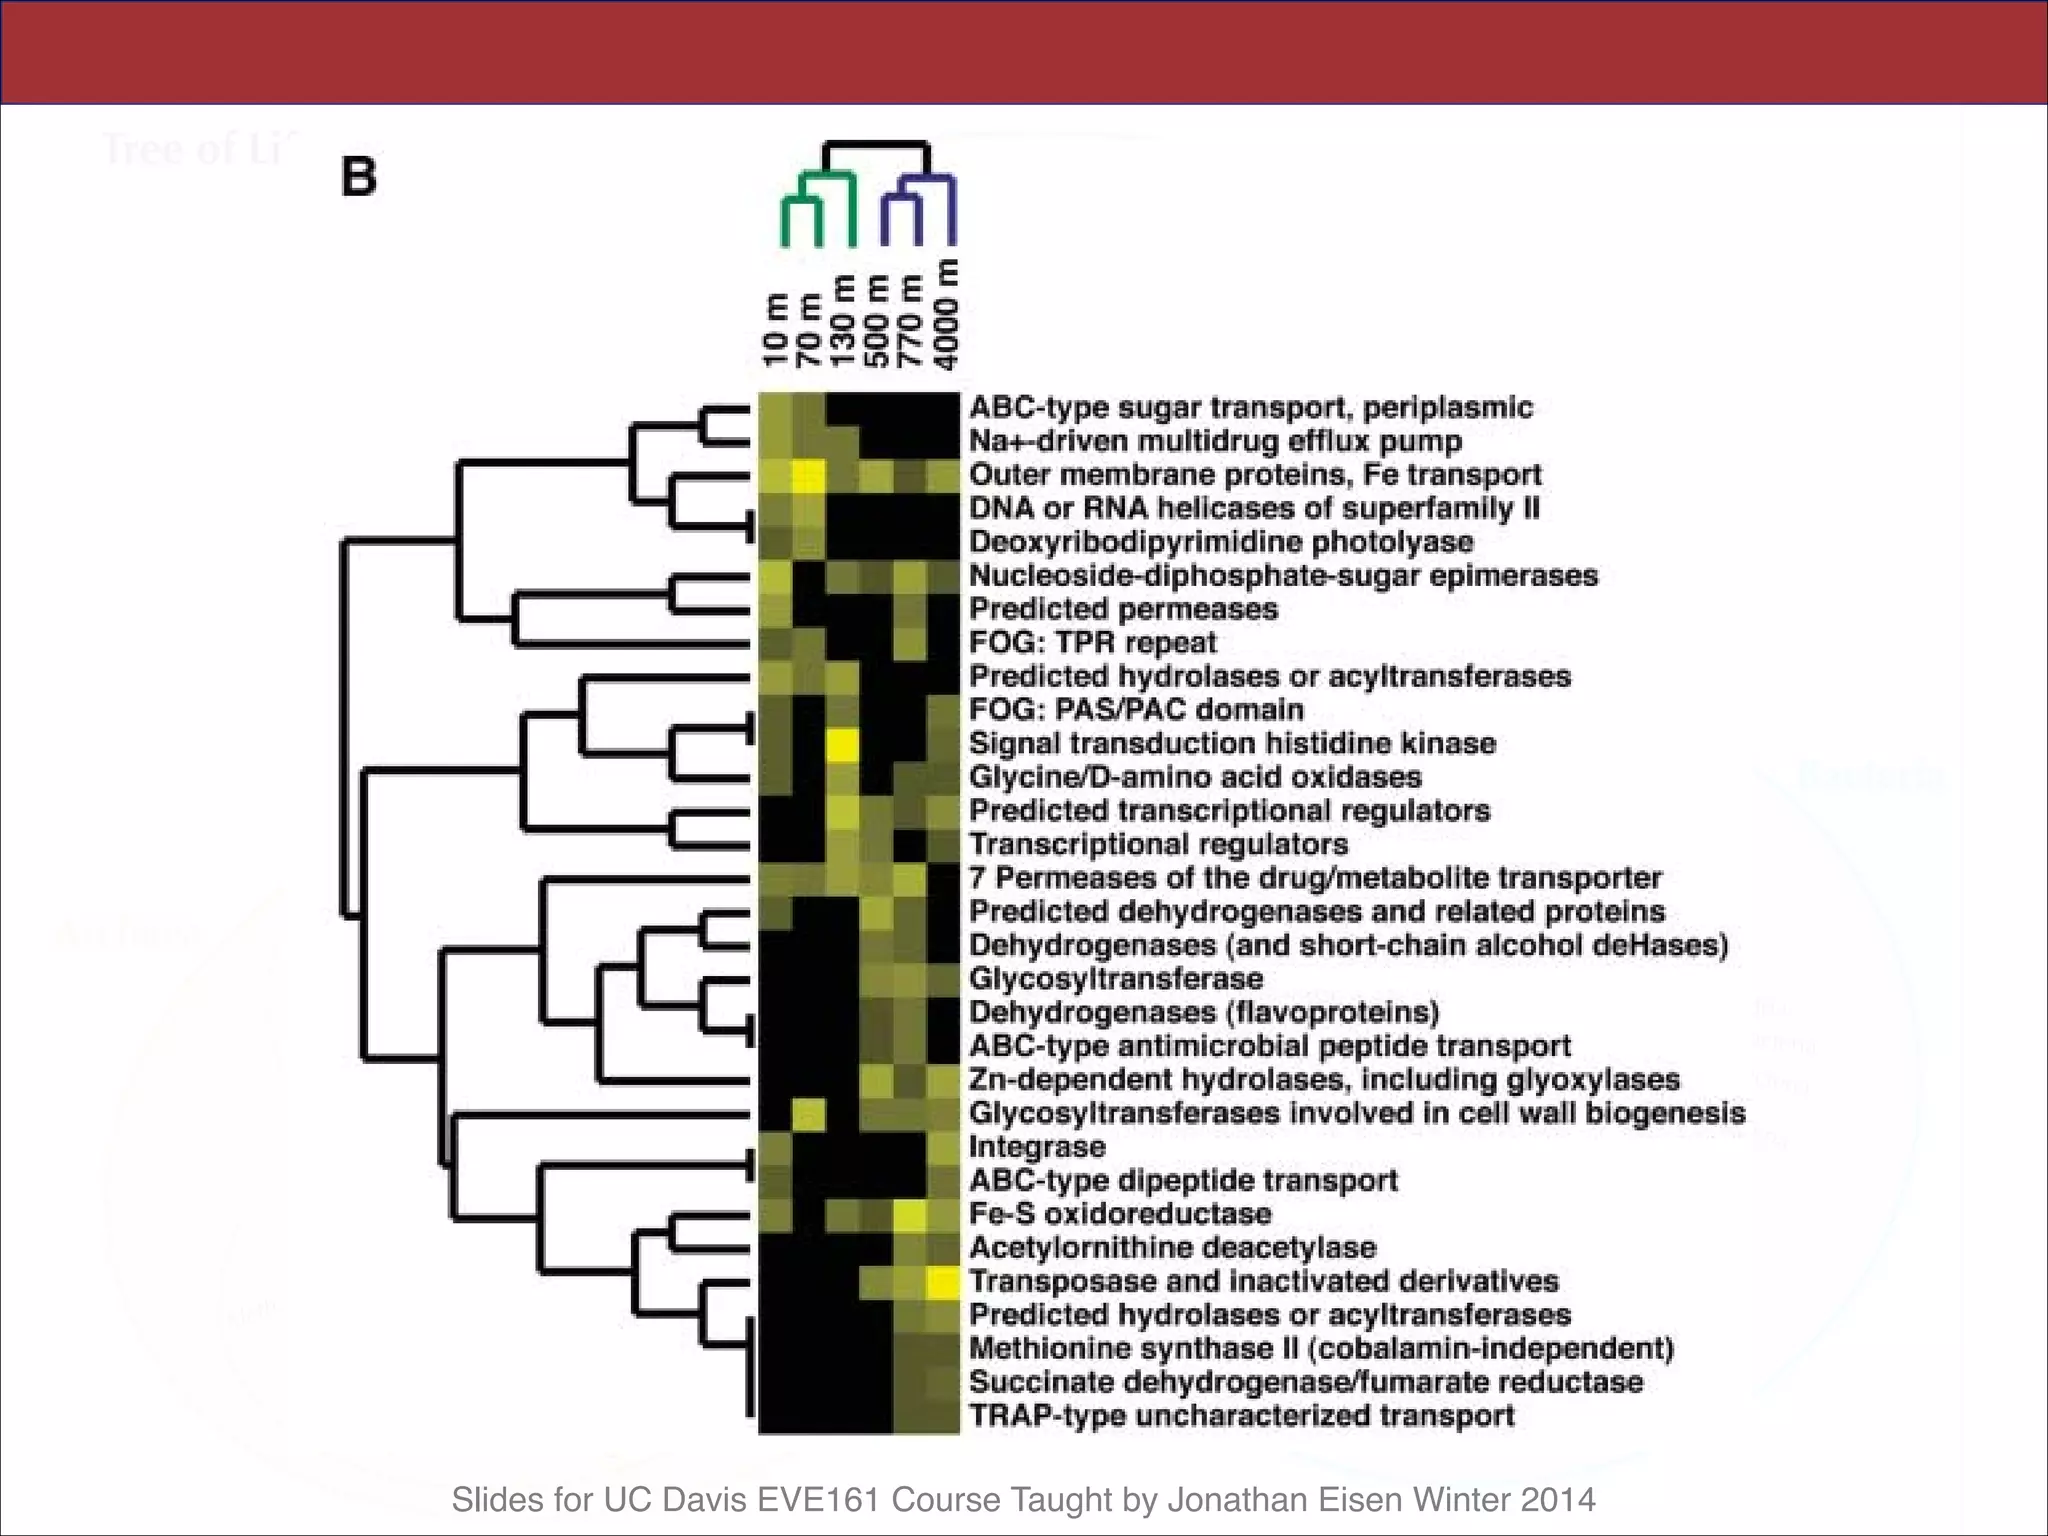
Some depth-specific gene distributions we ob-
served [e.g., transposases found predominantly
at greater depths (Fig. 4B; fig. S8)], appear to
originate from a wide variety of gene families
and genomic sources. These gene distributional
productivity, and lower effective population
sizes of deep-sea microbial communities. In
future comparative studies, similar deviations
in environmental gene stoichiometries might
be expected to provide even further insight
enabled ecological studies matures, it should
become possible to model microbial community
genomic, temporal, and spatial variability with
other environmental features. Significant future
attention will no doubt focus on interpreting
the complex interplay between genes, orga-
nisms, communities and the environment, as
well as the properties revealed that regulate
global biogeochemical cycles. Future efforts
in this area will advance our general perspective
on microbial ecology and evolution and elu-
cidate the biological dynamics that mediate
the flux of matter and energy in the world’s
oceans.
References and Notes
1. E. Forbes, in Physical Atlas of Natural Phenomena,
A. K. Johnston, Ed. (William Blackwood & Sons, London
and Edinburgh, 1856).
2. P. W. Hochachka, G. N. Somero, Biochemical Adaptation
(Princeton Univ. Press, Princeton, NJ, 1984),
pp. 450–495.
3. G. Rocap et al., Nature 424, 1042 (2003).
4. Z. I. Johnson et al., manuscript submitted.
5. N. J. West et al., Microbiology 147, 1731 (2001).
6. A. A. Yayanos, Annu. Rev. Microbiol. 49, 777 (1995).
7. N. R. Pace, Science 276, 734 (1997).
8. M. S. Rappe´, S. J. Giovannoni, Annu. Rev. Microbiol. 57,
369 (2003).
9. M. T. Suzuki et al., Microb Ecol (2005).
10. O. Be´ja` et al., Environ. Microbiol. 2, 516 (2000).
11. R. M. Morris, M. S. Rappe´, E. Urbach, S. A. Connon,
S. J. Giovannoni, Appl. Environ. Microbiol. 70, 2836
(2004).
12. S. Y. Moon-van der Staay et al., Nature 409, 607
(2001).
13. J. A. Fuhrman, K. McCallum, A. A. Davis, Nature 356, 148
(1992).
14. E. F. DeLong, Proc. Natl. Acad. Sci. U.S.A. 89, 5685
(1992).
15. M. B. Karner et al., Nature 409, 507 (2001).
16. J. Handelsman, Microbiol. Mol. Biol. Rev. 68, 669
(2004).
17. E. F. Delong, Nat Rev Microbiol (2005).
18. G. W. Tyson et al., Nature 428, 37 (2004).
19. J. C. Venter et al., Science 304, 66 (2004).
20. S. G. Tringe et al., Science 308, 554 (2005).
21. S. J. Hallam et al., Science 305, 1457 (2004).
22. D. M. Karl, R. Lukas, Deep-Sea Res. II 43, 129
(1996).
23. D. M. Karl et al., Deep-Sea Res. II 48, 1449 (2001).
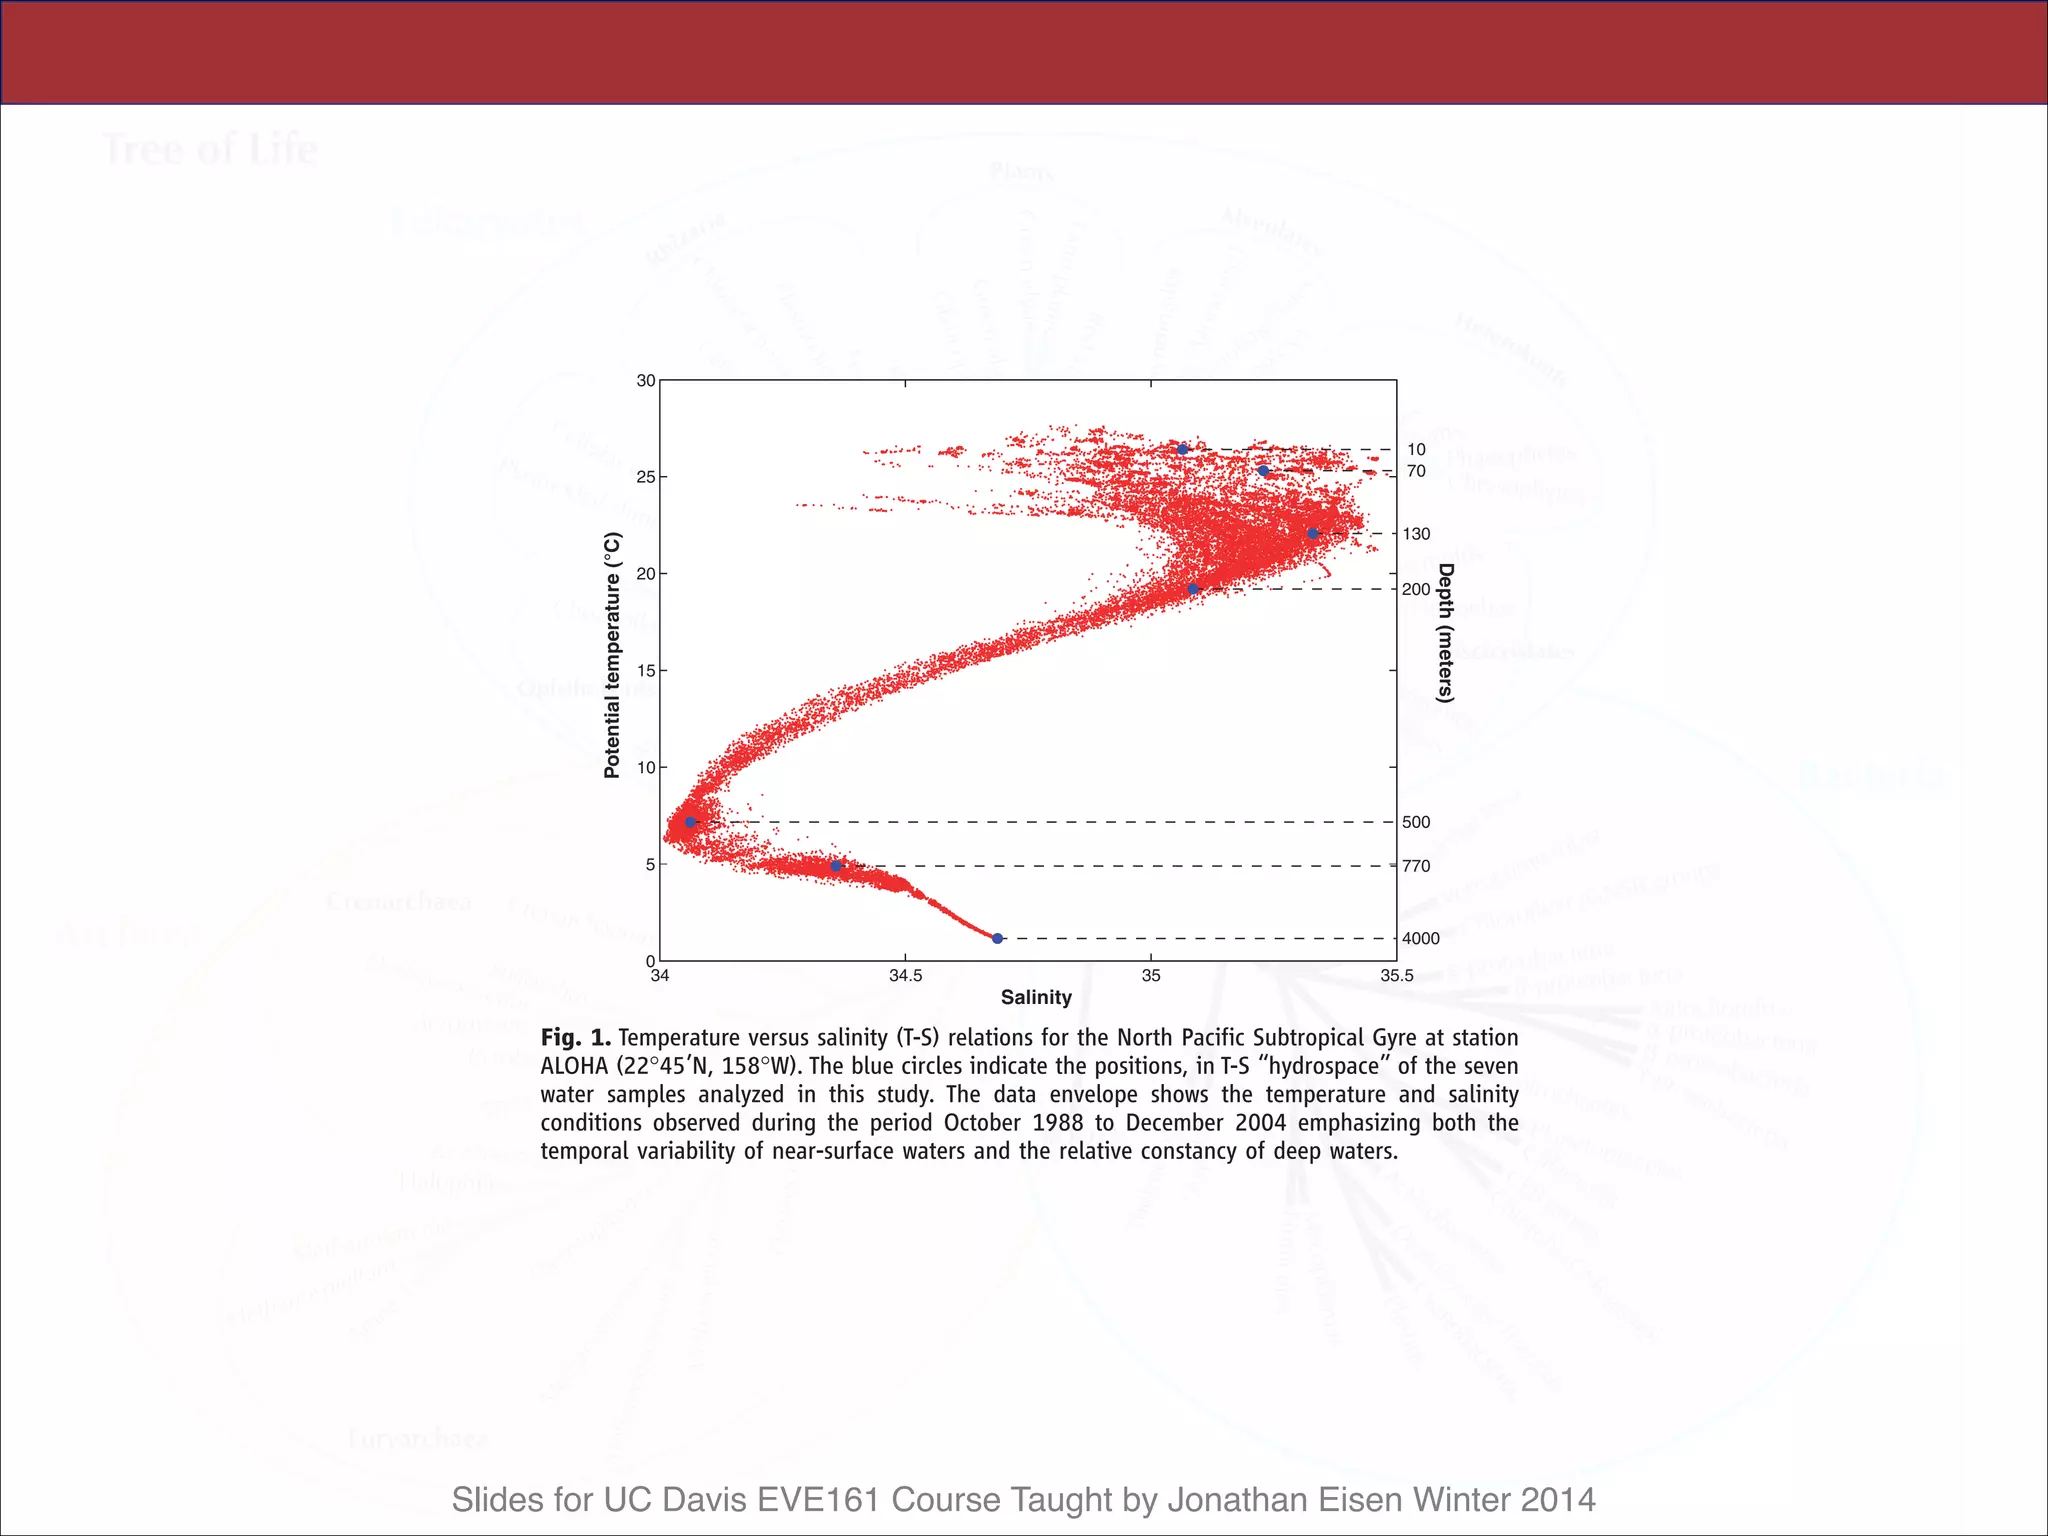
Fig. 5. Cyanophage and cyanobacteria dis-
tributions in microbial community DNA. The
percentage of total sequences derived from
cyanophage, total cyanobacteria, total Prochlor-
ococcus spp., high-light Prochlorococcus, low-
light Prochlorococcus spp., or Synechococcus
spp., from each depth. Taxa were tentatively
assigned according to the origin of top HSPs in
TBLASTX searches, followed by subsequent
manual inspection and curation.
0
100
200
300
400
500
0 10 20
cyanobacteria
Prochlorococcus
Synechococcus
HL Prochlorococcus
LL Prochlorococcus
cyanophages
Percent total sequences per depth
Depth(m)
RESEARCH ARTICLES](https://image.slidesharecdn.com/eve161-140323130935-phpapp02/75/UC-Davis-EVE161-Lecture-17-by-phylogenomics-40-2048.jpg)

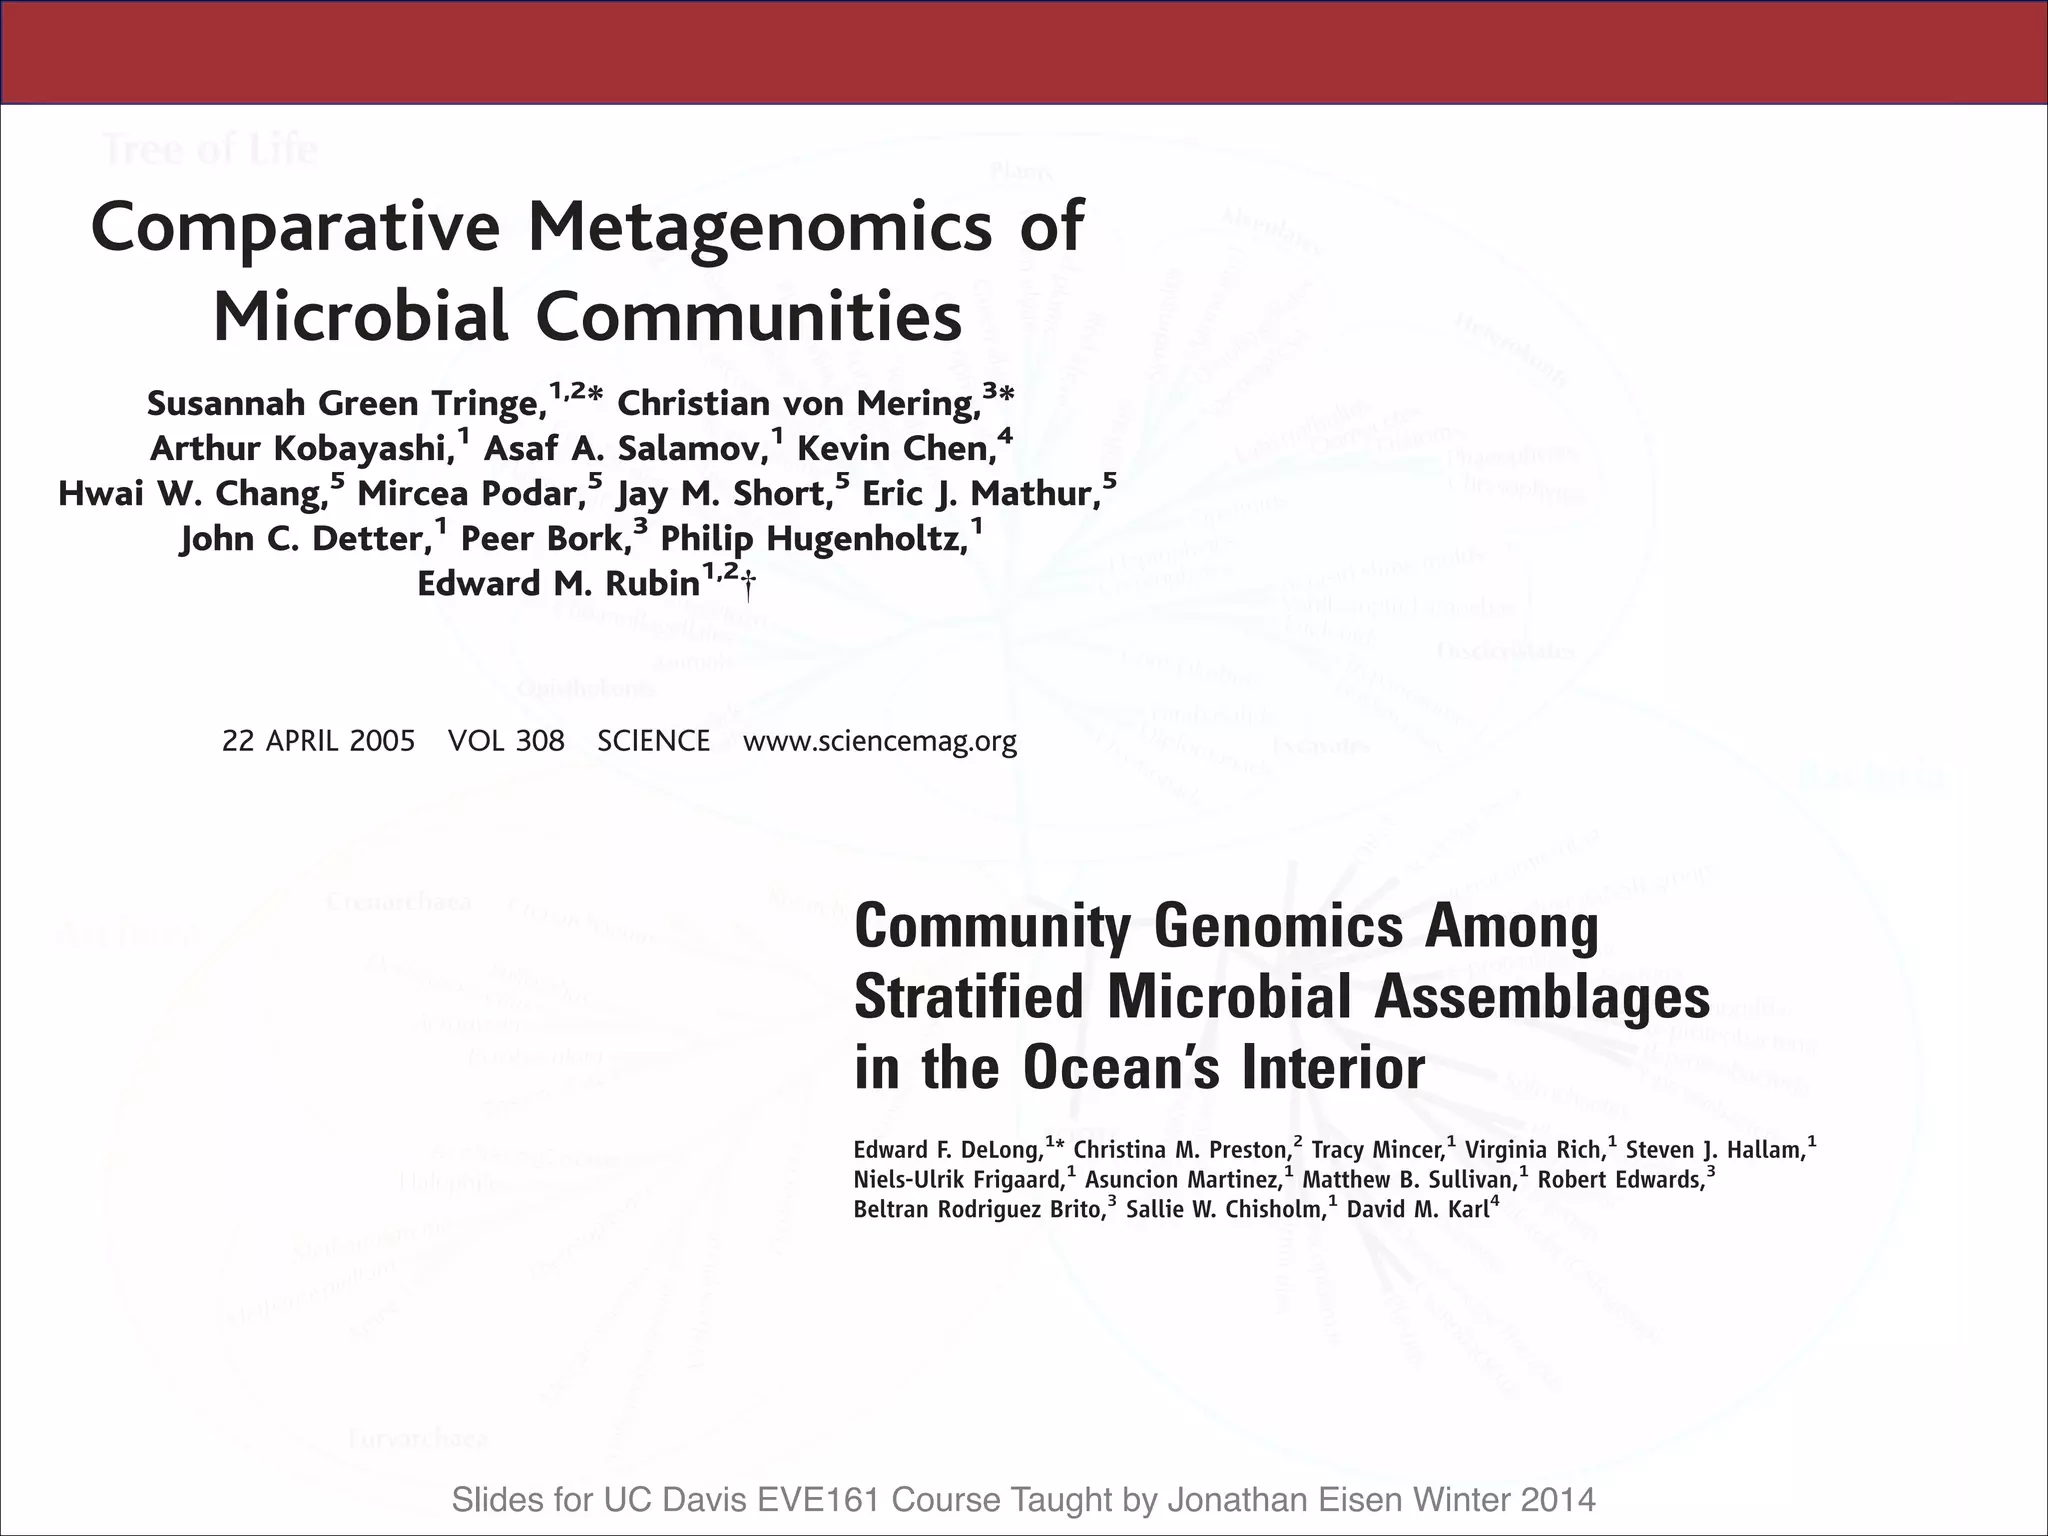
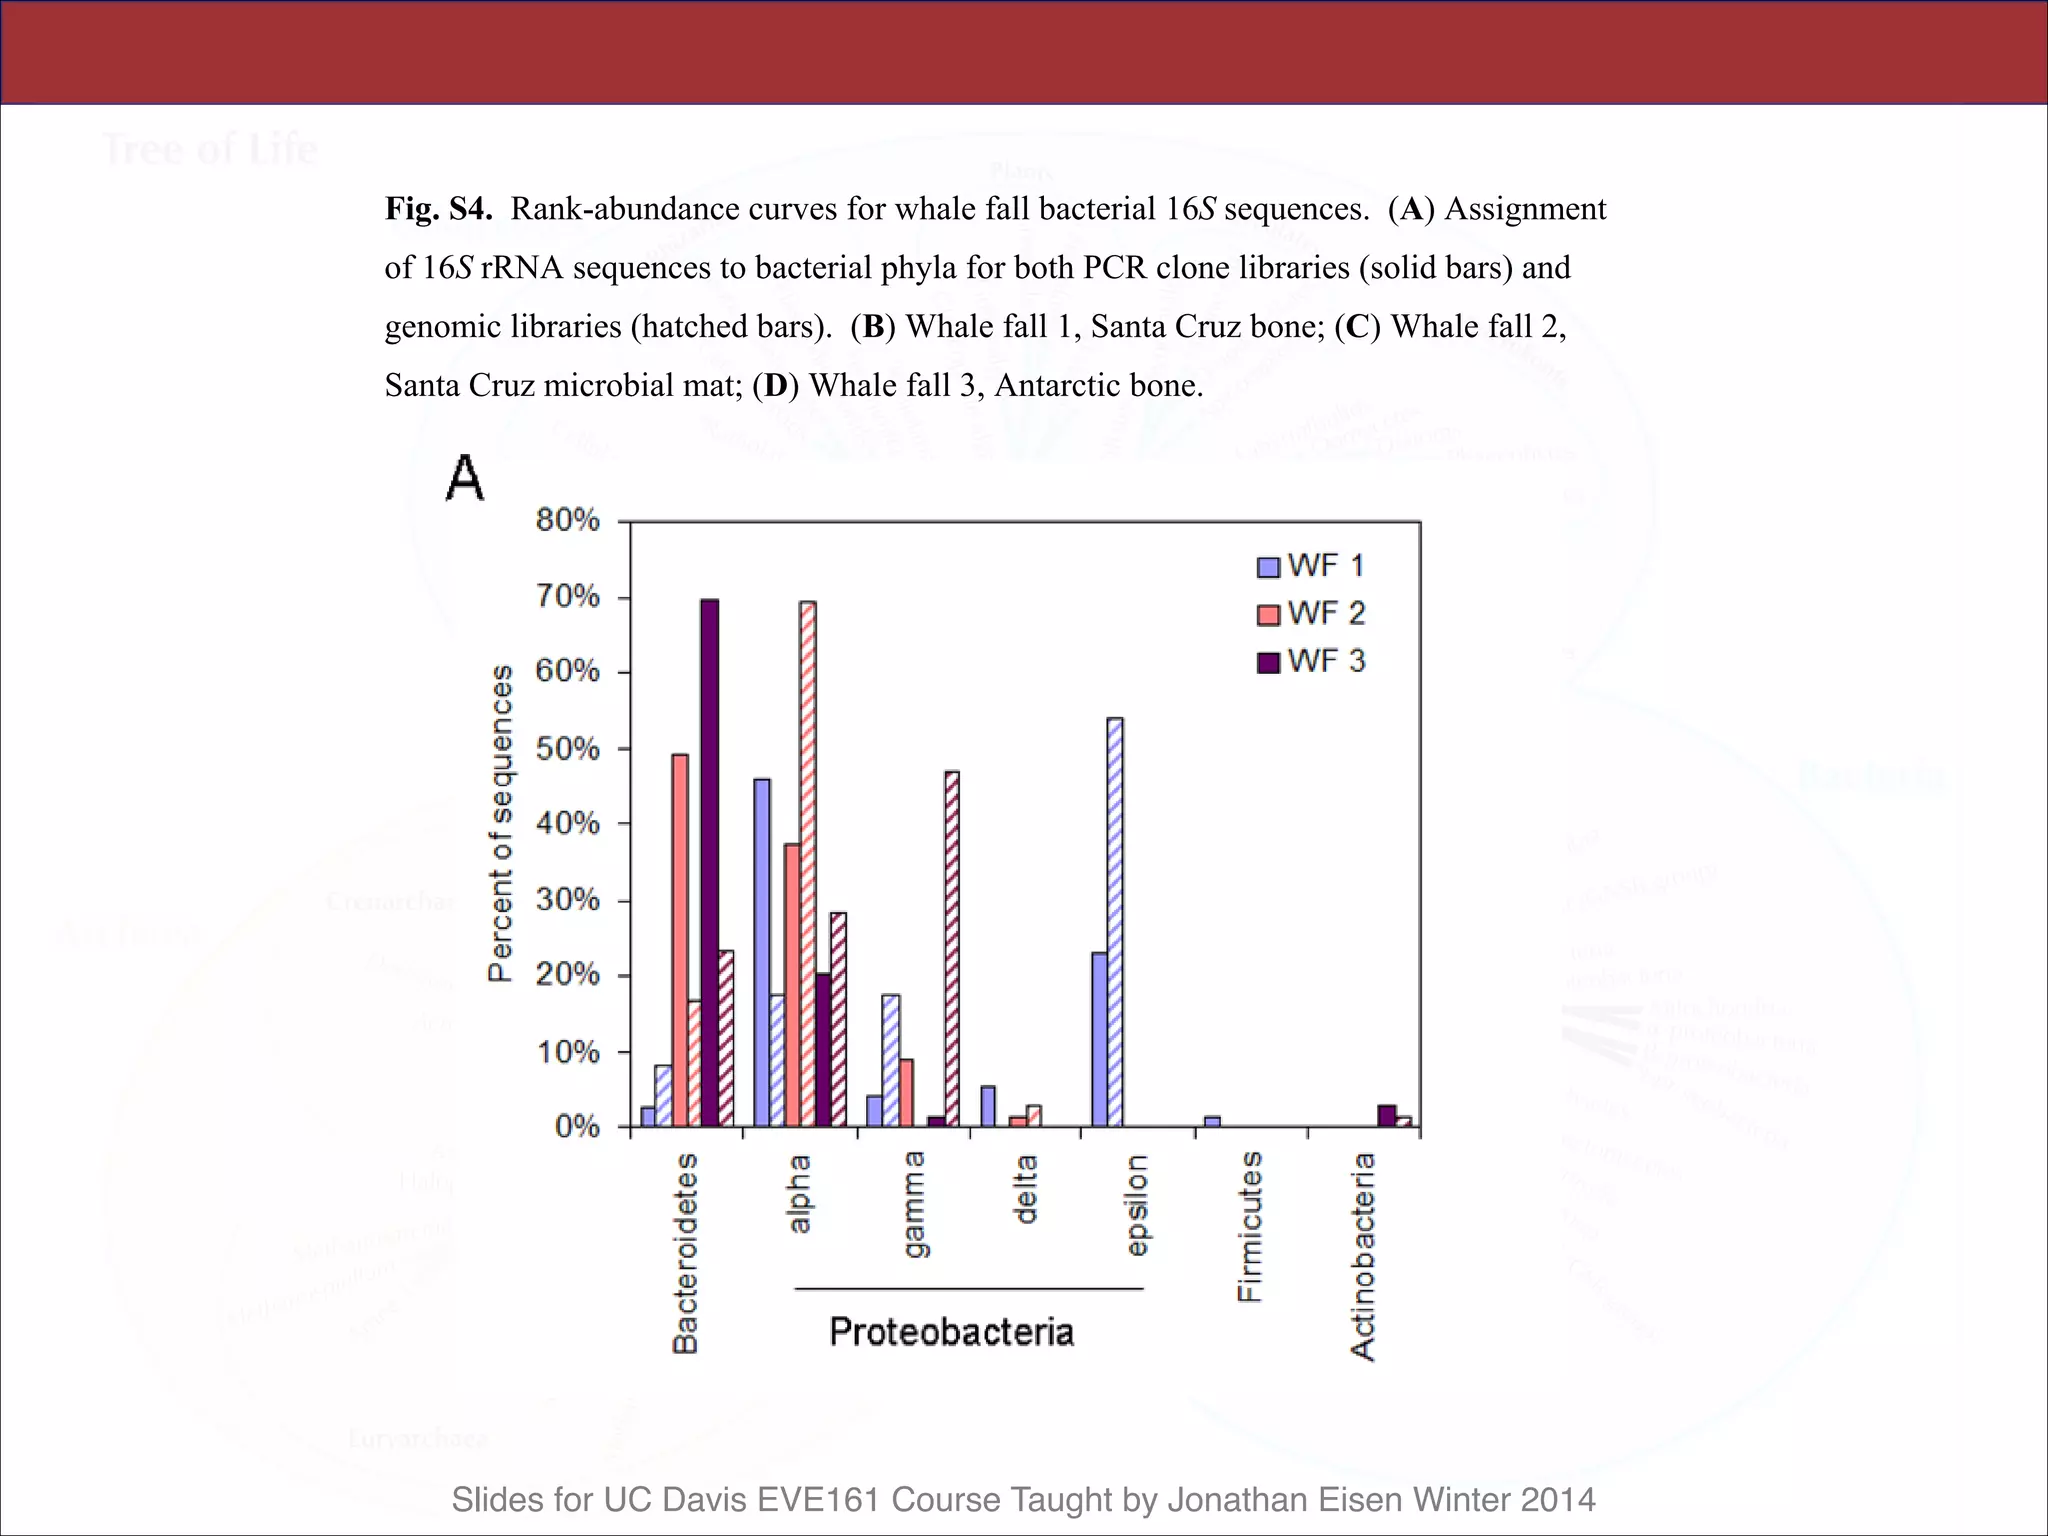
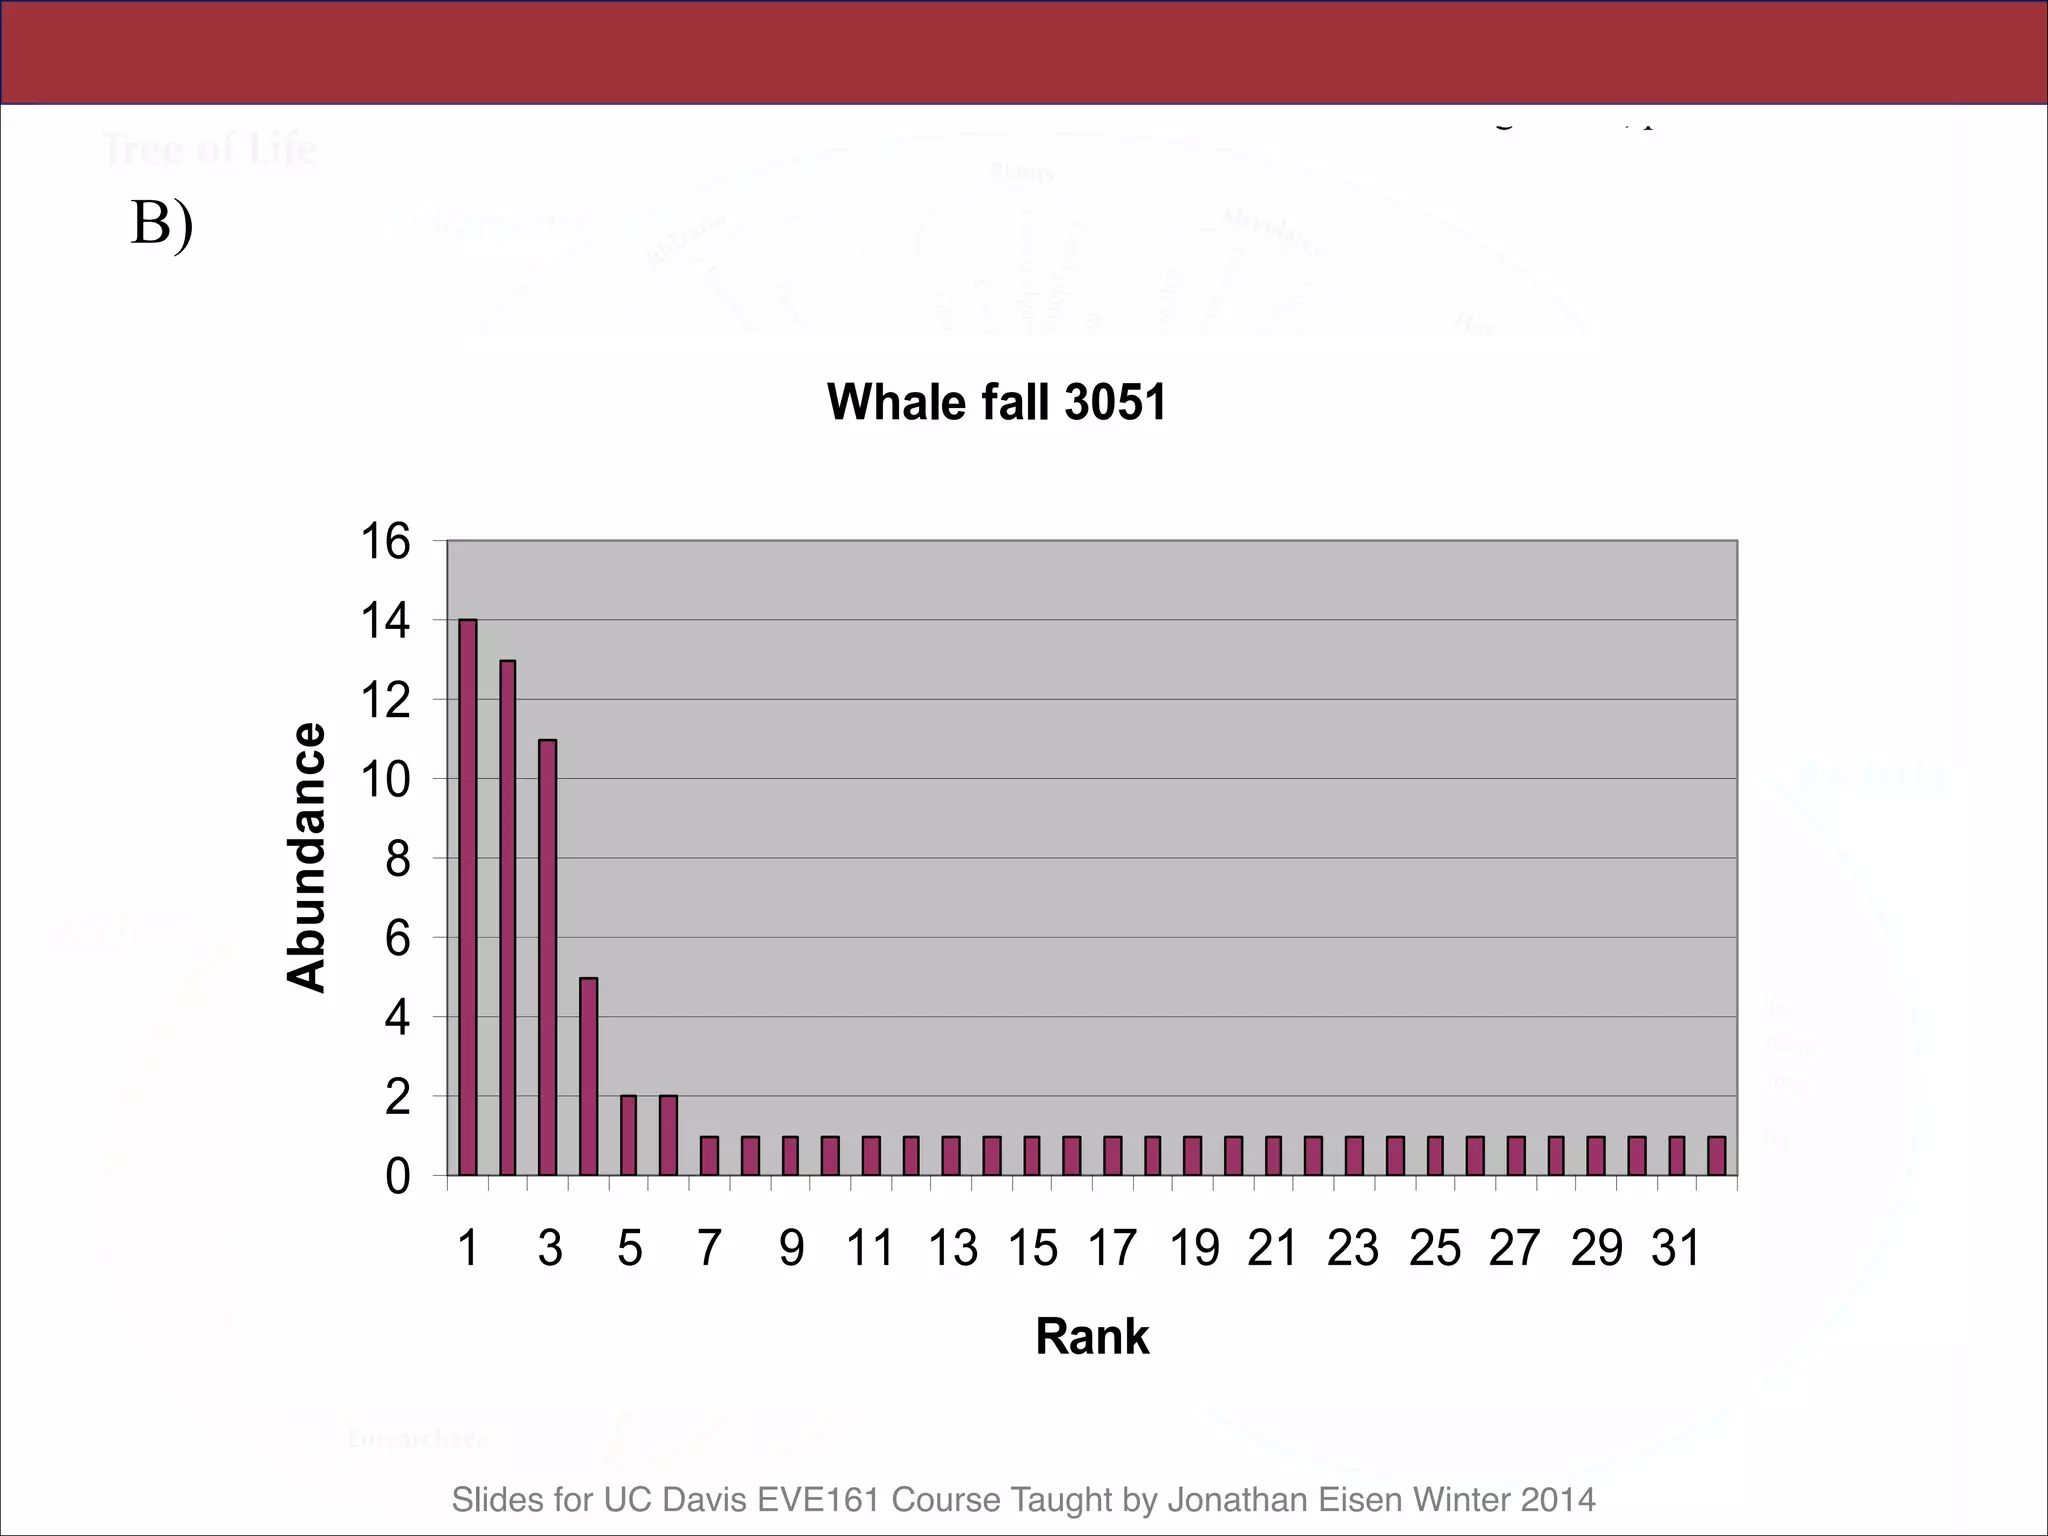
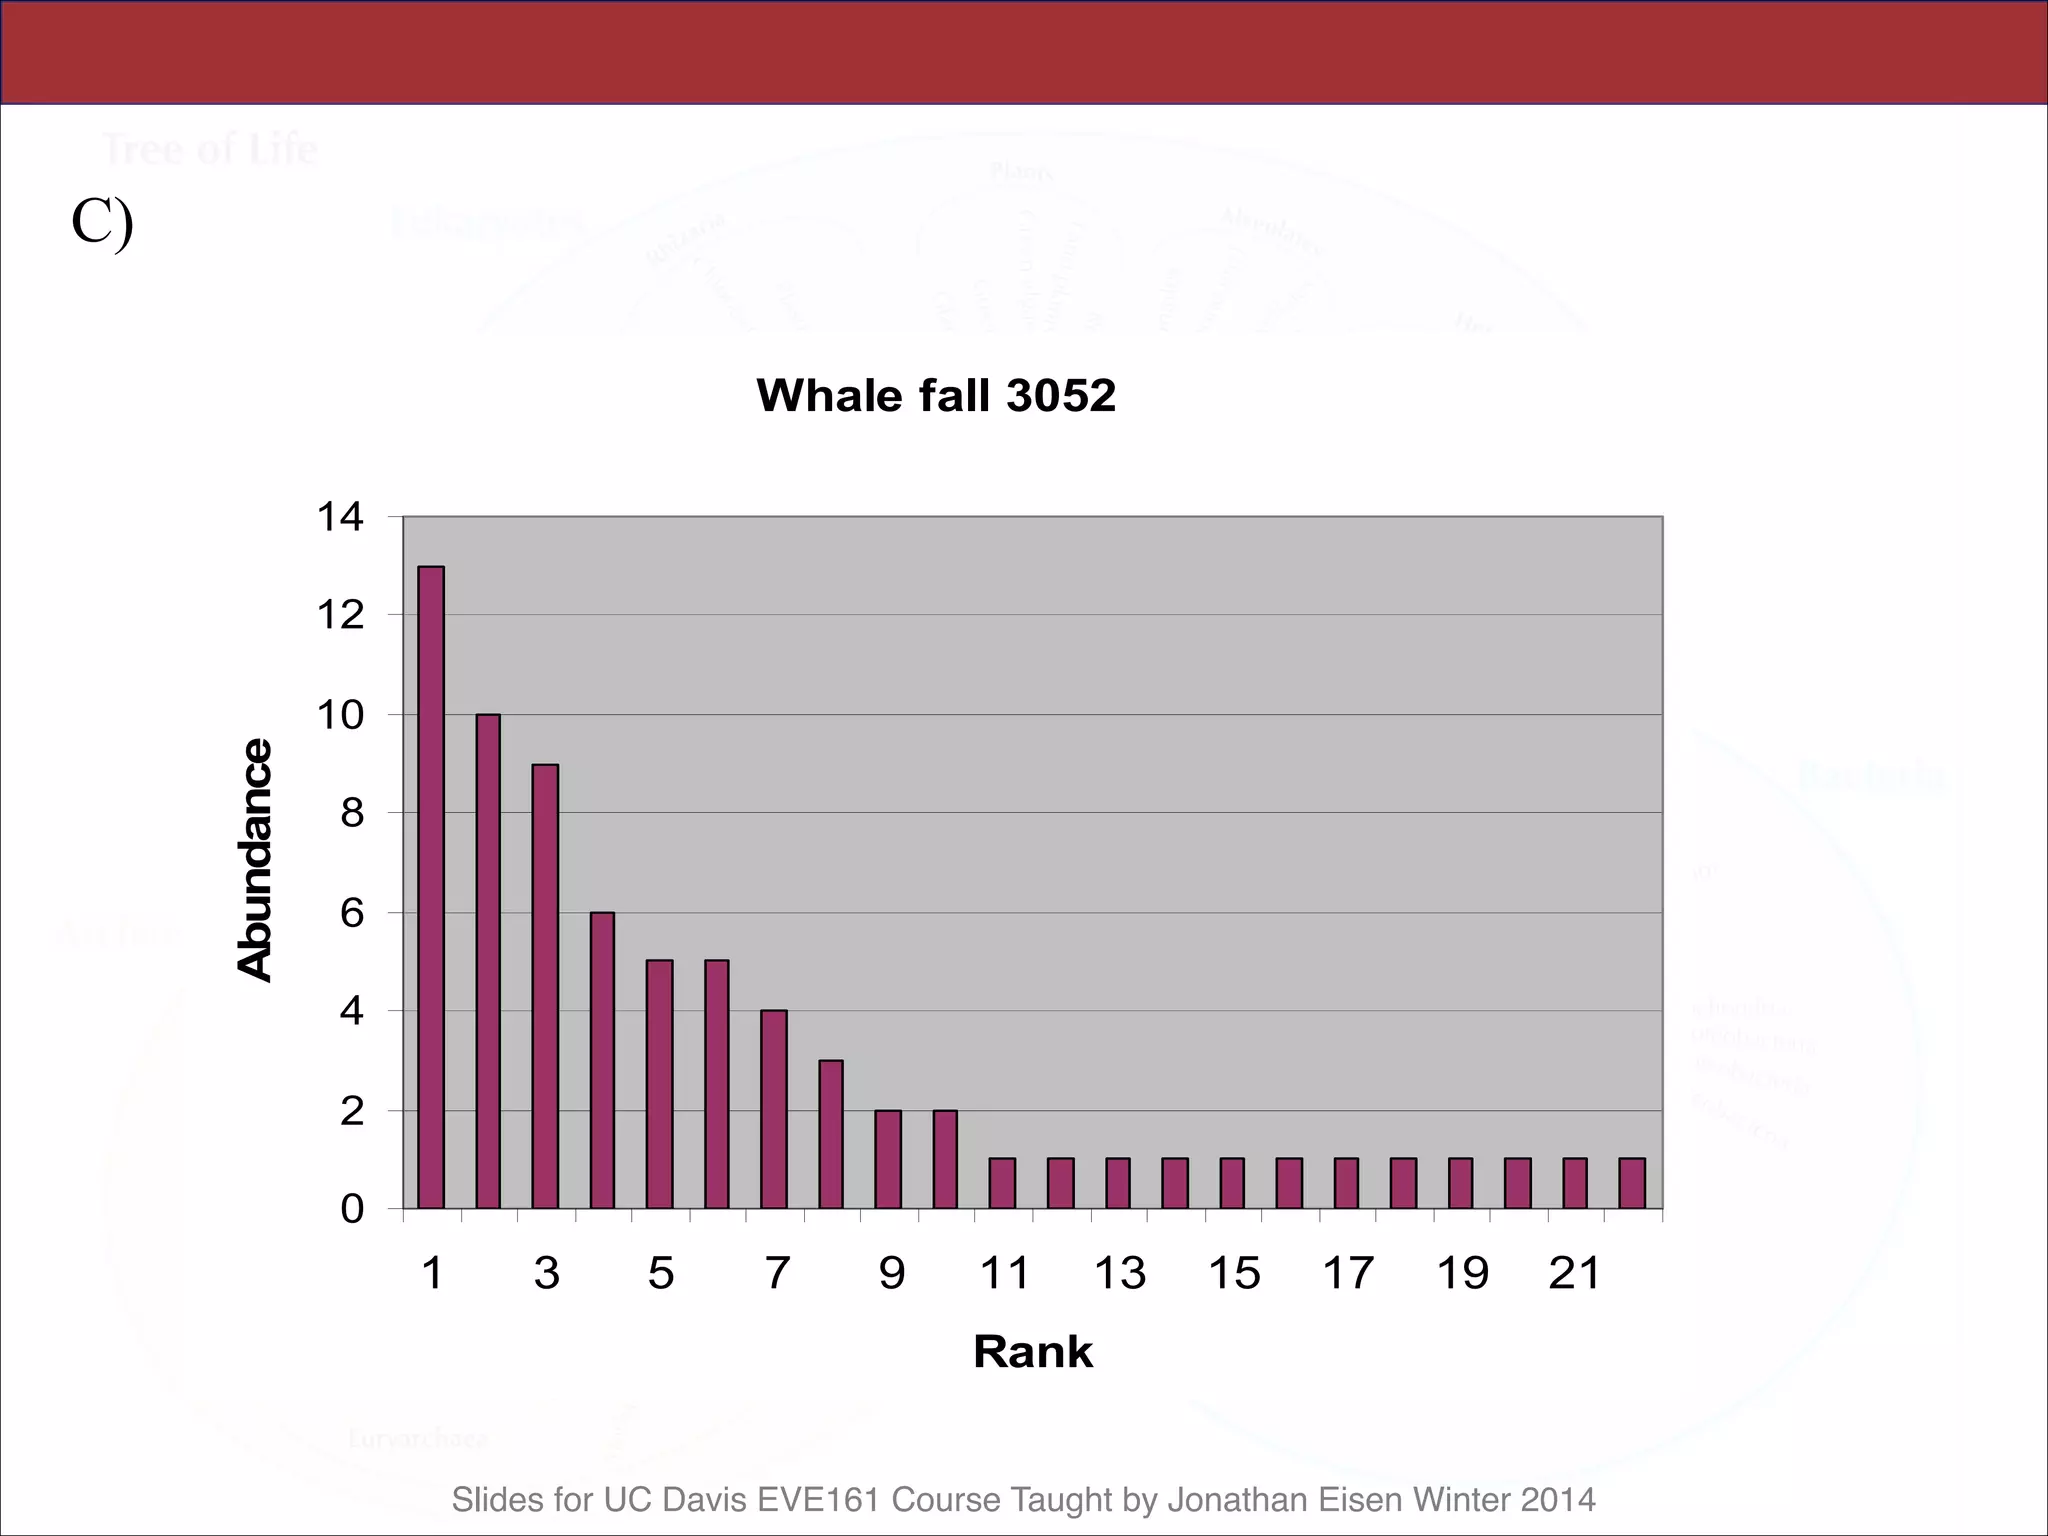
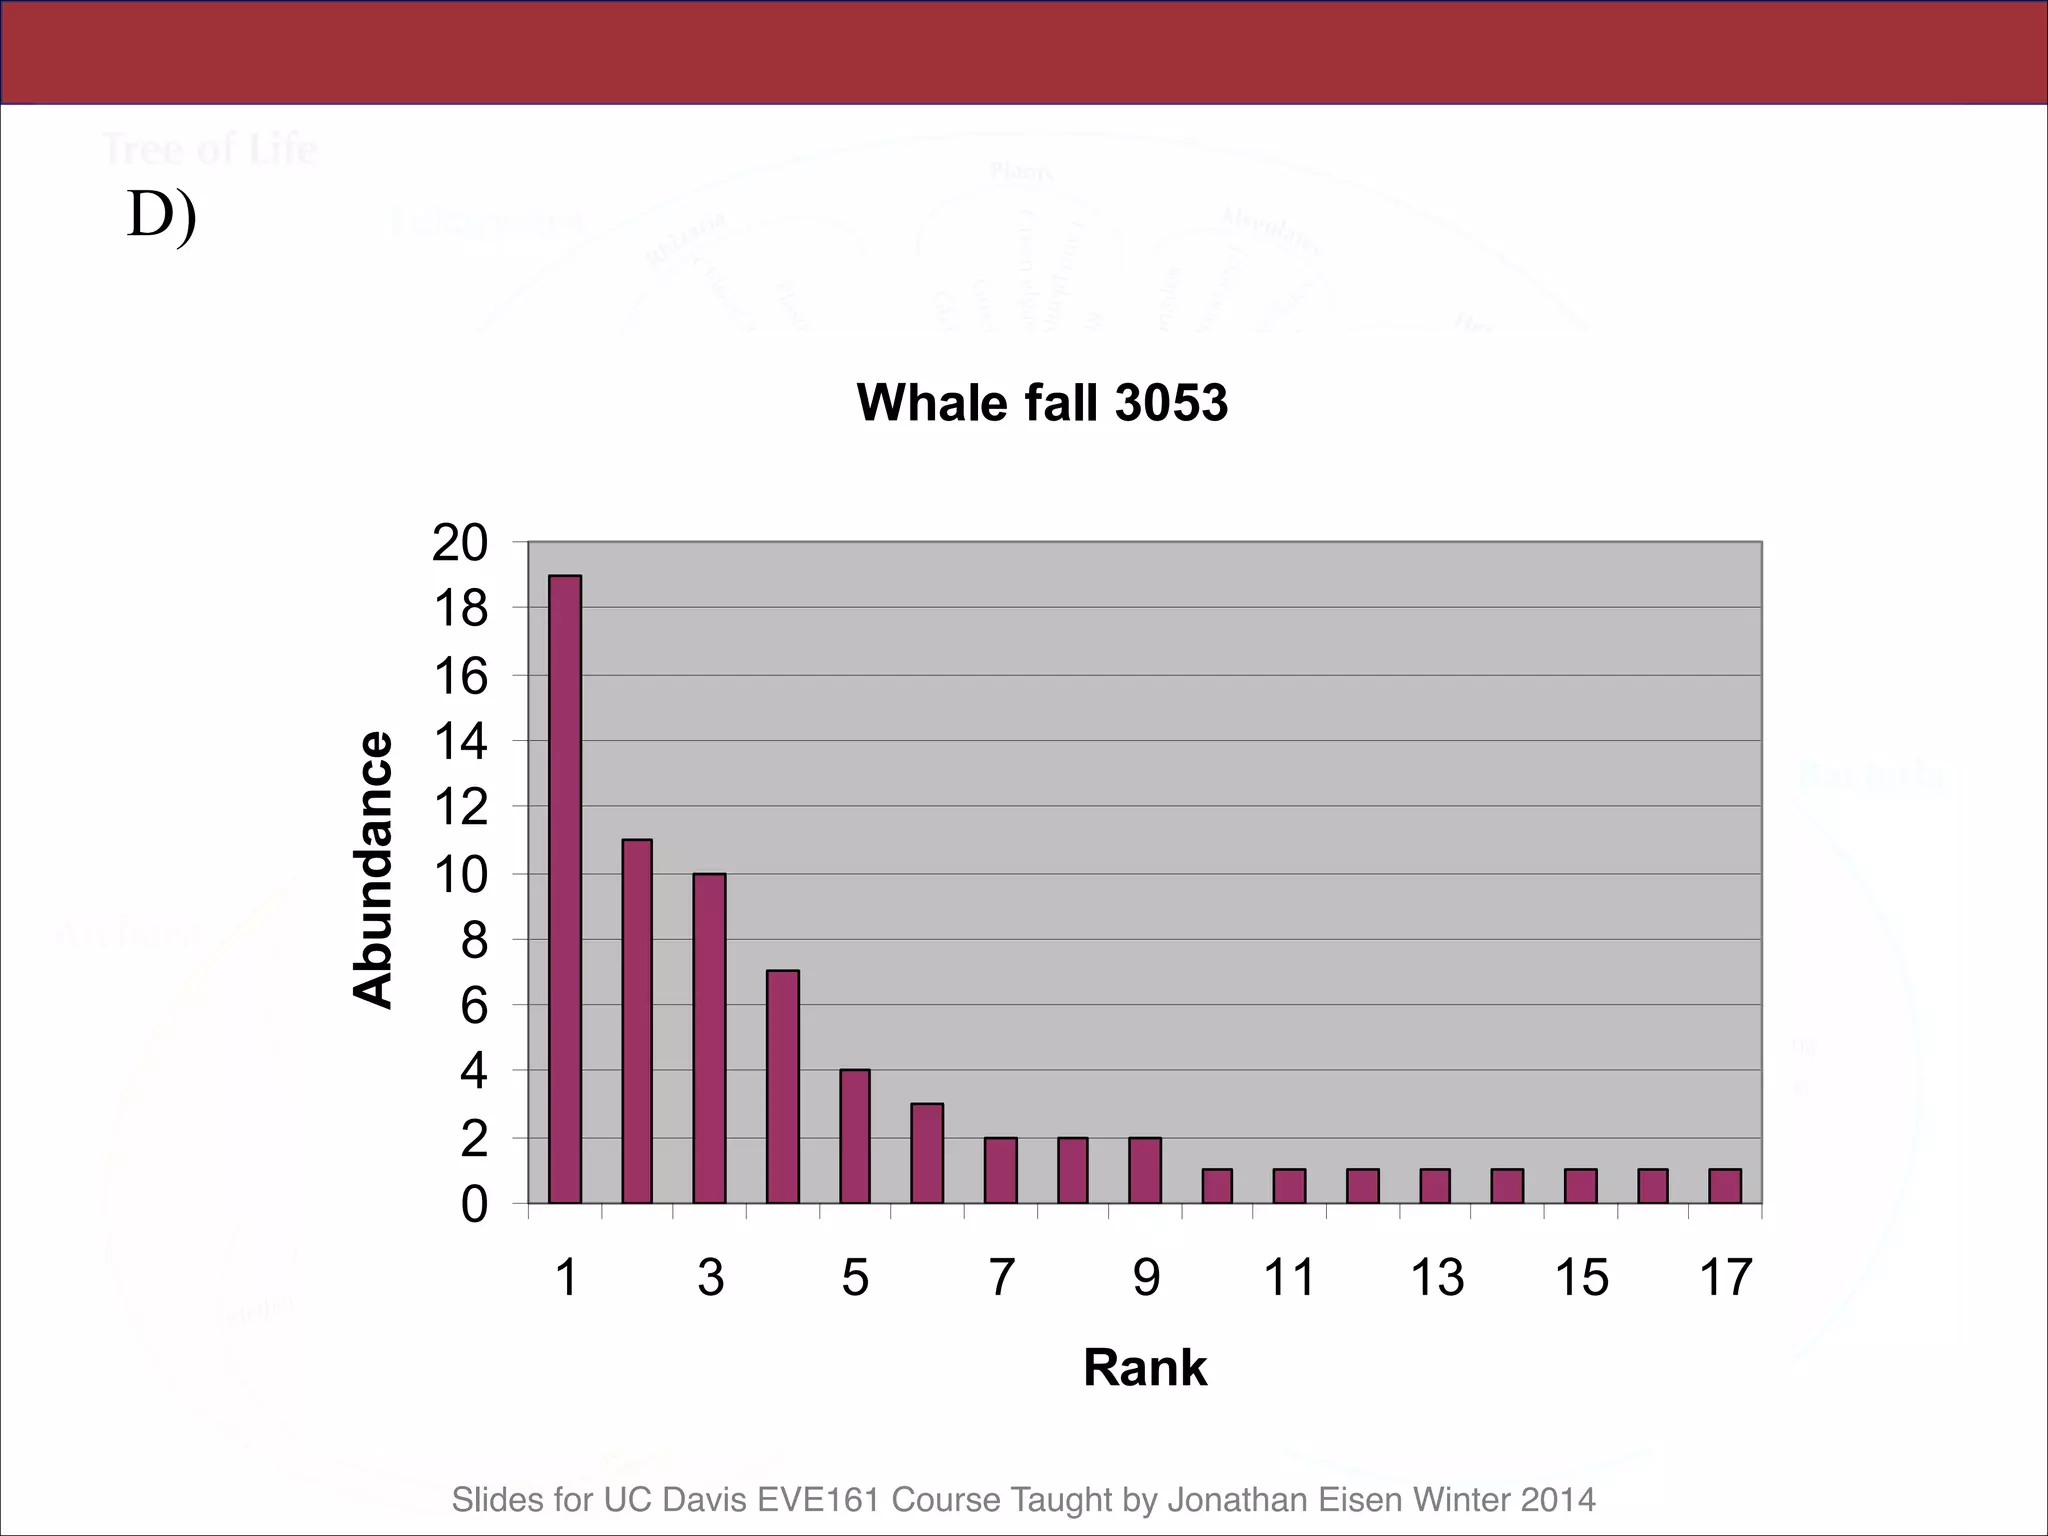
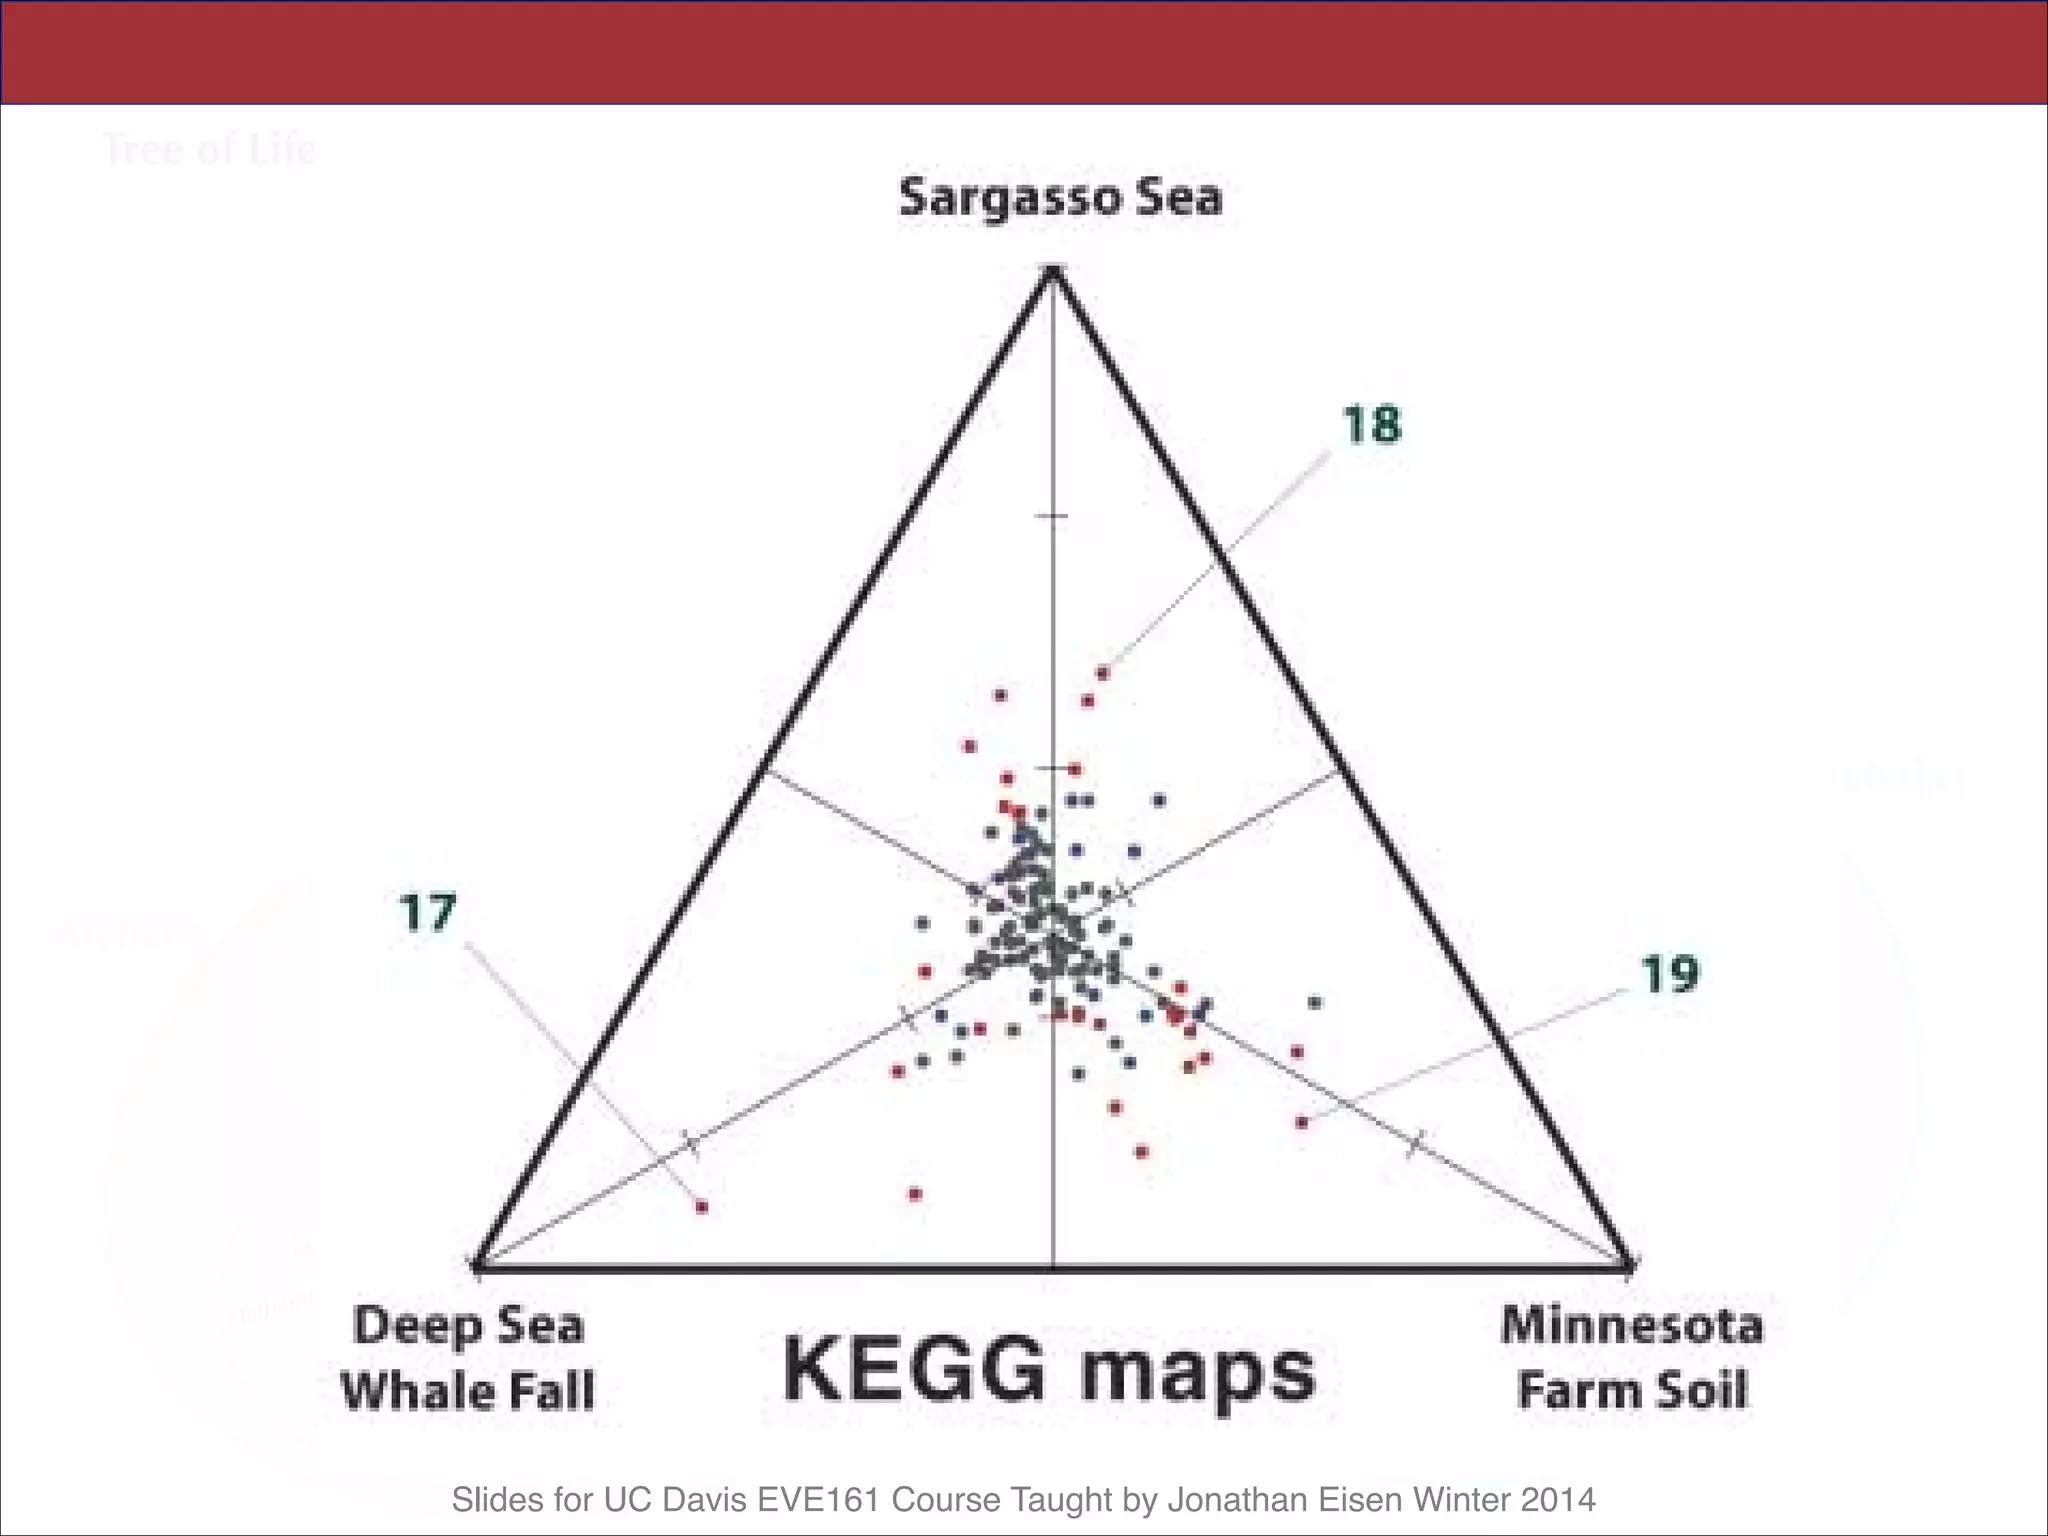
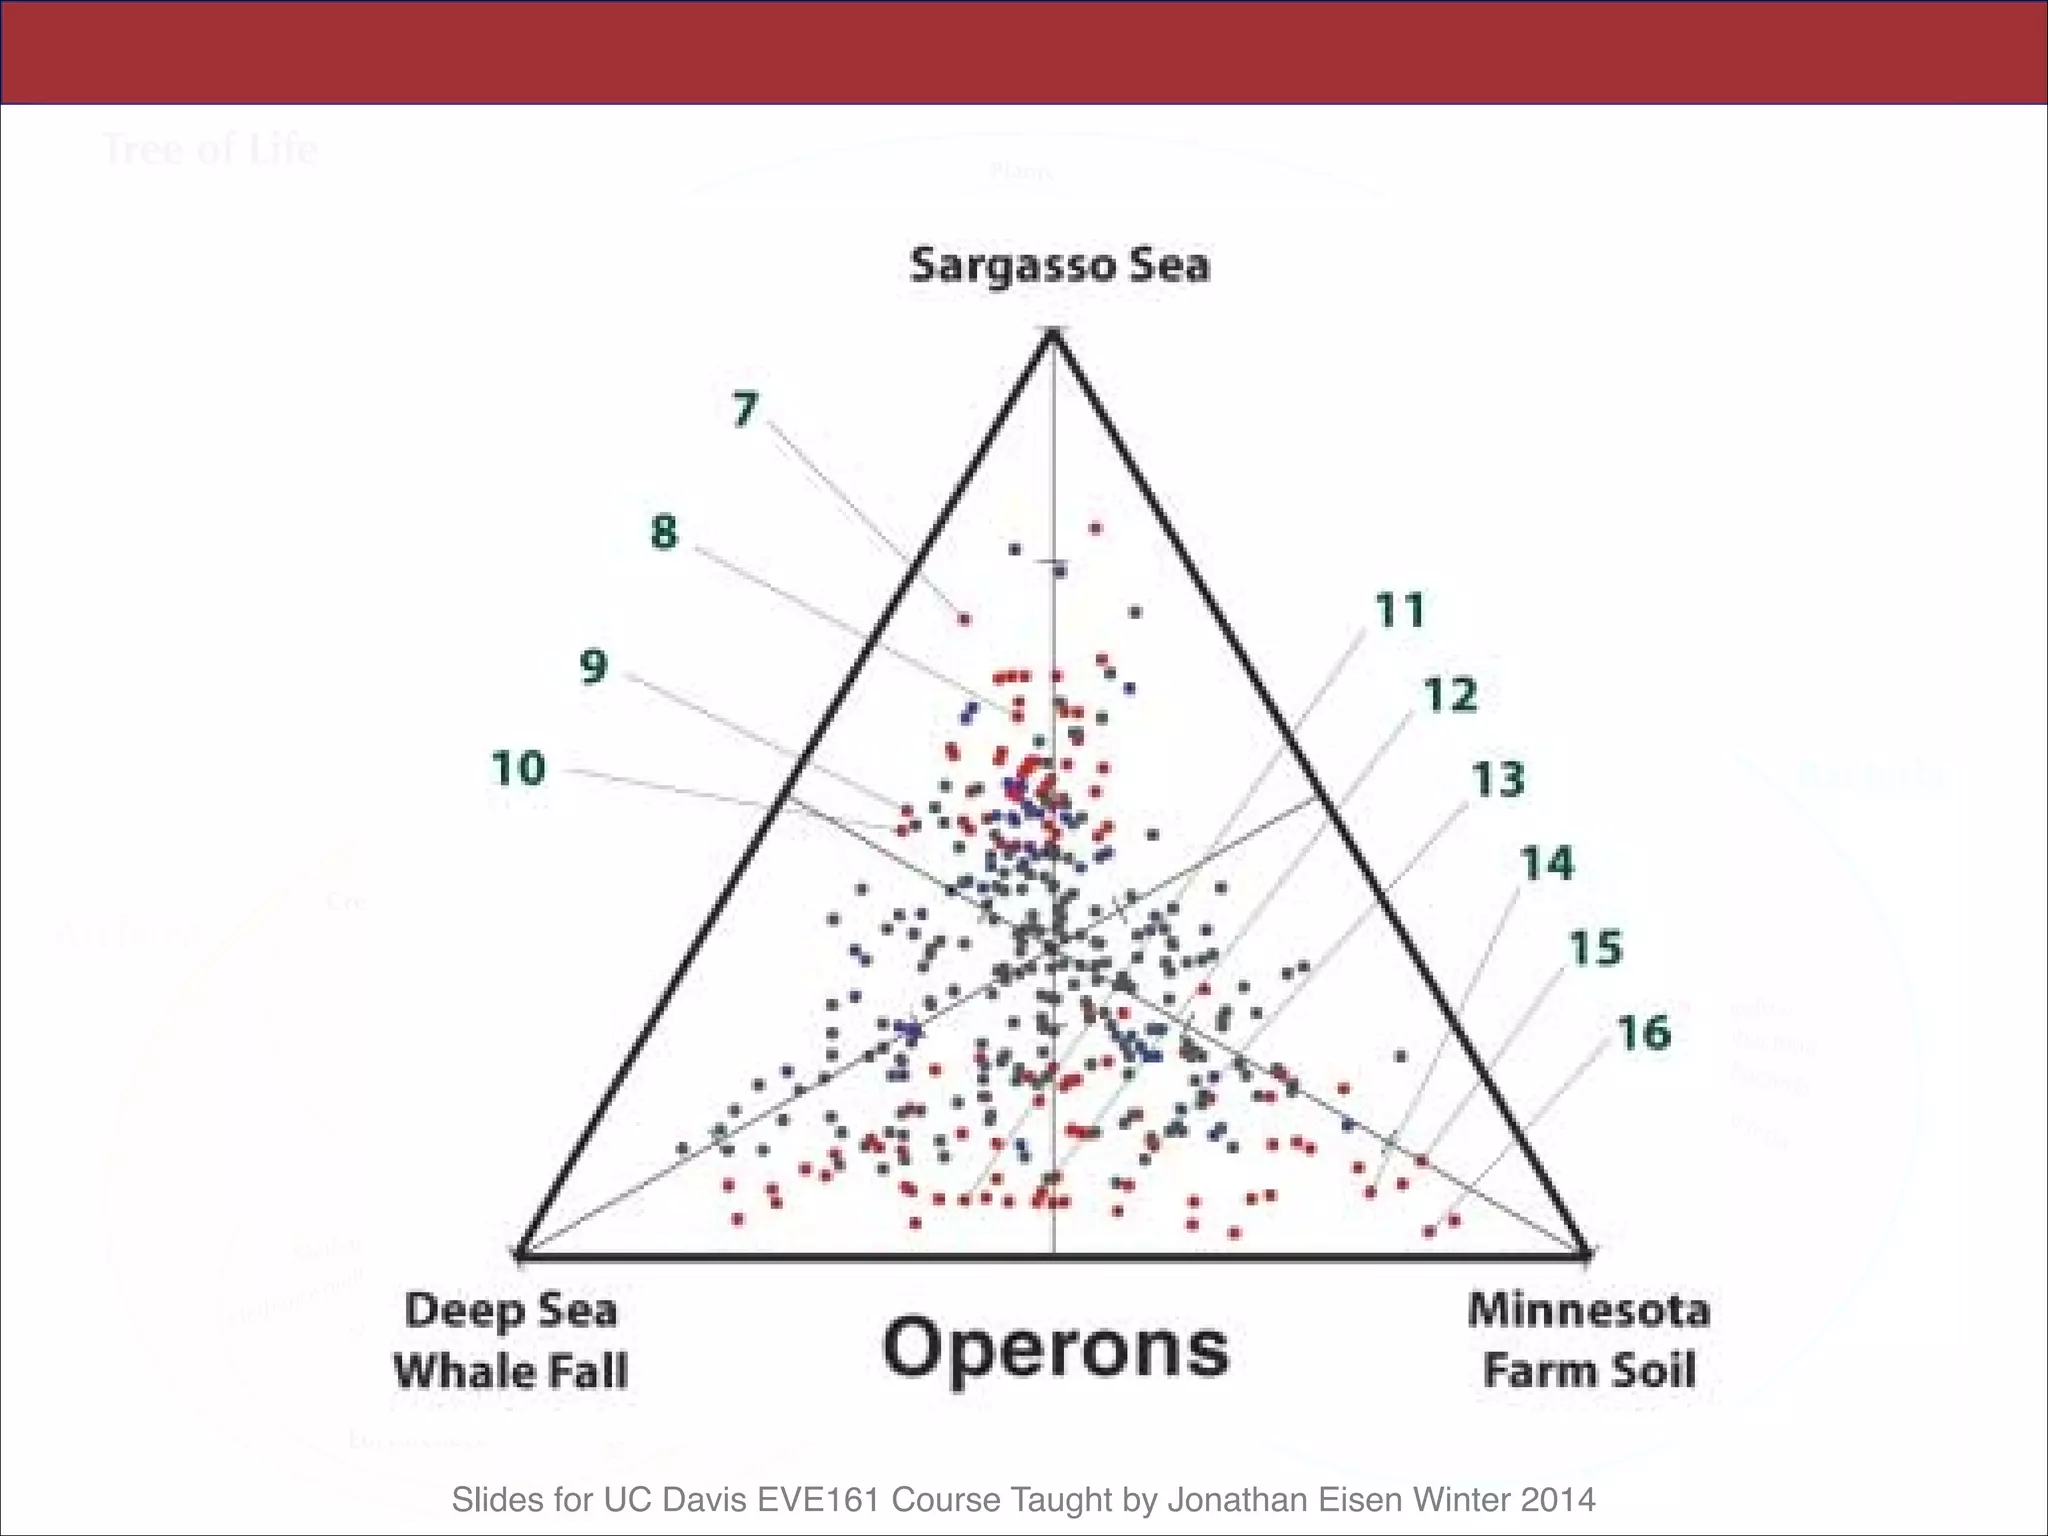
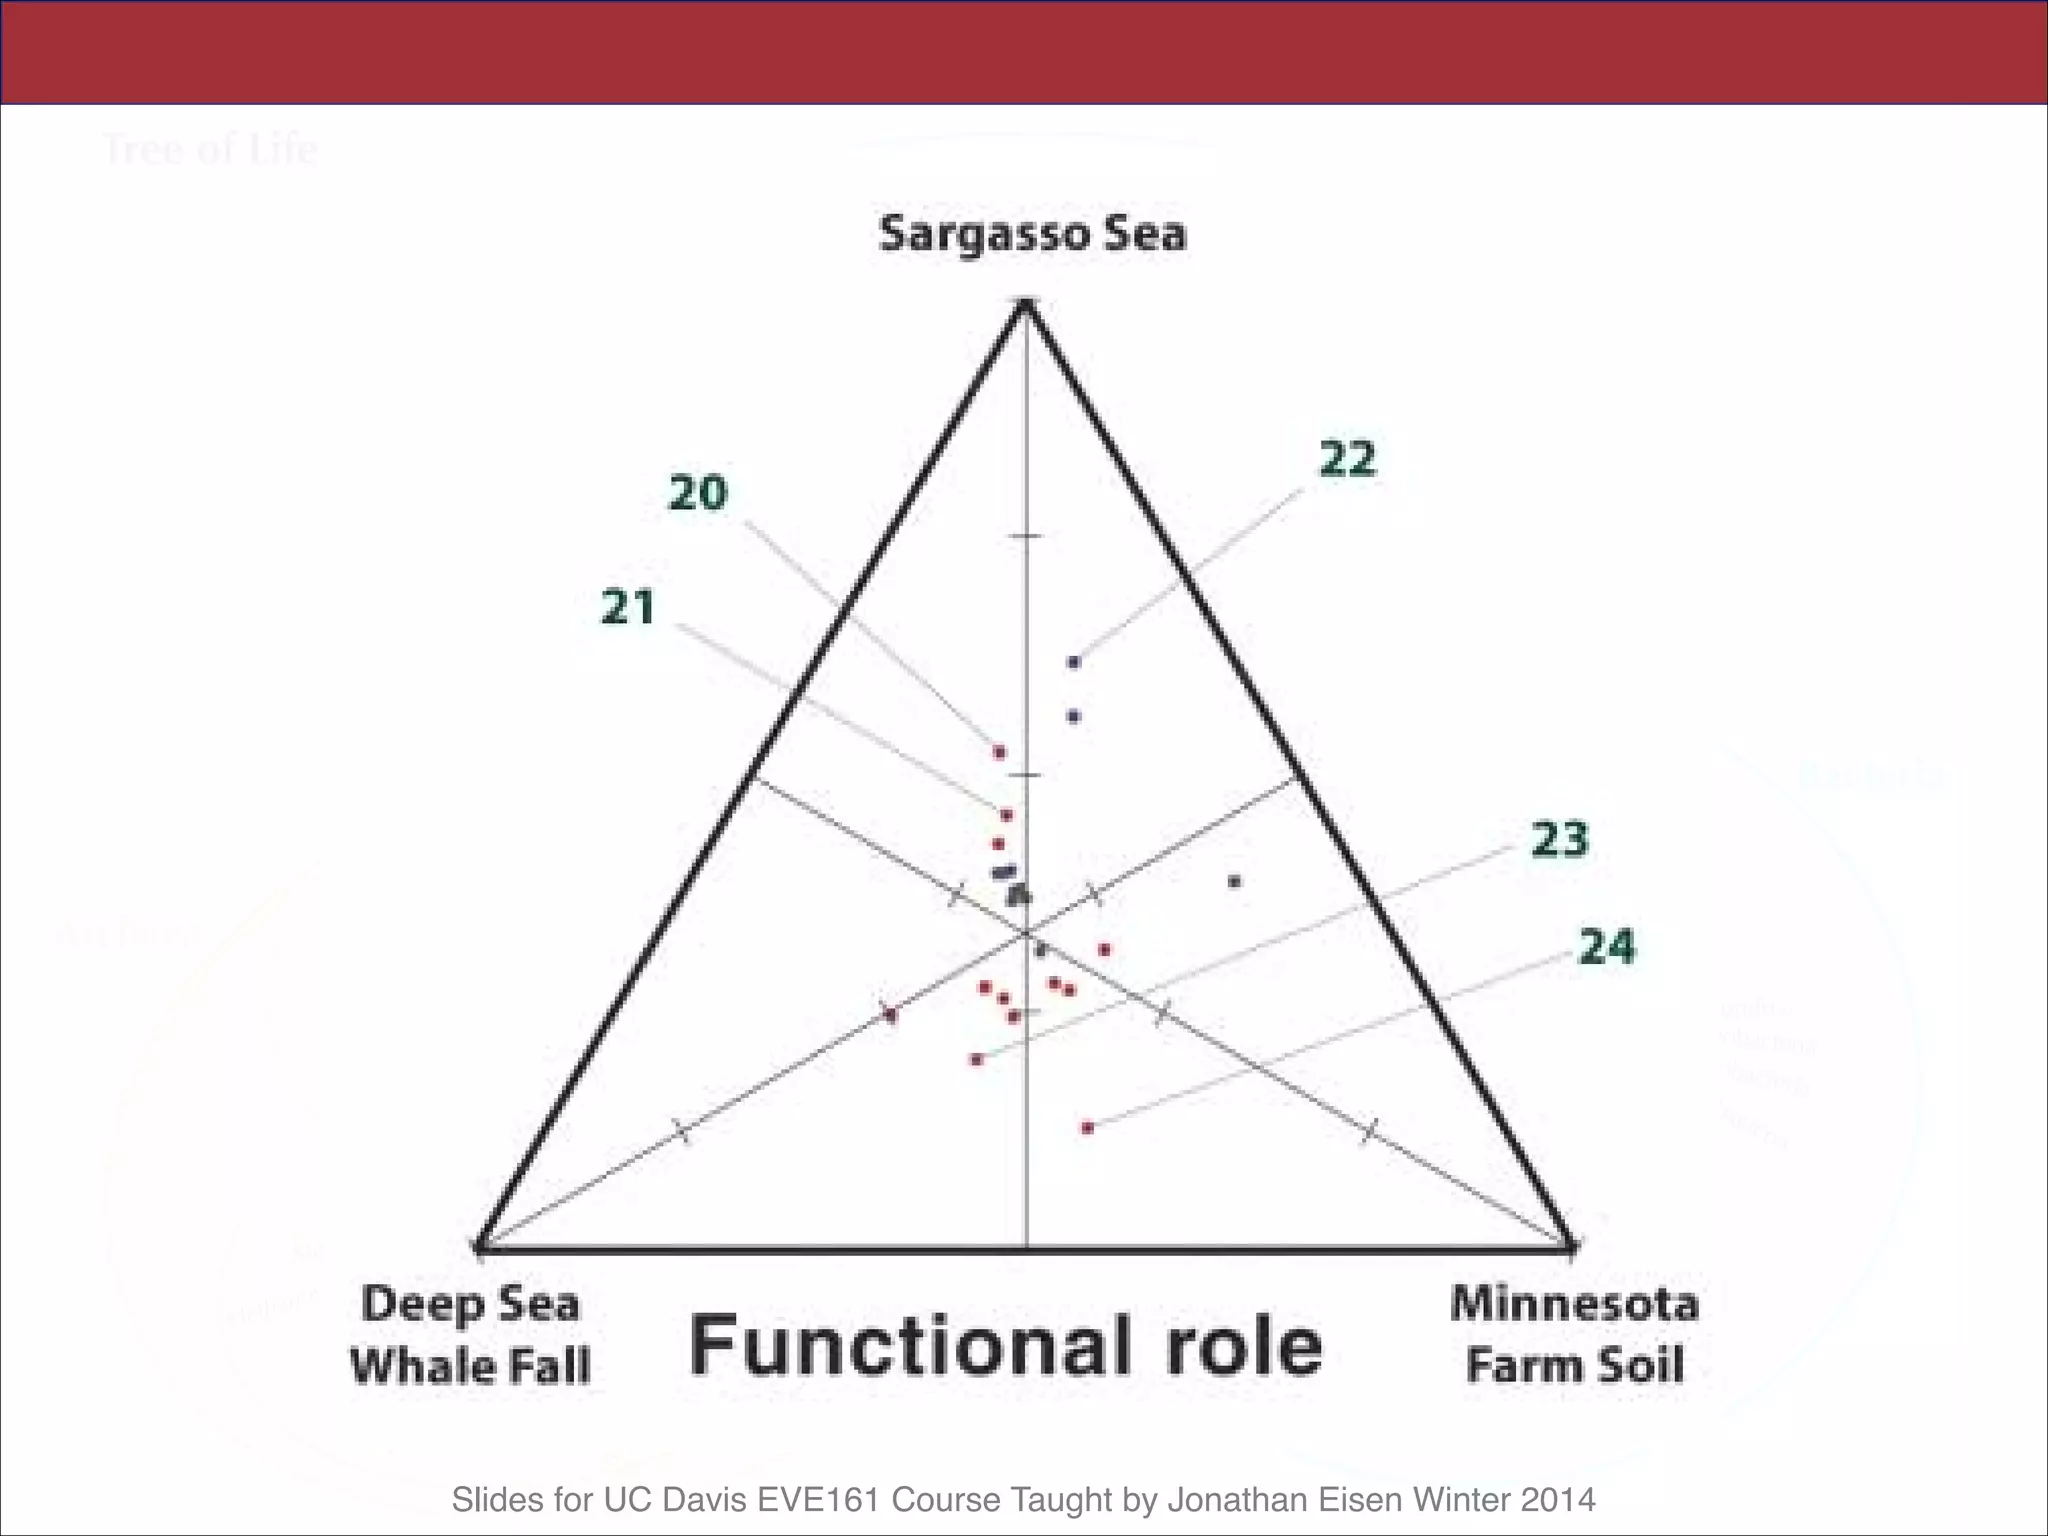
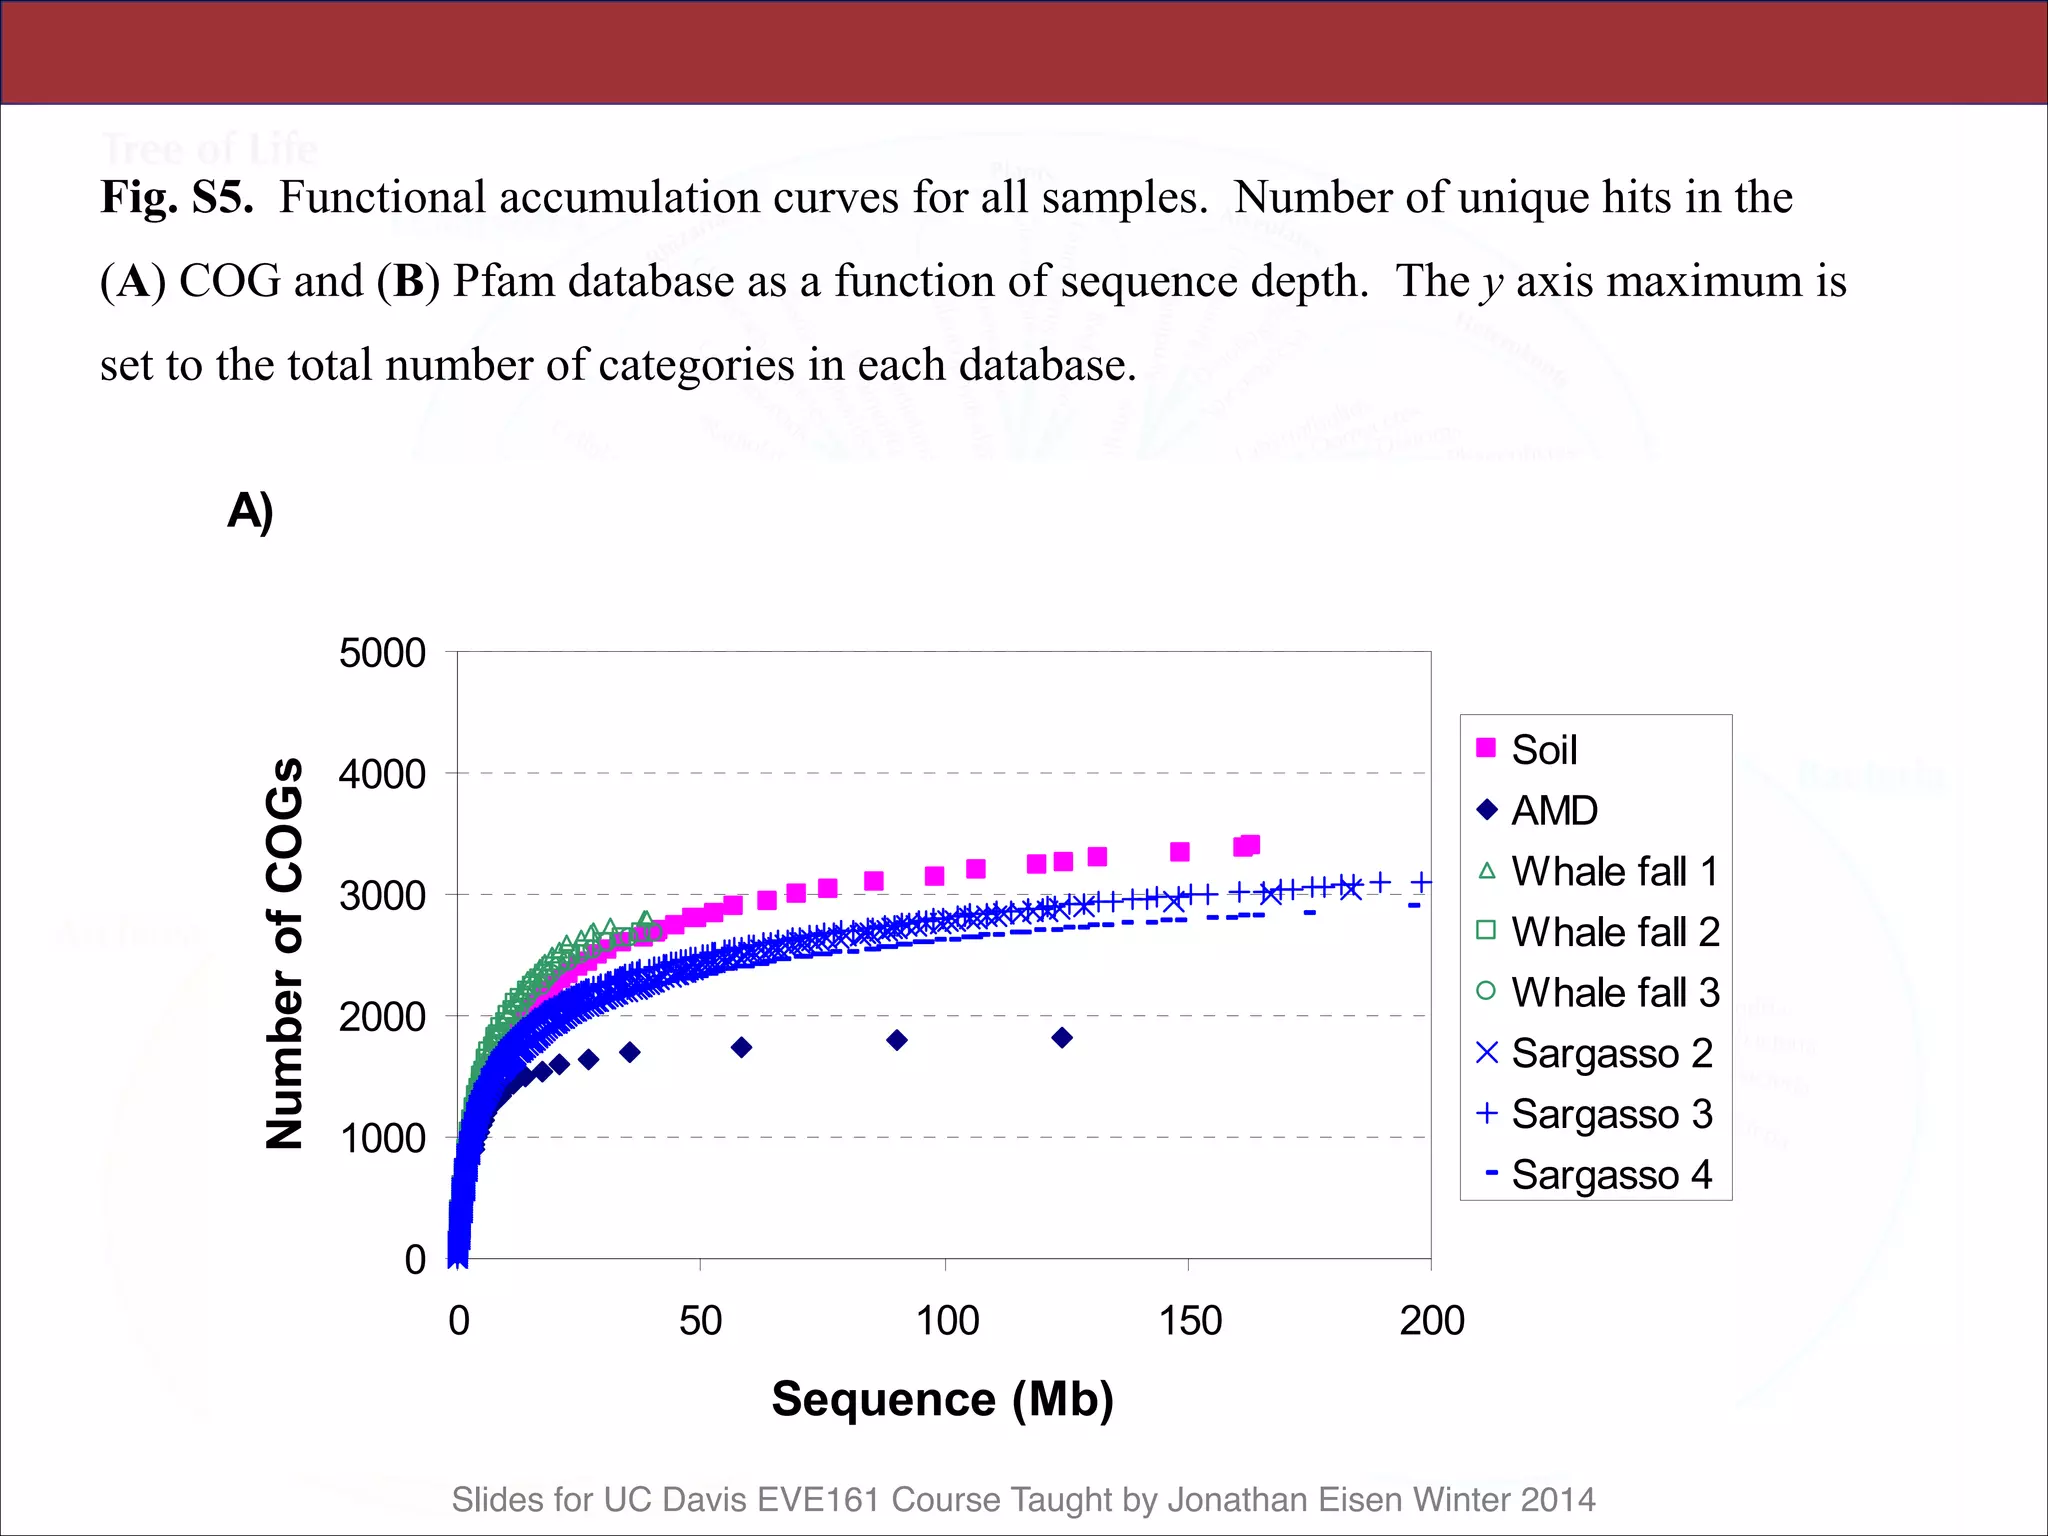
This document contains slides from a lecture on metagenomics given by Jonathan Eisen at UC Davis in winter 2014. The lecture discusses shotgun metagenomics and analyzing metagenomic functions and gene content from environmental samples without genome assemblies. It provides an example of a comparative metagenomics study of various microbial communities that identified habitat-specific genes and metabolic profiles reflecting the different environments. The slides include figures and references from a 2005 Science paper on this topic. Problem set 4 for the class involves selecting a relevant paper for presentation the following week.


![[2017.06.02] ASM17 Mads Albertsen](https://cdn.slidesharecdn.com/ss_thumbnails/2017-170602225519-thumbnail.jpg?width=640&height=640&fit=bounds)


![[2013.12.02] Mads Albertsen: Extracting Genomes from Metagenomes](https://cdn.slidesharecdn.com/ss_thumbnails/2013-131202013655-phpapp02-thumbnail.jpg?width=640&height=640&fit=bounds)


