Types of regression ii
•Download as PPTX, PDF•
3 likes•189 views

This is the comprehensive PPT on regression analysis. It covers the methods of identifying IV, DV, mediator, and moderators. How to interpreter using the parameters, R square, T-test. differentiation between linear and non-lienar regression

Recommended
More Related Content
Similar to Types of regression ii
Similar to Types of regression ii (20)
More from Dr Rajeev Kumar
More from Dr Rajeev Kumar (20)
Recently uploaded
Recently uploaded (20)
Types of regression ii
- 1. Regression Model: Types and interpretation of results Part-II Dr. Rajeev Kumar M.S.W.,(TISS, Mumbai), M.Phil., (CIP, Ranchi) UGC-JRF., Ph.D. (IIT Kharagpur) rajeev.iit.78@gmail.com 17-12-2020 ©DR. RAJEEV KUMAR 2020 1
- 2. So far as we discussed What is regression? Why we use ? And what is the utility of regression in our daily life? The relation of regression with correlation and how it is different? Understanding of bidirectional, unidirectional, and causation. Understanding of independent and dependent variables and their synonymous used in scientific literature. Small example of graphic-scatter plot and equation of regression The meaning of residuals in equation and its relevance in practical life Now we will move on further discussion 17-12-2020 ©DR. RAJEEV KUMAR 2020 2
- 3. Broad types of regression models Regression model Linear mode Non-linear 17-12-2020 ©DR. RAJEEV KUMAR 2020 3
- 4. Non-linear and linear regression 17-12-2020 ©DR. RAJEEV KUMAR 2020 4
- 5. Difference between linear and exponential curve The major distinction between linear and exponential functions is the rate of their growth. Its rate of change is much higher than that of a linear function. 17-12-2020 ©DR. RAJEEV KUMAR 2020 5
- 6. 17-12-2020 ©DR. RAJEEV KUMAR 2020 6
- 7. How mediator works? 17-12-2020 ©DR. RAJEEV KUMAR 2020 7
- 8. Example-1: Mediator variable 17-12-2020 ©DR. RAJEEV KUMAR 2020 8
- 9. How does moderator works? 17-12-2020 ©DR. RAJEEV KUMAR 2020 9
- 10. Example of moderator variable 17-12-2020 ©DR. RAJEEV KUMAR 2020 10
- 11. 17-12-2020 ©DR. RAJEEV KUMAR 2020 11
- 12. Classification of Linear and non-linear regression models 17-12-2020 ©DR. RAJEEV KUMAR 2020 12 Linear regression model (IV and DV both are continuous variable) Complex linear regression Simple Linear regression (1 IV and 1 DV) With mediator or Moderator variables Multiple regression model Multivariate regression model DV =1 IV =more than one DV= more than one IV= one or more than one Non-Linear Regression model (Either IV or DV is categorical variable Logistic regression DV or IV is categorical Binomial IV= more than one DV=1 Multinomial DV and IV= more than one
- 13. What are statistical models? A statistical model is a mathematical model that embodies a set of statistical assumptions concerning the generation of sample data (and similar data from a larger population). A statistical model represents, often in considerably idealized form, the data- generating process. A statistical model is usually specified as a mathematical relationship between one or more random variables and other non-random variables. As such, a statistical model is "a formal representation of a theory 17-12-2020 ©DR. RAJEEV KUMAR 2020 13
- 14. Example-1: Simple linear regression Liver related diseases were found associated with high consumption of alcohol. Y (liver related disease) = β0 ( Liver disease without using alcohol)+ β1 (alcohol use) + C (residual: other factors) XXxxxxxxxxxxxxxxxx X (IV) = Alcohol consumption 17-12-2020 ©DR. RAJEEV KUMAR 2020 14 Y (DV)= liver disease
- 15. . Example-2: Multiple Linear Regression In Kota several students preparing for IIT-JEE committed suicide. It was further observed that parental pressure, previous unsuccessful attempts, and mental stress were the major causes behind the suicides. Make conceptual diagramand equation Y= X0 β0 + X1 β1 + X2 β2+ X3 β3+ C X0 β0 = Number of suicide already occurred, when these three factors are not there 17-12-2020 ©DR. RAJEEV KUMAR 2020 15 Y=Suicide IV1=Parental pressure IV2=Unsuccessful attempt IV3=Mental stress Y (suicide)= Dependent variable X1 (parental pressure) = IV1 (independent variable) X2 (Unsuccessful attempt)= IV2 X3 (Mental stress) = IV3
- 16. Example-3: 1. Now identify DVs and IVs. 2. Present in equation and conceptual model. 17-12-2020 ©DR. RAJEEV KUMAR 2020 16
- 17. 17-12-2020 ©DR. RAJEEV KUMAR 2020 17 Example-3: Multivariate regression Equation and conceptual diagram or conceptual model DV1= Throat cancer (Y1) DV2= Lung cancer (Y2) DV3= Mouth cancer (Y3) IV= Cigarate smoking (X1) X0= When there is no Cigarate smoking C= Residuals (other factors of cancer) Y1+ Y2 +Y3 = X0β0+ X1 β1+C Y1(throat cancer)+ Y2 (lung cancer)+Y3 (Mouth cancer)= X0β0+ X1 β1 (Cigarate smoking)+C Throat cancer Lung cancer Mouth cancer Cigarate smoking
- 18. Example 4 : Complex Linear Regression with mediator Prolonged cancer causes deaths and death of family member poses financial burden on the family. (identify, dependent, independent and mediator variable) IV (Prolonged cancer), MeV (Mediator Variable: Death), DV (Financial Burden on family) H1: Y1 (Death) = X0β0+ X1 β1 (Prolonged cancer)+ C1 H2: Y2 (Financial Burden) = X0 β0+ X2 β2 (Death)+ C2 H3: Y3 (Financial Burden) =X0 β0+ X3 β3 (Prolonged cancer)+C3 Note (H1, H2, H3 are Hypotheses respectively) 17-12-2020 ©DR. RAJEEV KUMAR 2020 18 MeV= Death IV= Prolonged cancer DV= Financial burden on family Death FB Cancer
- 19. 17-12-2020 ©DR. RAJEEV KUMAR 2020 19 Example-5: Study hours, IQ level, quality of teaching, and educational facilities determine the grades of students. Further in their life, these grades determine job placement and salary packages. Identify various variables and draw conceptual diagram Grades Study Hours IQ Placement Educational facilities Teaching Quality Salary Package Professional network Place of stay
- 20. 17-12-2020 ©DR. RAJEEV KUMAR 2020 20 Example-5: Identifications of variables X1 (Study hours)= IV1 (IV= Independent variable) X2 (IQ)= IV2 Grades = MeV (Mediator variable) Placement= DV1 Salary package =DV2 (DV= Dependent variable) Educational facilities = MoV1 (MoV= Moderator variable) Professional Network = MoV2 Place of stay= MoV3 Teaching Quality = MoV4
- 21. 17-12-2020 ©DR. RAJEEV KUMAR 2020 21 Example-6:A complexconceptualdiagram KumarR.(2020)DowrySystem:UnequalizingGenderEquality.In:LealFilhoW.,AzulA., BrandliL., ÖzuyarP.,WallT.(eds)GenderEquality.EncyclopediaoftheUNSustainableDevelopmentGoals. Springer,Cham.https://doi.org/10.1007/978-3-319-70060-1_21-1
- 22. PART-III How to interpret the results of regression model? 17-12-2020 ©DR. RAJEEV KUMAR 2020 22
- 23. 17-12-2020 ©DR. RAJEEV KUMAR 2020 23 The values and indicators requires for interpretation of regression results Model fitness value Standardized β SE (Standard error of β T value P value R² IV→DV
- 24. ©DR. RAJEEV KUMAR 2020 2412/17/2020
- 25. ©DR. RAJEEV KUMAR 2020 2512/17/2020
- 26. 17-12-2020 ©DR. RAJEEV KUMAR 2020 26 Standardized Beta (β) Therefore, Unstandardized (β1) is the value of 1 unit increase or decrease in X (Independent variable) and subsequently expected to increase 1 unit in dependent variable (Y). We can calculate the standardized beta according to given formula Standardized beta also measure the effect size. (below .30= low effect size) ( between .30-.50= moderate effect size) and above .50 will be high effect size. It means higher the value of standardized beta gives the stronger result. Sx= Standard deviation of X (IV) Sy= Standard deviation of Y (DV) βz = Standardized beta βi = Unstandardized beta
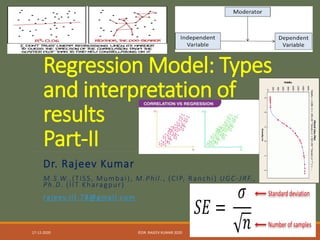
- 27. 17-12-2020 ©DR. RAJEEV KUMAR 2020 27 SE= Standardized Error of beta SE is also one of the measurement of dispersion. The formula of SE is given below. It means, lower the SD (standard deviation) less the SE. If sample size increase SE will also decrease. It means, there will be less error in data and less variability in the data. The less value of SE is considered good.
- 28. 17-12-2020 ©DR. RAJEEV KUMAR 2020 28 T test in regression analysis As we know T test measures the differences of two means. In regression analysis T test measures the difference between Beta (observed) – Beta (expected). Higher the T test, stronger the result of regression. We learnt that the Value of T is significant, if ≥ 1.96.
- 29. All about R² in Regression 17-12-2020 ©DR. RAJEEV KUMAR 2020 29
- 30. How does R² reflects in graph? 17-12-2020 ©DR. RAJEEV KUMAR 2020 30
- 31. What does R² tells? The value of R² tells how much independent variable explains the dependent variable. If the value of R² = .36, it means (.36x100= 36), the X is explains the Y only 36%, rest 64% are other factors. Suppose. Liver related diseases were found associated with high consumption of alcohol. Y (liver related disease) = β0 ( Liver disease without using alcohol)+ β1 (alcohol use) + C (residual: other factors) Suppose, here R²=.68 , it means (.68x100=68) alcohol consumption cause liver disease in 68% cases. Rest 32% ( 100-68=32) are other factors causing liver diseases.
- 32. R² : Fitness of Model R² indicates the fitness of overall model. How the variables and data are fitted into the proposed model. Higher the R² better fitness of the model. Low R² indicates the weakness of model. In given example R² is 0.06, it means, it explains the outcome variable only 6% 17-12-2020 ©DR. RAJEEV KUMAR 2020 32
- 33. Example-7: A relation between HIV/AIDS and percapita incomes of states Kumar, R., Suar, D., & Singh, S. K. (2017). Regional differences, socio- demographics, and hidden population of HIV/AIDS in India. AIDS care, 29(2), 204-208. Available at: https://www.tandfonline.com/doi/abs/10.1080/09540121.2016.121160 5 17-12-2020 ©DR. RAJEEV KUMAR 2020 33
- 34. 17-12-2020 ©DR. RAJEEV KUMAR 2020 34 Methodology and result of study A panel data regression was run using LIMDEP software to examine the relationship of new infection of HIV/AIDS for the period 2002– 2012 with per capita income of 32 Indian states and union territories of the same period. The data for the period 2002–2012 were obtained from the Reserve Bank of India (2012) and all the per capita income was with reference to the base year 2004. IV= Per-capita income of states DV= New rate of HIV infections in the states Hausman value for the model P value of the model Standardized Beta (β) SE (Standardized Error) of beta T value P value R² (χ2 (1) = 6.76 p < .009) −.369 .059 6.49 0.001 .93
- 35. 17-12-2020 ©DR. RAJEEV KUMAR 2020 35 Kumar,R., Suar, D., & Singh, S. K. (2017).Regional differences, socio-demographics, and hidden populationof HIV/AIDSin India.AIDScare, 29(2), 204-208. Availableat: https://www.tandfonline.com/doi/abs/10.1080/09540121.2016.1211605 IV (Per-capita income of states), DV(New rate of HIV infections in the states) Y (New rate of HIV infections)= X0β0+ X1 β1 (Per-capita income of states) + C The negative value of beta indicated that there is negative or reverse relation between percapita income and new rate of HIV infection. Means, if percapita income will increase, there will be reduction in new HIV cases. The value of standardized beta (-.369) is above .300, so it give the moderate effect size, there is moderate impact. R² indicates that percapita income predict new HIV infection 93%, rest 7% are other causes of HIV infections in group C states (Jharkhand, West Bengal, Odisha etc.,) Hausman value for the model P value of the model Standardized Beta (β) SE (Standardized Error) of beta T value P value R² (χ2 (1) = 6.76 p < .009) −.369 .059 6.49 0.001 .93
- 36. Kumar,R., Suar,D.,& Singh,S. K. (2017).Regional differences,socio- demographics, and hiddenpopulation of HIV/AIDSin India. AIDScare,29(2), 204-208. Availableat: https://www.tandfonline.com/doi/abs/10.1080/09540121.2016.1211605 The inverse relationship between per capita income and HIV/AIDS incidence reaffirms that AIDS is a disease of poverty (Guillies, Tolley, & Wolstenholme, 1996). The states and union territories of category A and B with higher per capita income spend more money on the prevention and treatment of HIV/AIDS compared to states of category C with lower per capita income (Ministry of Statistics and Programme Implementation, 2011). 17-12-2020 ©DR. RAJEEV KUMAR 2020 36
- 37. Summary of the session We learnt the difference between linear and non-linear regression. There was in-depth description on independent, dependent, mediator, and moderator variables. Those were explained using examples. The model fitness, T value, R square, standardized beta all were explained. At the last, we applied all the learning in understanding through a regression result published in an international journal. However, the logistic and other non-linear regressions were skipped for time being. With this session, Quantitative statistics is over. From the next session, we will learn Qualitative research methods. 17-12-2020 ©DR. RAJEEV KUMAR 2020 37
- 38. Thanks for showing your interest in learning 17-12-2020 ©DR. RAJEEV KUMAR 2020 38