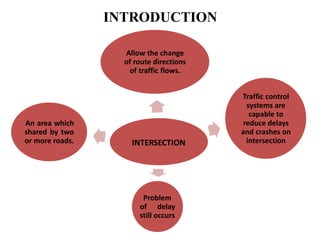
Under guidence of
Ms. Challa Prathyusha
PERFORMANCE EVALUATION OF
NAGAVARA JUNCTION USING SIDRA
INTERSECTION SOFTWARE
Submitted by,
Pavani N K (R17MTE21)
Ramyashree S (R17MTE25)
Contents
Introduction
Input
Output
Conclusion
Referance
INTRODUCTION
INTERSECTION
Allow the change
of route directions
of traffic flows.
Traffic control
systems are
capable to
reduce delays
and crashes on
intersection
Problem
of delay
still occurs
An area which
shared by two
or more roads.
SIDRA
• Estimate of capacity and performance characteristics
• Analyze and optimize the intersections
• Determine signal timing
• Carry out a design life analyze for traffic growth
Advantages of using sidra
• Use the parameter sensitivity
• Use a lane-by-lane analysis method
• Consistent with the US Highway capacity manual
• Provide a Excel application to support model
comparison
• Estimate operation cost , fuel consumption , co2 &
other emission
Study objective
•The main objective of the Study is to prepare low cost
solutions to an existing intersection
Study area
The intersection is located in Nagavara junction
North side :Hebbal road
South side : KR Puram
West side :Shivajinagar road
East side :Thanisandra road
CASE STUDY OF NAGVARA JUNCTION BY SIDRA
INTERSECTION
The intersection is located in Nagavara junction
• Nagavara junction is a four phase signalized intersection
which has meeting junctions of a Hebbal road on north side,
thanisandra road in the east , shivajinagar road on the south
side and Kr puram road towards south . For the performance
evaluation of nagavara intersection like the Level of service,
Degree of saturation, delay , queue length, gap acceptance
etc using SIDRA INTERSECTION software
Input Part of sidra intersection
Software
Layout of Nagavara junction
NAGAVARA JUNCTION
KR Puram road Hebbala side
NAGAVARA JUNCTION
Thannisandra roadShivajinagar road
Creating a new site and select an intersection
First, to create our site, we
select signals type
according to our case study
INTERSECTION
We use the Intersection input dialog to establish the basic
intersection configuration
To Insert or delete an
intersection leg we
should just click the leg
Title: Four way intersection/grop 7
Intersection
ID: NAGVARA
Signal analyze method: fixed-time/pretimed
These data apply to
intersection as a whole.
Peak Flow Period : 15 minutes
Unit Time for Volumes: 60 minutes
Geometry Input dialog
The Geometry input dialog is used to configure approach and
exit lanes, modify movements and insert other characters
Geometry Input dialog (Lane & movements
tab)
we should click a
desirable leg to select it
To select a desirable lane, we
should just click the lane
we should click a
desirable leg to select it
We can allocate
desirable movements by
clicking these buttons to
the selected lane
we should click a
desirable leg to select it
To specify a Median for the
selected leg, we should click the
Median check box and then
insert the width of Median
we should click a
desirable leg to select it
In this boxes we can
input lane type, short
lane, and lane length
Volume Input dialog
We input the collected
volume data for the selected
direction according to
separate LV & HV method
Figure of Volume Summary (volume summary node)
Path data dialog
We insert MOVEMENT PATH
DATA for the selected directionFor example for our site,
approach cruise speed is 70km/h
Negotiation Speed, Negotiation Distance, and
Downstream Distance will be calculated by the
program
Movement Data input dialog
The defaults of
program for Movement
data are Accepted
Priorities input dialog
Priorities dialog establishes Opposing movements
for the selected movement
Select movement to be
defined as opposed
movement
Click desirable movements
to define them as
opposing/not opposing
movements
Gap-acceptance data dialog
For GAP-ACCEPTANCE DATA
We give the default values to the
program
Phasing & Timing input dialog
In Phasing & Timing input dialog
We use command buttons to edit
We must click this box in
order to designate it as the
Current Sequence , Which
is analyzed by the program
Clone Sequence button is used
to create a new Sequence for
editing
The NAGAVARA Intersection is a Four Phase Intersection
Clone Phase button is used to
create a new Phase for
editing
For Vehicle Movement Timing Data
we accept the defaults
In Phase Data
dialog, we insert the
Phase Time for each
phase
Model Settings input dialog
The parameters of MODEL SETTING
affect the results significantly.
However, the defaults of parameters are
appropriate generally
Output Part OF SIDRAINTERSECTION
Software
Lane summary
Movement summary
Phasing Summary
Level of Service
A= Free flow B=Reasonably
free flow C=Stable flow
D=Approaching unstable flow
E=Unstable flow
F=Forced or breakdown flow
LOS Signalized
Intersection
Unsignalized
Intersection
A ≤10 sec ≤10 sec
B 10-20 sec 10-15 sec
C 20-35 sec 15-25 sec
D 35-55 sec 25-35 sec
E 55-80 sec 35-50 sec
F ≥80 sec ≥50 sec
Level of service
Degree of saturation
Queue length
CONCLUSION
• Performance evaluation of nagavara junction was performed
using sidra intersection -5 and the LOS of the intersection
was found to be F
• LOS-F means that there is high congestion in the junction and
there was low comfort and convenience to the commuters
travelling in this route
• So in order to increase the LOS and giving good traveling
experience to the road users we have to design the signal by
increasing the cycle time which can be done by
• Finding the optimum cycle length using websters method
• By user defined cycle time by trail and error method
• By user given phase time by trail and error method
comparing with the practical signal timing
REFERENCE
• Indian Road Congress “IRC -93:1985, “Guidelines on
design on installation of road traffic signals.” IRC New
Delhi.
• Indian Road Congress “I.R.C:106-1990, Guidelines For
Capacity Of Urban Roads In Plain”
• Indian Road Congress “I.R.C:9-1972, “Traffic Census”
• Sidra intersection input guide
THANK YOU

Sidra intersection

  • 1.
    Under guidence of Ms.Challa Prathyusha PERFORMANCE EVALUATION OF NAGAVARA JUNCTION USING SIDRA INTERSECTION SOFTWARE Submitted by, Pavani N K (R17MTE21) Ramyashree S (R17MTE25)
  • 2.
  • 3.
    INTRODUCTION INTERSECTION Allow the change ofroute directions of traffic flows. Traffic control systems are capable to reduce delays and crashes on intersection Problem of delay still occurs An area which shared by two or more roads.
  • 5.
    SIDRA • Estimate ofcapacity and performance characteristics • Analyze and optimize the intersections • Determine signal timing • Carry out a design life analyze for traffic growth
  • 6.
    Advantages of usingsidra • Use the parameter sensitivity • Use a lane-by-lane analysis method • Consistent with the US Highway capacity manual • Provide a Excel application to support model comparison • Estimate operation cost , fuel consumption , co2 & other emission
  • 7.
    Study objective •The mainobjective of the Study is to prepare low cost solutions to an existing intersection
  • 8.
    Study area The intersectionis located in Nagavara junction North side :Hebbal road South side : KR Puram West side :Shivajinagar road East side :Thanisandra road
  • 9.
    CASE STUDY OFNAGVARA JUNCTION BY SIDRA INTERSECTION The intersection is located in Nagavara junction • Nagavara junction is a four phase signalized intersection which has meeting junctions of a Hebbal road on north side, thanisandra road in the east , shivajinagar road on the south side and Kr puram road towards south . For the performance evaluation of nagavara intersection like the Level of service, Degree of saturation, delay , queue length, gap acceptance etc using SIDRA INTERSECTION software
  • 10.
    Input Part ofsidra intersection Software
  • 11.
  • 12.
    NAGAVARA JUNCTION KR Puramroad Hebbala side
  • 13.
  • 14.
    Creating a newsite and select an intersection First, to create our site, we select signals type according to our case study
  • 15.
    INTERSECTION We use theIntersection input dialog to establish the basic intersection configuration
  • 16.
    To Insert ordelete an intersection leg we should just click the leg
  • 17.
    Title: Four wayintersection/grop 7
  • 18.
  • 19.
    Signal analyze method:fixed-time/pretimed
  • 20.
    These data applyto intersection as a whole. Peak Flow Period : 15 minutes Unit Time for Volumes: 60 minutes
  • 21.
    Geometry Input dialog TheGeometry input dialog is used to configure approach and exit lanes, modify movements and insert other characters
  • 22.
    Geometry Input dialog(Lane & movements tab) we should click a desirable leg to select it To select a desirable lane, we should just click the lane
  • 23.
    we should clicka desirable leg to select it We can allocate desirable movements by clicking these buttons to the selected lane
  • 24.
    we should clicka desirable leg to select it To specify a Median for the selected leg, we should click the Median check box and then insert the width of Median
  • 25.
    we should clicka desirable leg to select it In this boxes we can input lane type, short lane, and lane length
  • 26.
    Volume Input dialog Weinput the collected volume data for the selected direction according to separate LV & HV method
  • 27.
    Figure of VolumeSummary (volume summary node)
  • 28.
    Path data dialog Weinsert MOVEMENT PATH DATA for the selected directionFor example for our site, approach cruise speed is 70km/h Negotiation Speed, Negotiation Distance, and Downstream Distance will be calculated by the program
  • 29.
    Movement Data inputdialog The defaults of program for Movement data are Accepted
  • 30.
    Priorities input dialog Prioritiesdialog establishes Opposing movements for the selected movement Select movement to be defined as opposed movement Click desirable movements to define them as opposing/not opposing movements
  • 31.
    Gap-acceptance data dialog ForGAP-ACCEPTANCE DATA We give the default values to the program
  • 32.
    Phasing & Timinginput dialog In Phasing & Timing input dialog We use command buttons to edit We must click this box in order to designate it as the Current Sequence , Which is analyzed by the program
  • 33.
    Clone Sequence buttonis used to create a new Sequence for editing
  • 34.
    The NAGAVARA Intersectionis a Four Phase Intersection Clone Phase button is used to create a new Phase for editing
  • 35.
    For Vehicle MovementTiming Data we accept the defaults
  • 36.
    In Phase Data dialog,we insert the Phase Time for each phase
  • 37.
    Model Settings inputdialog The parameters of MODEL SETTING affect the results significantly. However, the defaults of parameters are appropriate generally
  • 38.
    Output Part OFSIDRAINTERSECTION Software
  • 41.
  • 42.
  • 43.
  • 44.
    Level of Service A=Free flow B=Reasonably free flow C=Stable flow D=Approaching unstable flow E=Unstable flow F=Forced or breakdown flow LOS Signalized Intersection Unsignalized Intersection A ≤10 sec ≤10 sec B 10-20 sec 10-15 sec C 20-35 sec 15-25 sec D 35-55 sec 25-35 sec E 55-80 sec 35-50 sec F ≥80 sec ≥50 sec
  • 45.
  • 46.
  • 48.
  • 49.
    CONCLUSION • Performance evaluationof nagavara junction was performed using sidra intersection -5 and the LOS of the intersection was found to be F • LOS-F means that there is high congestion in the junction and there was low comfort and convenience to the commuters travelling in this route
  • 50.
    • So inorder to increase the LOS and giving good traveling experience to the road users we have to design the signal by increasing the cycle time which can be done by • Finding the optimum cycle length using websters method • By user defined cycle time by trail and error method • By user given phase time by trail and error method comparing with the practical signal timing
  • 51.
    REFERENCE • Indian RoadCongress “IRC -93:1985, “Guidelines on design on installation of road traffic signals.” IRC New Delhi. • Indian Road Congress “I.R.C:106-1990, Guidelines For Capacity Of Urban Roads In Plain” • Indian Road Congress “I.R.C:9-1972, “Traffic Census” • Sidra intersection input guide
  • 52.