The document is a quarterly balanced scorecard report for The Scarborough Hospital that provides performance metrics in key areas like patient safety, staff satisfaction, wait times, and clinical indicators. It includes 49 metrics across several categories including quality improvement plan priorities, patient safety indicators, and accountability agreement indicators. The metrics show current performance, previous values, targets, and risk ratings. The report aims to track progress on strategic goals related to patient experience, staff engagement, clinical effectiveness and organizational performance.
The tertiary care hospital utilization of the balanced scorecard Nancy Southerland
The tertiary care hospital has as its primary responsibility to deliver health care to the most sick and severely ill. The management of the critically ill is seen as a wrathful driver of costs within the confines of the tertiary care hospital both in the United States and abroad. Through utilization of the Balanced Scorecard not only are the needed financial metrics elevated but the added dimensions of customer (both internal and external), internal business processes, and learning and growth dimensions are part of the balanced scorecard perspectives. Through use of the balanced scorecard in the tertiary care hospital, the wrath of the cost driver of the therapeutic management and intervention of the critically ill is assuaged. Tertiary care hospitals are able to deliver solid operating margins while ensuring patient satisfaction with good clinical outcome of the critically ill while experiencing much employee engagement. The tertiary care hospital enjoys the interconnectedness of the dimensions realizing quickly that over time all the Balance Scorecard perspectives are financial dimensions.
- Functions of score card
- How to implement score card
- How score card conduct
- Examples of how score cards are used in finance, government & hospital
Healthcare Dashboards: 3 Keys for Creating Effective and Insightful Executive...Health Catalyst
As the use of data-driven Key Performance Indicators (KPIs) increases, healthcare organizations are adopting Executive Dashboards to track organizational performance. While dashboards deliver insight and identify areas for improvement, they fail to make the data actionable and the value is often offset by the unproductive fire drills and churn they create. There are three keys to create and deploy insightful and effective dashboards successfully:
1. Aggregation of underlying dashboards to create the executive dashboard
2. Establishment of clear ownership and accountability
3. Sustainable process
Micro Technologies (India) Ltd. is an IT based company, a leading global developer, manufacturer and marketer of security devices for its clients across the globe. Product lines include the much-needed security devices, life style and support systems and web-based software. Micro Technologies has a history of leading-edge security solutions products. This tradition continues through a singular focus on innovation, advanced technology and making the life of its clients safe, secure and manageable in terms of security, time and money one of the most important defining characteristics of a security and life support solution based company in the early 21st century. It is one of the most valued security solutions across the globe and has been accorded with many national and international awards for its growth and R & D. Micro Technologies aims at displaying not just the technological innovation and prowess but also the product diversity in various segments of vehicle, premises, mobile, other assets and now entering Energy & Health Segments.
GSA Schedule: The Who What Where When How and Why of Getting a GSA contact.
Contains excerpts from TurboGSA's free monthly webinar: http://www.turbogsa.com/how-to-obtain-a-gsa-schedules-contract/
West Immunotherapy, Vaccines for Lung Cancer Mage-A3, Stimuvax, and LucanixH. Jack West
Update of results and current clinical trials of vaccines for lung cancer, including MAGE-A3, Stimuvax, and Lucanix for stage I-III non-small cell lung cancer. @JackWestMD, @CancerGRACE cancerGRACE.org
NewcastleGateshead Initiative's first partner update meeting of 2015 was held at The Biscuit Rooms on Thursday 26 February. Our partners heard about our plans for the year and guest speaker Graeme Mason from Newcastle International Airport, told us about the new Newcastle to New York United Airlines route.
Confiance has been involved in the development of several bankable feasibility studies for both existing and soon-to-be miners. Most of you will know that a Bankable Feasibility Study (BFS) is a comprehensive forward analysis of a project’s economics (+/- 15%) to be used by financial institutions to assess the credit worthiness for project financing.
How to improve medical records completion: Locarno HospitalGiovanni Rabito
The goal of the project has been to improve the quality of
patient records completion in terms of completeness, legibility
of clinical and care activities also recording of inpatients and
emergency room patients medical records.
The purpose of NGO Benchmarking is to provide NGOs, as well as the donor community and the public at large, with an independent assessment based on a comprehensive set of perspectives, namely:
Dimensions of Best Practices:
Board of Trustees, Strategic Framework, Integrity Management, Communication and Public Image, Human Resources, Fund-Raising - Resources Allocation and Financial Controls, Outcomes, Operations and Continuous Improvement.
Contributors' Expectations:
Transparency, Efficiency, Effectiveness
Management Components:
System, Activities (Programmes/Projects), Human Resources, Finance
Continuous Improvement:
Plan, Do, Check, Act.
This presentation outlines lessons from evaluating envrionmental and social effects of development projects implemented by the International Finance Corporation.
In this Aberdeen Group research brief, data shows that top –performing companies are achieving exceptional results due in part to their ability to use assessment data to make better talent decisions on an individual and organizational level. “To build a high-performance culture, organizations must not only utilize assessments, but make them a part of how managers think about their talent. The clients of one assessments solution provider in particular, PI Worldwide, are an example of how to bring together assessment tools with the right organizational capabilities required to create a positive business impact.” Contact me to receive a copy of the brief: agrimes@advisausa.com
Session delivered as part of The Conference Board Diversity and Inclusion New Leaders Academy aimed to train new practitioners in the D&I field about relevant metrics. Four types of metrics are covered: profitability (impact of diversity in performance), workforce representation (cascading gender goals), inclusion and flexibility.
So maximieren Sie den Nutzen von SAP: Business Netzwerke als Schlüssel zum Er...SAP Ariba
Das Erfassen aller Ausgaben über Warengruppen, Lieferanten und Ländergrenzen ist
eine große Herausforderung für die meisten eProcurement Systeme. Die Nutzung
eines solchen Systems hängt von vielen Erfolgsfaktoren ab, wie z.b. dem Enablement
der Lieferanten, dem Bereitstellen von Katalogen und schlussendlich der operativen
Nutzung durch die User. Clariant wird Ihnen in diesem spannenden Vortrag erläutern,
wie der führende Hersteller von Spezialchemie das Ariba Netzwerk zusammen mit SAP
nutzt, um Synergieeffekte im Einkauf zu nutzen und Prozesse länderübergreifend zu
standardisieren.
Peter Beyeler, Global eProcurement & Automation Manager – Clariant
2013 Ariba Commerce Summit Frankfurt
Have physician practices started planning for the ICD-10 transition? Has any communication taken place between practices and their payors or vendors? Gain industry insight into how medical practices nationwide are approaching the ICD-10 transition. Over 900 medical professionals surveyed.
For additional resources and information please visit: http://sites.mckesson.com/practiceconsulting/kc_coding.htm
Business in the Community Ireland CEO Survey October 2012Amarach Research
A survey of 100 Irish CEOs/Managing Directors from Ireland's top 1,000 companies.
More details - and a handy infographic - available at the Business in the Community Ireland website:
http://www.bitc.ie/2012/10/ceo-survey-shows-responsible-business-practice-positive-impact-botton-line/
Annual update presented to members of the Investment Office by the officers of the club. I created this presentation in collaboration with my fellow officer and other club members.
As part of The Scarborough Hospital's commitment to transparency of operations to our community, patients and their families, we are pleased to present our 2011-12 Health Service Accountability Agreement.
Title: Sense of Taste
Presenter: Dr. Faiza, Assistant Professor of Physiology
Qualifications:
MBBS (Best Graduate, AIMC Lahore)
FCPS Physiology
ICMT, CHPE, DHPE (STMU)
MPH (GC University, Faisalabad)
MBA (Virtual University of Pakistan)
Learning Objectives:
Describe the structure and function of taste buds.
Describe the relationship between the taste threshold and taste index of common substances.
Explain the chemical basis and signal transduction of taste perception for each type of primary taste sensation.
Recognize different abnormalities of taste perception and their causes.
Key Topics:
Significance of Taste Sensation:
Differentiation between pleasant and harmful food
Influence on behavior
Selection of food based on metabolic needs
Receptors of Taste:
Taste buds on the tongue
Influence of sense of smell, texture of food, and pain stimulation (e.g., by pepper)
Primary and Secondary Taste Sensations:
Primary taste sensations: Sweet, Sour, Salty, Bitter, Umami
Chemical basis and signal transduction mechanisms for each taste
Taste Threshold and Index:
Taste threshold values for Sweet (sucrose), Salty (NaCl), Sour (HCl), and Bitter (Quinine)
Taste index relationship: Inversely proportional to taste threshold
Taste Blindness:
Inability to taste certain substances, particularly thiourea compounds
Example: Phenylthiocarbamide
Structure and Function of Taste Buds:
Composition: Epithelial cells, Sustentacular/Supporting cells, Taste cells, Basal cells
Features: Taste pores, Taste hairs/microvilli, and Taste nerve fibers
Location of Taste Buds:
Found in papillae of the tongue (Fungiform, Circumvallate, Foliate)
Also present on the palate, tonsillar pillars, epiglottis, and proximal esophagus
Mechanism of Taste Stimulation:
Interaction of taste substances with receptors on microvilli
Signal transduction pathways for Umami, Sweet, Bitter, Sour, and Salty tastes
Taste Sensitivity and Adaptation:
Decrease in sensitivity with age
Rapid adaptation of taste sensation
Role of Saliva in Taste:
Dissolution of tastants to reach receptors
Washing away the stimulus
Taste Preferences and Aversions:
Mechanisms behind taste preference and aversion
Influence of receptors and neural pathways
Impact of Sensory Nerve Damage:
Degeneration of taste buds if the sensory nerve fiber is cut
Abnormalities of Taste Detection:
Conditions: Ageusia, Hypogeusia, Dysgeusia (parageusia)
Causes: Nerve damage, neurological disorders, infections, poor oral hygiene, adverse drug effects, deficiencies, aging, tobacco use, altered neurotransmitter levels
Neurotransmitters and Taste Threshold:
Effects of serotonin (5-HT) and norepinephrine (NE) on taste sensitivity
Supertasters:
25% of the population with heightened sensitivity to taste, especially bitterness
Increased number of fungiform papillae
Couples presenting to the infertility clinic- Do they really have infertility...Sujoy Dasgupta
Dr Sujoy Dasgupta presented the study on "Couples presenting to the infertility clinic- Do they really have infertility? – The unexplored stories of non-consummation" in the 13th Congress of the Asia Pacific Initiative on Reproduction (ASPIRE 2024) at Manila on 24 May, 2024.
HOT NEW PRODUCT! BIG SALES FAST SHIPPING NOW FROM CHINA!! EU KU DB BK substit...GL Anaacs
Contact us if you are interested:
Email / Skype : kefaya1771@gmail.com
Threema: PXHY5PDH
New BATCH Ku !!! MUCH IN DEMAND FAST SALE EVERY BATCH HAPPY GOOD EFFECT BIG BATCH !
Contact me on Threema or skype to start big business!!
Hot-sale products:
NEW HOT EUTYLONE WHITE CRYSTAL!!
5cl-adba precursor (semi finished )
5cl-adba raw materials
ADBB precursor (semi finished )
ADBB raw materials
APVP powder
5fadb/4f-adb
Jwh018 / Jwh210
Eutylone crystal
Protonitazene (hydrochloride) CAS: 119276-01-6
Flubrotizolam CAS: 57801-95-3
Metonitazene CAS: 14680-51-4
Payment terms: Western Union,MoneyGram,Bitcoin or USDT.
Deliver Time: Usually 7-15days
Shipping method: FedEx, TNT, DHL,UPS etc.Our deliveries are 100% safe, fast, reliable and discreet.
Samples will be sent for your evaluation!If you are interested in, please contact me, let's talk details.
We specializes in exporting high quality Research chemical, medical intermediate, Pharmaceutical chemicals and so on. Products are exported to USA, Canada, France, Korea, Japan,Russia, Southeast Asia and other countries.
Report Back from SGO 2024: What’s the Latest in Cervical Cancer?bkling
Are you curious about what’s new in cervical cancer research or unsure what the findings mean? Join Dr. Emily Ko, a gynecologic oncologist at Penn Medicine, to learn about the latest updates from the Society of Gynecologic Oncology (SGO) 2024 Annual Meeting on Women’s Cancer. Dr. Ko will discuss what the research presented at the conference means for you and answer your questions about the new developments.
TEST BANK for Operations Management, 14th Edition by William J. Stevenson, Ve...kevinkariuki227
TEST BANK for Operations Management, 14th Edition by William J. Stevenson, Verified Chapters 1 - 19, Complete Newest Version.pdf
TEST BANK for Operations Management, 14th Edition by William J. Stevenson, Verified Chapters 1 - 19, Complete Newest Version.pdf
Prix Galien International 2024 Forum ProgramLevi Shapiro
June 20, 2024, Prix Galien International and Jerusalem Ethics Forum in ROME. Detailed agenda including panels:
- ADVANCES IN CARDIOLOGY: A NEW PARADIGM IS COMING
- WOMEN’S HEALTH: FERTILITY PRESERVATION
- WHAT’S NEW IN THE TREATMENT OF INFECTIOUS,
ONCOLOGICAL AND INFLAMMATORY SKIN DISEASES?
- ARTIFICIAL INTELLIGENCE AND ETHICS
- GENE THERAPY
- BEYOND BORDERS: GLOBAL INITIATIVES FOR DEMOCRATIZING LIFE SCIENCE TECHNOLOGIES AND PROMOTING ACCESS TO HEALTHCARE
- ETHICAL CHALLENGES IN LIFE SCIENCES
- Prix Galien International Awards Ceremony
Lung Cancer: Artificial Intelligence, Synergetics, Complex System Analysis, S...Oleg Kshivets
RESULTS: Overall life span (LS) was 2252.1±1742.5 days and cumulative 5-year survival (5YS) reached 73.2%, 10 years – 64.8%, 20 years – 42.5%. 513 LCP lived more than 5 years (LS=3124.6±1525.6 days), 148 LCP – more than 10 years (LS=5054.4±1504.1 days).199 LCP died because of LC (LS=562.7±374.5 days). 5YS of LCP after bi/lobectomies was significantly superior in comparison with LCP after pneumonectomies (78.1% vs.63.7%, P=0.00001 by log-rank test). AT significantly improved 5YS (66.3% vs. 34.8%) (P=0.00000 by log-rank test) only for LCP with N1-2. Cox modeling displayed that 5YS of LCP significantly depended on: phase transition (PT) early-invasive LC in terms of synergetics, PT N0—N12, cell ratio factors (ratio between cancer cells- CC and blood cells subpopulations), G1-3, histology, glucose, AT, blood cell circuit, prothrombin index, heparin tolerance, recalcification time (P=0.000-0.038). Neural networks, genetic algorithm selection and bootstrap simulation revealed relationships between 5YS and PT early-invasive LC (rank=1), PT N0—N12 (rank=2), thrombocytes/CC (3), erythrocytes/CC (4), eosinophils/CC (5), healthy cells/CC (6), lymphocytes/CC (7), segmented neutrophils/CC (8), stick neutrophils/CC (9), monocytes/CC (10); leucocytes/CC (11). Correct prediction of 5YS was 100% by neural networks computing (area under ROC curve=1.0; error=0.0).
CONCLUSIONS: 5YS of LCP after radical procedures significantly depended on: 1) PT early-invasive cancer; 2) PT N0--N12; 3) cell ratio factors; 4) blood cell circuit; 5) biochemical factors; 6) hemostasis system; 7) AT; 8) LC characteristics; 9) LC cell dynamics; 10) surgery type: lobectomy/pneumonectomy; 11) anthropometric data. Optimal diagnosis and treatment strategies for LC are: 1) screening and early detection of LC; 2) availability of experienced thoracic surgeons because of complexity of radical procedures; 3) aggressive en block surgery and adequate lymph node dissection for completeness; 4) precise prediction; 5) adjuvant chemoimmunoradiotherapy for LCP with unfavorable prognosis.
Ethanol (CH3CH2OH), or beverage alcohol, is a two-carbon alcohol
that is rapidly distributed in the body and brain. Ethanol alters many
neurochemical systems and has rewarding and addictive properties. It
is the oldest recreational drug and likely contributes to more morbidity,
mortality, and public health costs than all illicit drugs combined. The
5th edition of the Diagnostic and Statistical Manual of Mental Disorders
(DSM-5) integrates alcohol abuse and alcohol dependence into a single
disorder called alcohol use disorder (AUD), with mild, moderate,
and severe subclassifications (American Psychiatric Association, 2013).
In the DSM-5, all types of substance abuse and dependence have been
combined into a single substance use disorder (SUD) on a continuum
from mild to severe. A diagnosis of AUD requires that at least two of
the 11 DSM-5 behaviors be present within a 12-month period (mild
AUD: 2–3 criteria; moderate AUD: 4–5 criteria; severe AUD: 6–11 criteria).
The four main behavioral effects of AUD are impaired control over
drinking, negative social consequences, risky use, and altered physiological
effects (tolerance, withdrawal). This chapter presents an overview
of the prevalence and harmful consequences of AUD in the U.S.,
the systemic nature of the disease, neurocircuitry and stages of AUD,
comorbidities, fetal alcohol spectrum disorders, genetic risk factors, and
pharmacotherapies for AUD.
Flu Vaccine Alert in Bangalore Karnatakaaddon Scans
As flu season approaches, health officials in Bangalore, Karnataka, are urging residents to get their flu vaccinations. The seasonal flu, while common, can lead to severe health complications, particularly for vulnerable populations such as young children, the elderly, and those with underlying health conditions.
Dr. Vidisha Kumari, a leading epidemiologist in Bangalore, emphasizes the importance of getting vaccinated. "The flu vaccine is our best defense against the influenza virus. It not only protects individuals but also helps prevent the spread of the virus in our communities," he says.
This year, the flu season is expected to coincide with a potential increase in other respiratory illnesses. The Karnataka Health Department has launched an awareness campaign highlighting the significance of flu vaccinations. They have set up multiple vaccination centers across Bangalore, making it convenient for residents to receive their shots.
To encourage widespread vaccination, the government is also collaborating with local schools, workplaces, and community centers to facilitate vaccination drives. Special attention is being given to ensuring that the vaccine is accessible to all, including marginalized communities who may have limited access to healthcare.
Residents are reminded that the flu vaccine is safe and effective. Common side effects are mild and may include soreness at the injection site, mild fever, or muscle aches. These side effects are generally short-lived and far less severe than the flu itself.
Healthcare providers are also stressing the importance of continuing COVID-19 precautions. Wearing masks, practicing good hand hygiene, and maintaining social distancing are still crucial, especially in crowded places.
Protect yourself and your loved ones by getting vaccinated. Together, we can help keep Bangalore healthy and safe this flu season. For more information on vaccination centers and schedules, residents can visit the Karnataka Health Department’s official website or follow their social media pages.
Stay informed, stay safe, and get your flu shot today!
These simplified slides by Dr. Sidra Arshad present an overview of the non-respiratory functions of the respiratory tract.
Learning objectives:
1. Enlist the non-respiratory functions of the respiratory tract
2. Briefly explain how these functions are carried out
3. Discuss the significance of dead space
4. Differentiate between minute ventilation and alveolar ventilation
5. Describe the cough and sneeze reflexes
Study Resources:
1. Chapter 39, Guyton and Hall Textbook of Medical Physiology, 14th edition
2. Chapter 34, Ganong’s Review of Medical Physiology, 26th edition
3. Chapter 17, Human Physiology by Lauralee Sherwood, 9th edition
4. Non-respiratory functions of the lungs https://academic.oup.com/bjaed/article/13/3/98/278874
ARTIFICIAL INTELLIGENCE IN HEALTHCARE.pdfAnujkumaranit
Artificial intelligence (AI) refers to the simulation of human intelligence processes by machines, especially computer systems. It encompasses tasks such as learning, reasoning, problem-solving, perception, and language understanding. AI technologies are revolutionizing various fields, from healthcare to finance, by enabling machines to perform tasks that typically require human intelligence.
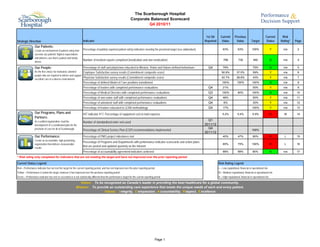
1. The Scarborough Hospital
Corporate Balanced Scorecard
Q4 2010/11
1st Qtr Current Previous Current Risk
Strategic Direction Indicator Reported Value Value Target Status Rating* Page
Our Patients:
Create an environment of patient safety that Percentage of publicly reported patient safety indicators meeting the provincial target (see addendum) 63% 63% 100% Y n/a 2
exceeds our patients' highest expectations
and delivers care that is patient and family
Number of incident reports completed (medication and non-medication) 768 730 490 G n/a 4
driven.
Our People: Percentage of staff and physicians educated in Mission, Vision and Values defined behaviours Q4 79% 75% G n/a 5
Be the first choice for motivated, talented Employee Satisfaction survey results (Commitment composite score) 50.9% 37.5% 59% Y n/a 6
people who are inspired to deliver and support
excellent care in a diverse environment.
Physician Satisfaction survey results (Commitment composite score) 42.7% 28.8% 43% Y n/a 7
Percentage of defined Model of Care positions transitioned 100% 100% 100% G n/a 8
Percentage of leaders with completed performance evaluations Q4 21% 50% Y n/a 9
Percentage of Medical Directors with completed performance evaluations Q3 100% 80% 100% G n/a 10
Percentage of non-union staff with completed performance evaluations Q4 46% 50% Y n/a 11
Percentage of unionized staff with completed performance evaluations Q4 6% 30% Y n/a 12
Percentage of leaders educated in LEAN methodology Q4 17% 100% Y n/a 13
Our Programs, Plans and HIT indicator #17, Percentage of equipment cost to total expense 5.2% 5.4% 5.9% R M 14
Partners:
As a unified organization, lead the Q1
Number of standardized order sets used
development of a coordinated plan for the 2011/12
provision of care for all of Scarborough. Percentage of Clinical Service Plan (CSP) recommendations implemented
Q4
100%
2011/12
Our Performance: Percentage of PMO project milestones met 40% 47% 80% R L 15
Create an accountable, high performing
Percentage of Programs and Departments with performance indicator scorecards and action plans
organization that delivers measureable 65% 75% 100% R L 16
results.
that are posted and updated quarterly on the Intranet
Percentage of accountability agreement indicators achieved 88% 88% 80% G n/a 17
* Risk rating only completed for indicators that are not meeting the target and have not improved over the prior reporting period
Current Status Legend: Risk Rating Legend
Red = Performance indicator has not met the target for the current reporting period, and has not improved over the prior reporting period L = Low reputational, financial or operational risk
Yellow = Performance is below the target, however it has improved over the previous reporting period M = Medium reputational, financial or operational risk
Green = Performance indicator has met or exceeded or is not statistically different than the performance target for the current reporting period H = High reputational, financial or operational risk
Vision: To be recognized as Canada’s leader in providing the best healthcare for a global community.
Mission: To provide an outstanding care experience that meets the unique needs of each and every patient.
Values: I ntegrity, C ompassion, A ccountability, R espect, E xcellence
Page 1
2. The Scarborough Hospital
Corporate Balanced Scorecard
Quality Improvement Plan (QIP), Hospital Services Accountability Agreement (HSAA)
and Publicly Reported Patient Safety Indicators (PRPSI)
QIP Priority 1st Qtr 2011/12 QIP
TSH Strategic Direction Indicator Indicator Origin QIP Dimension Rating Reported Current Value Previous Value 2010/11 Target Current Status Risk Rating* Target Page
1. Rate of Hospital Acquired C. difficile Associated Diarrhea (CDI) QIP / PRPSI Safety 2 0.32 0.26 0.33 G n/a 0.28 A1
2. Rate of Central Line Infection (CLI) QIP / PRPSI Safety 1 1.48 0.00 0.79 R L 1.93 A2
3. Rate of Ventilator Associated Pneumonia (VAP) QIP / PRPSI Safety 2 0.00 0.61 1.33 G n/a 1.46 A3
Our Patients 4. Rate of hand hygiene compliance before initial patient/patient environment contact QIP Safety 2 83% 93% 90% R L 90% A4
5. Rate of hand hygiene compliance after patient/patient environment contact 90% 100% 90% G n/a A4
6. Rate of Hospital Acquired Methicillin Resistant Staphylococcus Aureus (MRSA) Bacteraemia PRPSI 0.00 0.00 0.02 G n/a A5
7. Rate of Hospital Acquired Vancomycin Resistant Enterococcus (VRE) Bacteraemia PRPSI 0.00 0.00 0.00 G n/a A6
8. Rate of Timely Administration of Prophylactic Antibiotics - Primary Hip PRPSI 100.0% 97.1% 96.1% G n/a A7
9. Rate of Timely Administration of Prophylactic Antibiotics - Primary Knee PRPSI 96.6% 97.7% 96.1% G n/a A8
10. WHO surgical checklist compliance 100% 100% 98% G n/a A9
11. Hospital Standardized Mortality Ratio (HSMR) QIP Effectiveness 2 74 84 100 G n/a 100 A10
12. 30 day readmission rate to any facility - All tracked CMGs QIP Effectiveness 2 14.5% 14.5% 14.5% G n/a 14.5% A11
13. Percentage of ALC days QIP / HSAA Effectiveness 1 15.9% 12.2% 12.2% R H 12.2% A12
14. Emergency Department Wait Time for High Acuity Visits - General Campus PRPSI 13:49 14:33 8:00 Y n/a A14
15. Emergency Department Wait Time for High Acuity Visits - Birchmount Campus PRPSI 19:07 12:07 8:00 R H A15
16. Emergency Department Wait Time for Low Acuity Visits - General Campus PRPSI 5:02 4:47 4:00 R H A16
17. Emergency Department Wait Time for Low Acuity Visits - Birchmount Campus PRPSI 4:50 4:20 4:00 R H A17
18. Admitted patient treated within the LOS target of less than 8 hours - General Campus P4R 30% 32% 31% R H A18
19. Admitted patient treated within the LOS target of less than 8 hours - Birchmount Campus P4R 27% 34% 36% R H A19
20. Non-admitted high acuity patients treated within their respective targets of <=8 hours - General Campus P4R 91% 90% 87% G n/a A20
21. Non-admitted high acuity patients treated within their respective targets of <=8 hours - Birchmount Campus P4R 89% 91% 90% R H A21
22. Non-admitted low acuity patients treated within their respective targets of <=4 hours - General Campus P4R 85% 81% 81% G n/a A22
23. Non-admitted low acuity patients treated within their respective targets of <=4 hours - Birchmount Campus P4R 81% 83% 77% G n/a A23
24. 90th percentile physician initial assessment time - General Campus PRPSI 4:21 4:35 4:06 Y n/a A24
25. 90th percentile physician initial assessment time - Birchmount Campus PRPSI 3:40 3:06 3:48 G n/a A25
26. 90th Percentile ER Lengh of Stay for Admitted Patients QIP / HSAA Access 1 44:14 36:43 25:00 R H 25:00 A26
27. 90th Percentile ER Length of Stay for Complex Condition Patients QIP / HSAA Access 1 8:01 8:19 8:00 Y n/a 8:00 A27
28. Wait Time - General Surgery HSAA / PRPSI 76 67 182 G n/a A28
29. Wait Time - Cancer Surgery HSAA / PRPSI 53 54 84 G n/a A29
30. Wait Time - Cataract Surgery HSAA / PRPSI 120 225 182 G n/a A30
31. Wait Time - Total Hip Replacement HSAA / PRPSI 131 151 182 G n/a A31
32. Wait time - Total Knee Replacement HSAA / PRPSI 108 153 182 G n/a A32
33. Wait Time - CT HSAA / PRPSI 19 23 28 G n/a A33
34. Wait Time - MRI HSAA / PRPSI 97 116 28 Y n/a A34
35. Patient satisfaction - Overall Impression: Emergency Department QIP Patient-Centred 1 54.5 46.7 50 G n/a 50 A35
36. Patient satisfaction - Overall Impression: In-patients QIP Patient-Centred 1 59.2 66.3 70 R H 70 A36
37. Repeat Unplanned Emergency Visited within 30 Days for Mental Health Conditions HSAA Q1 2011/12
38. Repeat Unplanned Emergency Visited within 30 Days for Substance Abuse Conditions HSAA Q1 2011/12
Addendum 1
3. The Scarborough Hospital
Corporate Balanced Scorecard
Quality Improvement Plan (QIP), Hospital Services Accountability Agreement (HSAA)
and Publicly Reported Patient Safety Indicators (PRPSI)
QIP Priority 1st Qtr 2011/12 QIP
TSH Strategic Direction Indicator Indicator Origin QIP Dimension Rating Reported Current Value Previous Value 2010/11 Target Current Status Risk Rating* Target Page
39. Total margin QIP / HSAA Effectiveness 1 0.04% -0.31% 0% G n/a 0% A38
40. Current Ratio HSAA 0.38 0.39 0.39 R M A39
41. Total weighted cases (Inpatient and Day Surgery) HSAA 43,171 43,027 40,712 G n/a A40
Our Performance 42. Mental Health Patient Days HSAA 16,027 15,425 15,000 G n/a A41
43. Rehab Patient Days HSAA 2,740 3,221 3,530 R M A42
44. Emergency Visits HSAA 103,683 99,915 98,000 G n/a A43
45. Ambulatory Visits (excluding ER) HSAA 307,556 303,662 294,773 G n/a A44
46. Total Hip and Knee Replacement HSAA 1,296 1,275 1,225 G n/a A45
47. Cataract Surgeries HSAA 6,414 5,894 5,815 G M A46
48. Computed Tomography (CT) HSAA 8,072 8,352 7,245 G n/a A47
49. Magnetic Resonance Imaging (MRI) HSAA 6,701 6,123 5,657 G n/a A48
* Risk rating only completed for indicators that are not meeting the target and have not improved over the prior reporting period
Current Status Legend: Priority Legend
Red = Performance indicator has not met the target for the current reporting period, and has not improved over the prior reporting period Priority 1 - Highest priority
Yellow = Performance is below the target, however it has improved over the previous reporting period • Current performance below “benchmark” (if one exists) or below long term goal; significant improvements required or
Green = Performance indicator has met or exceeded or is not statistically different than the performance target for the current reporting period improvement initiatives underway.
• Aligned with organizational priorities/strategic plan, defined accreditation priority or recommendation, funding tied to
initiative, aligned with government agenda
Risk Rating Legend Priority 2 - Moderate priority:
L = Low reputational, financial or operational risk • Current performance just below “benchmark” (if one exists) or below long term goal; room for improvement
M = Medium reputational, financial or operational risk • Aligned with organizational priorities/strategic plan, defined accreditation priority or recommendation, funding tied to
H = High reputational, financial or operational risk initiative, aligned with government agenda
Priority 3 - Lower priority:
• Current performance at/above” benchmark”, provincial rate or long term goal
• Organizational priority
Vision: To be recognized as Canada’s leader in providing the best healthcare for a global community.
Mission: To provide an outstanding care experience that meets the unique needs of each and every patient.
Values: I ntegrity, C ompassion, A ccountability, R espect, E xcellence
Addendum 2
4. The Scarborough Hospital
Corporate Balanced Scorecard
Quality Improvement Plan (QIP), Hospital Services Accountability Agreement (HSAA)
and Publicly Reported Patient Safety Indicators (PRPSI)
Indicator QIP - Rate of Hospital Acquired C. difficile Associated Diarrhea
Strategic Direction Our Patients
Time Frame March 2011
Source Surveillance and Case Finding
Performance Measurement Summary
Definition
0.70
0.58, n=5
0.58, n=5
Overall Rate of hospital acquired C. difficile associated diarrhea. Rate is based on
total number of inpatients/patients with confirmed infection per 1000 patient-days.
0.53, n=5
0.51, n=3
0.60
0.49, n=3
0.49, n=3
0.47, n=7
0.47, n=7
0.46, n=4
0.45, n=4
0.45, n=4
Significance
0.43, n=6
To track hospital acquired C. difficile rates in order to identify and implement
0.50
0.38, n=6
0.37, n=3
0.36, n=3
infection control measures to prevent nosocomial spread of C.difficile. While C.
0.35, n=5
0.34, n=5
0.34, n=2
0.33, n=2
difficile does not usually present a big problem for reasonably healthy adults, it can
0.32, n=5
be quite serious for those who are frail or have other health challenges. 0.40
0.26, n=4
0.26, n=2
C. difficile is communicable. It can live in the environment and on other surfaces.
0.25, n=2
0.24, n=2
0.23, n=2
0.22, n=3
Rigorous cleaning regimes, patient isolation and hand washing are some of the
0.22, n=3
0.22, n=3
0.20, n=3
strategies used to combat C. difficile. 0.30
0.17, n=1
0.16, n=1
0.15, n=1
0.15, n=1
0.15, n=2
Target
0.13, n=1
0.13, n=1
Ontario Average - 0.33, lower value is desired. CHART PLACEHOLDER
0.20
0.07, n=1
Risk Rating
0.00, n=0
0.00, n=0
0.00, n=0
0.00, n=0
0.00, n=0
0.00, n=0
0.00, n=0
0.00, n=0
n/a 0.10
Analysis -
QIP use rate for January to December 2010. There have been a few months of
Oct 10
Feb 10
Apr 10
May 10
Aug 10
Sep 10
Feb 11
Jun 10
Jul 10
Jan 10
Mar 10
Nov 10
Dec 10
Jan 11
Mar 11
increased cases of C. difficile at the General Campus since February 2010. Rates
have begun to decline with increased monitoring and vigilance of infection control
practices in the inpatient areas. The Birchmount Campus remains below the General Campus Birchmount Campus
Ontario Average. TSH Ontario Average per 1,000 patient-days
TSH Rolling 12-month Average QIP Reported Value=0.26
Action Plan
SMART Initiative (Specific, Measureable, Attainable, Realistic, Time-Bound) Lead Date Initiated Current Status
Indicator meeting or exceeding target, no action plan required n/a n/a n/a
Page A1
5. The Scarborough Hospital
Corporate Balanced Scorecard
Quality Improvement Plan (QIP), Hospital Services Accountability Agreement (HSAA)
and Publicly Reported Patient Safety Indicators (PRPSI)
Indicator QIP - Rate of Central Line Infection (CLI)
Strategic Direction Our Patients
Time Frame Q4 2010/11
Source Surveillance and Case Finding
Performance Measurement Summary
Definition
Overall rate of hospital acquired Central Line Infection. Rate is based on total 8.00
6.32, n=6
number of CLI incidents diagnosed after two days of Critical Care admission per
1000 patient days. 7.00
4.98, n=5
Significance 6.00
4.58, n=6
To track hospital acquired CLI rates in order to identify and implement necessary
3.90, n=6
prevention plans to reduce the risk of infection from spreading. 5.00
4.00
2.54, n=1
2.36, n=1
2.31, n=3
Target
2.21, n=2
2.06, n=3
Ontario Average - 0.79, lower value is desired.
1.87, n=1
3.00 CHART PLACEHOLDER
1.48, n=3
1.14, n=1
Risk Rating
2.00
0.75, n=1
0.69, n=1
Low - Controlling the rate of infection is very important to TSH. The increase in the
rate of infection may cause some financial and reputational risk to the organization.
0.00, n=0
0.00, n=0
0.00, n=0
0.00, n=0
0.00, n=0
0.00, n=0
0.00, n=0
0.00, n=0
0.00, n=0
0.00, n=0
1.00
Analysis
QIP use rate for January to December 2010. There has been a marked
improvement to the number of CLI cases in 2010/11 at the General Campus. CLI 0.00
strategies to standardize processes across the campuses is showing improvements Q1 2009/10 Q2 2009/10 Q3 2009/10 Q4 2009/10 Q1 2010/11 Q2 2010/11 Q3 2010/11 Q4 2010/11
in the rates. There is lower rate of infection associated with PICC, therefore the use
of PICC has been increased. General Campus Birchmount Campus
TSH Ontario Average per 1,000 patient-days
TSH Rolling 12-month Average QIP Reported Value=1.76
Action Plan
SMART Initiative (Specific, Measureable, Attainable, Realistic, Time-Bound) Lead Date Initiated Current Status
Monthly monitoring of insertions and maintenance Bundle which includes hand H. Clasky, D. Rose, P. Apr-10 Monthly audits
hygiene, maximal barrier precautions, and chlorhexidine skin antisepsis and optimal Tamlin, R. Lovinsky, C.
catheter side selection to adhere the compliance of 90% to decrease rate of CLI for Shelton
the next quarter
Expanded data collection to include the program that the hemodialysis patients are H. Clasky, R. Lovinsky, Mar-11 Data collection in progress
coming from, type of line being used, and CLI reduction interventions such as the IPAC
use of chlorhexidine dressing and bath to investigate higher rate of CLI in the
hemodialysis population by Q2 of 2011/12
Page A2
6. The Scarborough Hospital
Corporate Balanced Scorecard
Quality Improvement Plan (QIP), Hospital Services Accountability Agreement (HSAA)
and Publicly Reported Patient Safety Indicators (PRPSI)
Indicator QIP - Rate of Ventilator Associated Pneumonia (VAP)
Strategic Direction Our Patients
Time Frame Q4 2010/11
Source Surveillance and Case Finding
Performance Measurement Summary
Definition
Overall Rate of hospital acquired Ventilator Associated Pneumonia. Rate is based 7.0
on total number of VAP incidents diagnosed after two days of Critical Care
admission per 1000 patient days.
6.0
4.56, n=2
Significance
5.0
To track hospital acquired VAP rates in order to identify and implement necessary
prevention plans to reduce the risk of development of pneumonia in the ICU patient
population. 4.0
2.47, n=2
Target 3.0
1.63, n=2
Ontario Average - 1.33, lower value is desired.
1.58, n=2
1.40, n=1
CHART PLACEHOLDER
1.14, n=1
0.90, n=1
2.0
0.76, n=1
Risk Rating
n/a
0.00, n=0
0.00, n=0
0.00, n=0
0.00, n=0
0.00, n=0
0.00, n=0
0.00, n=0
0.00, n=0
0.00, n=0
0.00, n=0
0.00, n=0
0.00, n=0
0.00, n=0
0.00, n=0
0.00, n=0
0.00, n=0
1.0
Analysis
QIP use rate for January to December 2010. There were zero VAP case
0.0
identified in the Q4. Currently meeting target.
Q1 2009/10 Q2 2009/10 Q3 2009/10 Q4 2009/10 Q1 2010/11 Q2 2010/11 Q3 2010/11 Q4 2010/11
General Campus Birchmount Campus
TSH Ontario Average per 1,000 patient-days
TSH Rolling 12-month Average QIP Reported Value=1.22
Action Plan
SMART Initiative (Specific, Measureable, Attainable, Realistic, Time-Bound) Lead Date Initiated Current Status
Indicator meeting or exceeding target, no action plan required n/a n/a n/a
Page A3
7. The Scarborough Hospital
Corporate Balanced Scorecard
Quality Improvement Plan (QIP), Hospital Services Accountability Agreement (HSAA)
and Publicly Reported Patient Safety Indicators (PRPSI)
Indicator QIP - Rate of hand hygiene compliance
Strategic Direction Our Patients
Time Frame Q4 2010/11
Source Surveillance and Case Finding
Performance Measurement Summary
Definition
The single most common way of transferring health care-associated infections (HAIs) 140%
in health care settings is on the hands of health care providers. Health care providers
100%, n=56
100%, n=56
100%, n=7
96%, n=392
96%, n=392
move from patient to patient and room to room while providing care and working in the
92%, n=1180
92%, n=1187
97%, n=58
96%, n=25
96%, n=25
96%, n=25
96%, n=25
120%
95%, n=57
93%, n=52
93%, n=52
93%, n=62
90%, n=301
90%, n=361
89%, n=412
patient environment. This movement provides many opportunities for the transmission
85%, n=1070
85%, n=1063
88%, n=354
87%, n=360
87%, n=360
90%, n=60
85%, n=391
84%, n=334
83%, n=330
88%, n=7
of organisms on hands that can cause infections.
81%, n=268
100%
Significance
Proper hand hygiene protects patients and providers and will reduce the spread of 80%
infections and the associated treatment costs, reduce hospital lengths of stay and
readmissions, reduce wait times, and prevent deaths.
60%
Target. CHART PLACEHOLDER
Ontario Target - 90% Before and 90% After, higher value is desired. 40%
Risk Rating
20%
0%, n=0
0%, n=0
0%, n=0
0%, n=0
0%, n=0
0%, n=0
Low- Reputational, financial or operational risk.
Analysis 0%
QIP use rate for 2009/10, only for before patient contact. Due to the lack of hand Before After Before After Before After Before After Before After Before After
hygiene auditors and the VRE issue, there were not enough audits done to report for
Q3 at the General Campus. In Q4 IPAC trained unit based auditors to carryout the Q3 2009/10 Q4 2009/10 Q1 2010/11 Q2 2010/11 Q3 2010/11 Q4 2010/11
audits to meet mandatory reporting requirements. The results of the before compliance
are below TSH target; however, well above the Ontario average of 72.17%.
General Campus Birchmount Campus TSH Target QIP Reported Value=92.3%
Action Plan
SMART Initiative (Specific, Measureable, Attainable, Realistic, Time-Bound) Lead Date Initiated Current Status
Development of a audit process to monitor unit based hand hygiene audits and IPAC Mar-11 In progress, on a monthly basis
program overseen by IPAC and Decision Support. Monthly audit to observe number of
times hand hygiene performed before patient contact.
Page A4
8. The Scarborough Hospital
Corporate Balanced Scorecard
Quality Improvement Plan (QIP), Hospital Services Accountability Agreement (HSAA)
and Publicly Reported Patient Safety Indicators (PRPSI)
Indicator Rate of Hospital Acquired Methicillin Resistant Staphylococcus Aureus (MRSA) Bacteraemia
Strategic Direction Our Patients
Time Frame Q4 2010/11
Source Surveillance and Case Finding
Performance Measurement Summary
Definition 0.16
Overall Rate of hospital acquired Methicillin Resistant Staphylococcus Aureus
(MRSA) bacteraemia. Rate is based on total number of inpatients/patients with
0.14
confirmed infection per 1000 patient-days.
0.12
Significance
Higher MRSA colonization rates will lead to higher rates of blood stream infections 0.10
with MRSA. Tracking hospital acquired MRSA Bacteraemia rates helps to identify
0.06, n=1
the clinical significance of MRSA colonization. This will help identify a need for 0.08
further strategies to prevent nosocomial spread of MRSA.
0.04, n=1
0.04, n=1
0.04, n=1
Target 0.06
0.02, n=1
0.02, n=1
0.02, n=1
0.02, n=1
Ontario Average - 0.02, lower value is desired.
0.04 CHART PLACEHOLDER
Risk Rating
0.00, n=0
0.00, n=0
0.00, n=0
0.00, n=0
0.00, n=0
0.00, n=0
0.00, n=0
0.00, n=0
0.00, n=0
0.00, n=0
0.00, n=0
0.00, n=0
0.00, n=0
0.00, n=0
0.00, n=0
0.00, n=0
0.00, n=0
0.00, n=0
0.00, n=0
0.00, n=0
0.00, n=0
0.00, n=0
n/a
0.02
0.00
Analysis
Both General Campus and Birchmount Campus remains below the Ontario
Average.
General Campus Birchmount Campus
TSH Ontario Average per 1,000 patient-days
TSH Rolling 12-month Average
Action Plan
SMART Initiative (Specific, Measureable, Attainable, Realistic, Time-Bound) Lead Date Initiated Current Status
Indicator meeting or exceeding target, no action plan required n/a n/a n/a
Page A5
9. The Scarborough Hospital
Corporate Balanced Scorecard
Quality Improvement Plan (QIP), Hospital Services Accountability Agreement (HSAA)
and Publicly Reported Patient Safety Indicators (PRPSI)
Indicator Rate of Hospital Acquired Vancomycin Resistant Enterococcus (VRE) Bacteraemia
Strategic Direction Our Patients
Time Frame Q4 2010/11
Source Surveillance and Case Finding
Performance Measurement Summary
Definition
Overall Rate of hospital acquired Vancomycin Resistant Enterococcus (VRE) 0.012
bacteraemia. Rate is based on total number of inpatients/patients with confirmed
infection per 1000 patient-days.
0.010
Significance
To track hospital acquired VRE bacteraemia rates in order to identify and implement 0.008
necessary prevention plans to reduce the risk of infection from spreading.
0.006
Target
0.004
Ontario Average - 0.00, lower value is desired.
CHART PLACEHOLDER
0.00, n=0
0.00, n=0
0.00, n=0
0.00, n=0
0.00, n=0
0.00, n=0
0.00, n=0
0.00, n=0
0.00, n=0
0.00, n=0
0.00, n=0
0.00, n=0
0.00, n=0
0.00, n=0
0.00, n=0
0.00, n=0
0.00, n=0
0.00, n=0
0.00, n=0
0.00, n=0
0.00, n=0
0.00, n=0
0.00, n=0
0.00, n=0
0.00, n=0
0.00, n=0
0.00, n=0
0.00, n=0
0.00, n=0
0.00, n=0
Risk Rating 0.002
n/a
0.000
Analysis
There have been no reportable cases of VRE bacteraemia despite increased
numbers of VRE colonized patients since April 2010.
General Campus Birchmount Campus
TSH Ontario Average per 1,000 patient-days
TSH Rolling 12-month Average
Action Plan
SMART Initiative (Specific, Measureable, Attainable, Realistic, Time-Bound) Lead Date Initiated Current Status
Indicator meeting or exceeding target, no action plan required n/a n/a n/a
Page A6