The document discusses steps for troubleshooting CPU spikes in Java applications. It outlines three main steps:
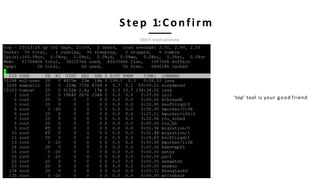
1. Confirm there is a CPU issue using the 'top' tool and identify the threads consuming the most CPU.
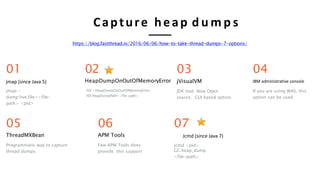
2. Capture thread dumps to analyze the state and stack traces of threads. Options for capturing thread dumps include jstack, jcmd, and killing the process with SIGQUIT.
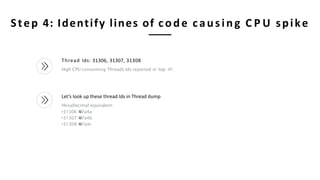
3. Analyze the thread dumps and stack traces to identify the lines of code causing the high CPU consumption. Common patterns in thread dumps that indicate issues are also discussed.


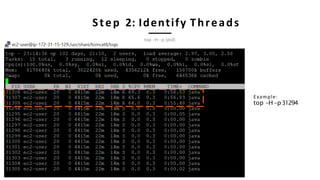
![2019-02-2617:13:23
"Reconnection-1" prio=10 tid=0x00007f0442e10800 nid=0x112a waiting on condition
[0x00007f042f719000]
java.lang.Thread.State: WAITING (parking)
at sun.misc.Unsafe.park(Native Method)
- parking to wait for <0x007b3953a98> (a java.util.concurrent.locks.AbstractQueuedSynchr) at
java.util.concurrent.locks.LockSupport.park(LockSupport.java:186)at java.lang.Thread.run(Thread.java:722)
:
:
1
2
3
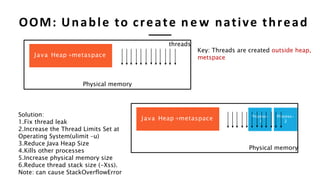
1 Timestamp at which thread dump was triggered
2 JVM Versioninfo
3 Thread Details-<<detailsin following slides>>
Anatomy of thread d u m p
Full thread dump Java HotSpot(TM) 64-Bit Server VM (23.7-b01 mixed mode):
"InvoiceThread-A996" prio=10 tid=0x00002b7cfc6fb000 nid=0x4479 runnable [0x00002b7d17ab8000] java.lang.Thread.State:
RUNNABLE
at com.buggycompany.rt.util.ItinerarySegmentProcessor.setConnectingFlight(ItinerarySegmentProcessor.java:380) at
com.buggycompany.rt.util.ItinerarySegmentProcessor.processTripType0(ItinerarySegmentProcessor.java:366)
at com.buggycompany.rt.util.ItinerarySegmentProcessor.processItineraryByTripType(ItinerarySegmentProcessor.java:254) at
com.buggycompany.rt.util.ItinerarySegmentProcessor.templateMethod(ItinerarySegmentProcessor.java:399)
at com.buggycompany.qc.gds.InvoiceGeneratedFacade.readTicketImage(InvoiceGeneratedFacade.java:252) at
com.buggycompany.qc.gds.InvoiceGeneratedFacade.doOrchestrate(InvoiceGeneratedFacade.java:151)
at com.buggycompany.framework.gdstask.BaseGDSFacade.orchestrate(BaseGDSFacade.java:32)
at com.buggycompany.framework.gdstask.BaseGDSFacade.doWork(BaseGDSFacade.java:22)
at com.buggycompany.framework.concurrent.BuggycompanyCallable.call(buggycompanyCallable.java:80) at
java.util.concurrent.FutureTask$Sync.innerRun(FutureTask.java:334)
at java.util.concurrent.FutureTask.run(FutureTask.java:166)
at java.util.concurrent.ThreadPoolExecutor.runWorker(ThreadPoolExecutor.java:1145) at
java.util.concurrent.ThreadPoolExecutor$Worker.run(ThreadPoolExecutor.java:615) at java.lang.Thread.run(Thread.java:722)](https://image.slidesharecdn.com/troubleshootingperformanceavailabilityproblems1-191108094705/85/Troubleshooting-performanceavailabilityproblems-1-6-320.jpg)
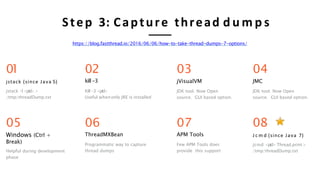
!["InvoiceThread-A996" prio=10 tid=0x00002b7cfc6fb000 nid=0x4479 runnable
[0x00002b7d17ab8000]
java.lang.Thread.State: RUNNABLE
at com.buggycompany.rt.util.ItinerarySegmentProcessor.setConnectingFlight(ItinerarySegmentProcessor.java:380) at
com.buggycompany.rt.util.ItinerarySegmentProcessor.processTripType0(ItinerarySegmentProcessor.java:366)
at com.buggycompany.rt.util.ItinerarySegmentProcessor.processItineraryByTripType(ItinerarySegmentProcessor.java:254) at
com.buggycompany.rt.util.ItinerarySegmentProcessor.templateMethod(ItinerarySegmentProcessor.java:399)
at com.buggycompany.qc.gds.InvoiceGeneratedFacade.readTicketImage(InvoiceGeneratedFacade.java:252) at
com.buggycompany.qc.gds.InvoiceGeneratedFacade.doOrchestrate(InvoiceGeneratedFacade.java:151)
at com.buggycompany.framework.gdstask.BaseGDSFacade.orchestrate(BaseGDSFacade.java:32) at
com.buggycompany.framework.gdstask.BaseGDSFacade.doWork(BaseGDSFacade.java:22)
at com.buggycompany.framework.concurrent.BuggycompanyCallable.call(buggycompanyCallable.java:80) at
java.util.concurrent.FutureTask$Sync.innerRun(FutureTask.java:334)
at java.util.concurrent.FutureTask.run(FutureTask.java:166)
at java.util.concurrent.ThreadPoolExecutor.runWorker(ThreadPoolExecutor.java:1145) at
java.util.concurrent.ThreadPoolExecutor$Worker.run(ThreadPoolExecutor.java:615) at
java.lang.Thread.run(Thread.java:722)
1 2 3 4 5
6
7
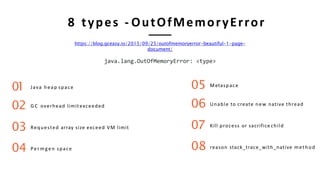
1 Thread Name -InvoiceThread-A996
2 Priority -Can have values from 1to10
3 Thread Id - 0x00002b7cfc6fb000 – Unique ID assigned by JVM. It's returned by calling the Thread.getId() method.
4
5
6
7
Native Id - 0x4479 - This ID is highly platform dependent. On Linux, it's the pid of the thread. On Windows, it's simply the OS-level
thread a process. On Mac OS X, it is said to be the native pthread_t value.
Address space - 0x00002b7d17ab8000 -
Thread State - RUNNABLE
Stack trace -](https://image.slidesharecdn.com/troubleshootingperformanceavailabilityproblems1-191108094705/85/Troubleshooting-performanceavailabilityproblems-1-7-320.jpg)