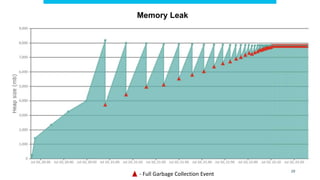
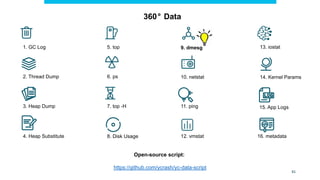
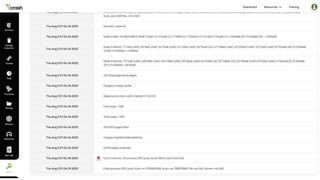
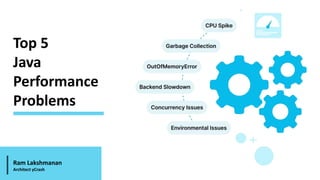
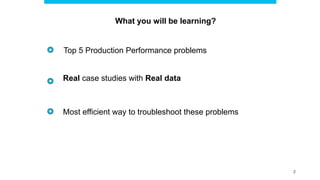
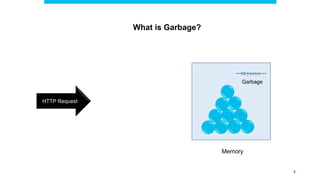
Top 5
Java
Performance
Problems
Ram Lakshmanan
Architect yCrash
Top 5 Production Performance problems
What you will be learning?
2
Real case studies with Real data
Most efficient way to troubleshoot these problems
Garbage Collection
3
What is Garbage?
HTTP Request
Objects
Memory
Garbage
4
5
3-4 Decades ago
Developer
Writes code to Manually evict Garbage
JVM
Automatically evicts Garbage
Now
How are objects Garbage Collected?
Evolution: Manual -> Automatic
6
Automatic GC sounds good right?
Yes, but for
GC pauses CPU consumption
Open-source script:
https://github.com/ycrash/yc-data-script
1. GC Log
10. netstat
12. vmstat
2. Thread Dump
9. dmesg
3. Heap Dump
6. ps
8. Disk Usage
5. top 13. iostat
11. ping
14. Kernel Params
15. App Logs
16. metadata
4. Heap Substitute
7. top -H
7
360° Troubleshooting artifacts
2019-08-31T01:09:19.397+0000: 1.606: [GC (Metadata GC Threshold) [PSYoungGen: 545393K->18495K(2446848K)] 545393K->18519K(8039424K),
0.0189376 secs] [Times: user=0.15 sys=0.01, real=0.02 secs]
2019-08-31T01:09:19.416+0000: 1.625: [Full GC (Metadata GC Threshold) [PSYoungGen: 18495K->0K(2446848K)] [ParOldGen: 24K-
>17366K(5592576K)] 18519K->17366K(8039424K), [Metaspace: 20781K->20781K(1067008K)], 0.0416162 secs] [Times: user=0.38 sys=0.03,
real=0.04 secs]
2019-08-31T01:18:19.288+0000: 541.497: [GC (Metadata GC Threshold) [PSYoungGen: 1391495K->18847K(2446848K)] 1408861K-
>36230K(8039424K), 0.0568365 secs] [Times: user=0.31 sys=0.75, real=0.06 secs]
2019-08-31T01:18:19.345+0000: 541.554: [Full GC (Metadata GC Threshold) [PSYoungGen: 18847K->0K(2446848K)] [ParOldGen: 17382K-
>25397K(5592576K)] 36230K->25397K(8039424K), [Metaspace: 34865K->34865K(1079296K)], 0.0467640 secs] [Times: user=0.31 sys=0.08,
real=0.04 secs]
2019-08-31T02:33:20.326+0000: 5042.536: [GC (Allocation Failure) [PSYoungGen: 2097664K->11337K(2446848K)] 2123061K->36742K(8039424K),
0.3298985 secs] [Times: user=0.00 sys=9.20, real=0.33 secs]
2019-08-31T03:40:11.749+0000: 9053.959: [GC (Allocation Failure) [PSYoungGen: 2109001K->15776K(2446848K)] 2134406K->41189K(8039424K),
0.0517517 secs] [Times: user=0.00 sys=1.22, real=0.05 secs]
2019-08-31T05:11:46.869+0000: 14549.079: [GC (Allocation Failure) [PSYoungGen: 2113440K->24832K(2446848K)] 2138853K->50253K(8039424K),
0.0392831 secs] [Times: user=0.02 sys=0.79, real=0.04 secs]
2019-08-31T06:26:10.376+0000: 19012.586: [GC (Allocation Failure) [PSYoungGen: 2122496K->25600K(2756096K)] 2147917K->58149K(8348672K),
0.0371416 secs] [Times: user=0.01 sys=0.75, real=0.04 secs]
2019-08-31T07:50:03.442+0000: 24045.652: [GC (Allocation Failure) [PSYoungGen: 2756096K->32768K(2763264K)] 2788645K->72397K(8355840K),
0.0709641 secs] [Times: user=0.16 sys=1.39, real=0.07 secs]
2019-08-31T09:04:21.406+0000: 28503.616: [GC (Allocation Failure) [PSYoungGen: 2763264K->32768K(2733568K)] 2802893K->83469K(8326144K),
0.0789178 secs] [Times: user=0.12 sys=1.59, real=0.08 secs]
Sample GC Log
How to analyze GC Log?
https://developer.ibm.co
m/javasdk/tools/
IBM GC & Memory visualizer
GCeasy
yCrash
https://gceasy.io/
Google Garbage cat (cms)
https://code.google.com/
archive/a/eclipselabs.org/
p/garbagecat
HP Jmeter
https://h20392.www2.hpe
.com/portal/swdepot/displ
ayProductInfo.do?produc
tNumber=HPJMETER
03
02
01
05
04
https://ycrash.io/
9
10
Case Study
Long GC Pauses in Top Cloud hosting
Provider
https://blog.gceasy.io/2022/03/04/garbage-collection-tuning-success-story-reducing-young-gen-size/
How does 96% GC Throughput sound?
1 day = 1440 Minutes (i.e., 24 hours x 60 minutes)
96% GC Throughput means app pausing for 57.6
minutes/day 11
What is GC Throughput?
Amount of time application spends in processing customer
transactions
vs
Amount of time application spends in processing garbage
collection activity
12
Case Study: Large Automobile Manufacturer
Response time
Avg response time (secs) Transactions > 25 secs (%)
Baseline 1.88 0.7
GC settings #2 1.36 0.12
GC settings #3 1.7 0.11
GC settings #4 1.48 0.08
GC settings #5 2.045 0.14
GC settings #6 1.087 0.24
GC settings #7 1.03 0.14
GC settings #8 0.95 0.31
49.46%
Improvement
https://blog.gceasy.io/2022/03/04/garbage-collection-tuning-success-story-reducing-young-gen-size/
13
More case studies
Uber Saves Millions of $
https://blog.gceasy.io/2022/03/04/garbage-collection-tuning-success-story-reducing-young-gen-size/
Large Automobile Manufacturer Improves Response Time
https://blog.gceasy.io/2022/03/04/garbage-collection-tuning-success-story-reducing-young-gen-size/
CloudBees (Jenkins Parent company) optimizes
https://blog.gceasy.io/2019/08/01/cloudbees-gc-performance-optimized-with-gceasy/
Oracle optimizes App performance by tuning GC
https://blog.gceasy.io/2022/12/06/oracle-architect-optimizes-performance-using-gceasy/
14
Large SaaS company CEO’s tweet
15
How to tune GC
performance?
Free Video: https://www.youtube.com/watch?v=6G0E4O5yxks
Online Training: https://ycrash.io/java-performance-training
16
Backend Slowdown
Application Architecture
JDBC
SOAP
MainFrame
REST
Server Thread Pool
Application Server
HTTP(S) request
17
Application Architecture
JDBC
SOAP
MainFrame
REST
Server Thread Pool
Application Server
HTTP(S) request
18
1. GC Log
10. netstat
12. vmstat
2. Thread Dump
9. dmesg
3. Heap Dump
(optional)
6. ps
8. Disk Usage
5. top 13. iostat
11. ping
14. Kernel Params
15. App Logs
16. metadata
4. Heap Substitute
7. top -H
19
Open-source script:
https://github.com/ycrash/yc-data-script
360° Troubleshooting artifacts
1 2
3
1 Timestamp at which thread dump was triggered
2 JVM Version info
3 Thread Details - <<details in following slides>>
20
1 2 3 4 5
6
7
1 Thread Name - InvoiceThread-A996
2 Priority - Can have values from 1 to 10
3 Thread Id - 0x00002b7cfc6fb000 – Unique ID assigned by JVM. It's returned by calling the Thread.getId() method.
4 Native Id - 0x4479 - This ID is highly platform dependent. On Linux, it's the pid of the thread. On Windows, it's simply the OS-level thread ID with
a process. On Mac OS X, it is said to be the native pthread_t value.
5 Address space - 0x00002b7d17ab8000 -
6 Thread State - RUNNABLE
7 Stack trace -
21
How to analyze Thread dump?
https://www.ibm.com/support/pages
/ibm-thread-and-monitor-dump-
analyzer-java-tmda
IBM TDMA
FastThread
https://fastthread.io/
03
02
https://tinyurl.com/wq95weo
Sample thread
report
yCrash
https://ycrash.io/
01
22
23
Case Study
Backend Slowdown in a Major
Financial Institution in N.
America
Analysis Report: https://fastthread.io/my-thread-report.jsp?p=c2hhcmVkLzIwMjIvMDcvMzEvdGhyZWFkX2thc3RsZV8yNjA3MjIudHh0LS03LTMwLTMzLS0xNi0zMy0zNg==&&s=t
What’s typically reported in APM? AWS Cloud watch + yCrash = Monitoring + RCA – yCrash
OutOfMemoryError
24
25
Memory Leak Program
Open Source app to simulate Performance Problems
BuggyApp
MemoryLeakDemo
Object1
Object2
MapManager
Key1 Large String…1
Key2 Large String…2
key3 Large String…3
:
:
KeyN Large String…N
myMap
27
Memory of Healthy Application
- Full Garbage Collection Event
28
Acute Memory Leak
- Full Garbage Collection Event
29
Memory Leak
- Full Garbage Collection Event
1. GC Log
10. netstat
12. vmstat
2. Thread Dump
9. dmesg
3. Heap Dump
6. ps
8. Disk Usage
5. top 13. iostat
11. ping
14. Kernel Params
15. App Logs
16. metadata
4. Heap Substitute
7. top -H
30
Open-source script:
https://github.com/ycrash/yc-data-script
360° Troubleshooting artifacts
How to analyze Heap dump?
jhat (oracle.com)
Jhat
Eclipse MAT
https://www.eclipse.org/mat
HeapHero
https://heaphero.io/
04
03
02
https://tinyurl.com/5sxz7dsr
Sample heap report
yCrash
https://ycrash.io/
01
31
CPU Spike
32
top –H –p <PROCESS_ID>’
Secrete Option:
33
We might have used ‘top’
1. GC Log
10. netstat
12. vmstat
2. Thread Dump
9. dmesg
3. Heap Dump
6. ps
8. Disk Usage
5. top 13. iostat
11. ping
14. Kernel Params
15. App Logs
16. metadata
4. Heap Substitute
7. top -H
34
Open-source script:
https://github.com/ycrash/yc-data-script
360° Troubleshooting artifacts
Case Study
Major Trading app in N.
America
https://blog.fastthread.io/2020/04/23/troubleshooting-cpu-spike-in-a-major-trading-application/
35
Concurrency Issues
36
public void synchronized getData() {
doSomething();
}
Thread 1
Thread 2
Thread 1
BLOCKED THREADS
BLOCKED thread state
37
1. GC Log
10. netstat
12. vmstat
2. Thread Dump
9. dmesg
3. Heap Dump
6. ps
8. Disk Usage
5. top 13. iostat
11. ping
14. Kernel Params
15. App Logs
16. metadata
4. Heap Substitute
7. top -H
38
Open-source script:
https://github.com/ycrash/yc-data-script
360° Troubleshooting artifacts
Case Study
Major Leisure Travel Service
Provider
https://blog.ycrash.io/2022/03/09/java-uuid-generation-performance-impact/
39
Deadlock
Open-Source apache library
Analysis Report: Deadlock in Apache pdfbox library - yCrash Answers
Deadlock Pattern
41
Environmental Issues
Bonus
Case Study
Intermittent HTTP 502 errors in
AWS EBS Service
42
EBS Architecture
43
Clue: Nginx Error
44
1. GC Log
10. netstat
12. vmstat
2. Thread Dump
9. dmesg
3. Heap Dump
6. ps
8. Disk Usage
5. top 13. iostat
11. ping
14. Kernel Params
15. App Logs
16. metadata
4. Heap Substitute
7. top -H
45
Open-source script:
https://github.com/ycrash/yc-data-script
360° Data
46
Ram Lakshmanan ram@tier1app.com
@tier1app https://www.linkedin.com/company/ycrash
This deck will be published in:
https://blog.heaphero.io
If you want to learn more …
47
THANK YOU
FRIENDS

Top-5-java-perf-problems-jax_mainz_2024.pptx

  • 1.
  • 2.
    Top 5 ProductionPerformance problems What you will be learning? 2 Real case studies with Real data Most efficient way to troubleshoot these problems
  • 3.
  • 4.
    What is Garbage? HTTPRequest Objects Memory Garbage 4
  • 5.
    5 3-4 Decades ago Developer Writescode to Manually evict Garbage JVM Automatically evicts Garbage Now How are objects Garbage Collected? Evolution: Manual -> Automatic
  • 6.
    6 Automatic GC soundsgood right? Yes, but for GC pauses CPU consumption
  • 7.
    Open-source script: https://github.com/ycrash/yc-data-script 1. GCLog 10. netstat 12. vmstat 2. Thread Dump 9. dmesg 3. Heap Dump 6. ps 8. Disk Usage 5. top 13. iostat 11. ping 14. Kernel Params 15. App Logs 16. metadata 4. Heap Substitute 7. top -H 7 360° Troubleshooting artifacts
  • 8.
    2019-08-31T01:09:19.397+0000: 1.606: [GC(Metadata GC Threshold) [PSYoungGen: 545393K->18495K(2446848K)] 545393K->18519K(8039424K), 0.0189376 secs] [Times: user=0.15 sys=0.01, real=0.02 secs] 2019-08-31T01:09:19.416+0000: 1.625: [Full GC (Metadata GC Threshold) [PSYoungGen: 18495K->0K(2446848K)] [ParOldGen: 24K- >17366K(5592576K)] 18519K->17366K(8039424K), [Metaspace: 20781K->20781K(1067008K)], 0.0416162 secs] [Times: user=0.38 sys=0.03, real=0.04 secs] 2019-08-31T01:18:19.288+0000: 541.497: [GC (Metadata GC Threshold) [PSYoungGen: 1391495K->18847K(2446848K)] 1408861K- >36230K(8039424K), 0.0568365 secs] [Times: user=0.31 sys=0.75, real=0.06 secs] 2019-08-31T01:18:19.345+0000: 541.554: [Full GC (Metadata GC Threshold) [PSYoungGen: 18847K->0K(2446848K)] [ParOldGen: 17382K- >25397K(5592576K)] 36230K->25397K(8039424K), [Metaspace: 34865K->34865K(1079296K)], 0.0467640 secs] [Times: user=0.31 sys=0.08, real=0.04 secs] 2019-08-31T02:33:20.326+0000: 5042.536: [GC (Allocation Failure) [PSYoungGen: 2097664K->11337K(2446848K)] 2123061K->36742K(8039424K), 0.3298985 secs] [Times: user=0.00 sys=9.20, real=0.33 secs] 2019-08-31T03:40:11.749+0000: 9053.959: [GC (Allocation Failure) [PSYoungGen: 2109001K->15776K(2446848K)] 2134406K->41189K(8039424K), 0.0517517 secs] [Times: user=0.00 sys=1.22, real=0.05 secs] 2019-08-31T05:11:46.869+0000: 14549.079: [GC (Allocation Failure) [PSYoungGen: 2113440K->24832K(2446848K)] 2138853K->50253K(8039424K), 0.0392831 secs] [Times: user=0.02 sys=0.79, real=0.04 secs] 2019-08-31T06:26:10.376+0000: 19012.586: [GC (Allocation Failure) [PSYoungGen: 2122496K->25600K(2756096K)] 2147917K->58149K(8348672K), 0.0371416 secs] [Times: user=0.01 sys=0.75, real=0.04 secs] 2019-08-31T07:50:03.442+0000: 24045.652: [GC (Allocation Failure) [PSYoungGen: 2756096K->32768K(2763264K)] 2788645K->72397K(8355840K), 0.0709641 secs] [Times: user=0.16 sys=1.39, real=0.07 secs] 2019-08-31T09:04:21.406+0000: 28503.616: [GC (Allocation Failure) [PSYoungGen: 2763264K->32768K(2733568K)] 2802893K->83469K(8326144K), 0.0789178 secs] [Times: user=0.12 sys=1.59, real=0.08 secs] Sample GC Log
  • 9.
    How to analyzeGC Log? https://developer.ibm.co m/javasdk/tools/ IBM GC & Memory visualizer GCeasy yCrash https://gceasy.io/ Google Garbage cat (cms) https://code.google.com/ archive/a/eclipselabs.org/ p/garbagecat HP Jmeter https://h20392.www2.hpe .com/portal/swdepot/displ ayProductInfo.do?produc tNumber=HPJMETER 03 02 01 05 04 https://ycrash.io/ 9
  • 10.
    10 Case Study Long GCPauses in Top Cloud hosting Provider https://blog.gceasy.io/2022/03/04/garbage-collection-tuning-success-story-reducing-young-gen-size/
  • 11.
    How does 96%GC Throughput sound? 1 day = 1440 Minutes (i.e., 24 hours x 60 minutes) 96% GC Throughput means app pausing for 57.6 minutes/day 11 What is GC Throughput? Amount of time application spends in processing customer transactions vs Amount of time application spends in processing garbage collection activity
  • 12.
    12 Case Study: LargeAutomobile Manufacturer Response time Avg response time (secs) Transactions > 25 secs (%) Baseline 1.88 0.7 GC settings #2 1.36 0.12 GC settings #3 1.7 0.11 GC settings #4 1.48 0.08 GC settings #5 2.045 0.14 GC settings #6 1.087 0.24 GC settings #7 1.03 0.14 GC settings #8 0.95 0.31 49.46% Improvement https://blog.gceasy.io/2022/03/04/garbage-collection-tuning-success-story-reducing-young-gen-size/
  • 13.
    13 More case studies UberSaves Millions of $ https://blog.gceasy.io/2022/03/04/garbage-collection-tuning-success-story-reducing-young-gen-size/ Large Automobile Manufacturer Improves Response Time https://blog.gceasy.io/2022/03/04/garbage-collection-tuning-success-story-reducing-young-gen-size/ CloudBees (Jenkins Parent company) optimizes https://blog.gceasy.io/2019/08/01/cloudbees-gc-performance-optimized-with-gceasy/ Oracle optimizes App performance by tuning GC https://blog.gceasy.io/2022/12/06/oracle-architect-optimizes-performance-using-gceasy/
  • 14.
    14 Large SaaS companyCEO’s tweet
  • 15.
    15 How to tuneGC performance? Free Video: https://www.youtube.com/watch?v=6G0E4O5yxks Online Training: https://ycrash.io/java-performance-training
  • 16.
  • 17.
    Application Architecture JDBC SOAP MainFrame REST Server ThreadPool Application Server HTTP(S) request 17
  • 18.
    Application Architecture JDBC SOAP MainFrame REST Server ThreadPool Application Server HTTP(S) request 18
  • 19.
    1. GC Log 10.netstat 12. vmstat 2. Thread Dump 9. dmesg 3. Heap Dump (optional) 6. ps 8. Disk Usage 5. top 13. iostat 11. ping 14. Kernel Params 15. App Logs 16. metadata 4. Heap Substitute 7. top -H 19 Open-source script: https://github.com/ycrash/yc-data-script 360° Troubleshooting artifacts
  • 20.
    1 2 3 1 Timestampat which thread dump was triggered 2 JVM Version info 3 Thread Details - <<details in following slides>> 20
  • 21.
    1 2 34 5 6 7 1 Thread Name - InvoiceThread-A996 2 Priority - Can have values from 1 to 10 3 Thread Id - 0x00002b7cfc6fb000 – Unique ID assigned by JVM. It's returned by calling the Thread.getId() method. 4 Native Id - 0x4479 - This ID is highly platform dependent. On Linux, it's the pid of the thread. On Windows, it's simply the OS-level thread ID with a process. On Mac OS X, it is said to be the native pthread_t value. 5 Address space - 0x00002b7d17ab8000 - 6 Thread State - RUNNABLE 7 Stack trace - 21
  • 22.
    How to analyzeThread dump? https://www.ibm.com/support/pages /ibm-thread-and-monitor-dump- analyzer-java-tmda IBM TDMA FastThread https://fastthread.io/ 03 02 https://tinyurl.com/wq95weo Sample thread report yCrash https://ycrash.io/ 01 22
  • 23.
    23 Case Study Backend Slowdownin a Major Financial Institution in N. America Analysis Report: https://fastthread.io/my-thread-report.jsp?p=c2hhcmVkLzIwMjIvMDcvMzEvdGhyZWFkX2thc3RsZV8yNjA3MjIudHh0LS03LTMwLTMzLS0xNi0zMy0zNg==&&s=t What’s typically reported in APM? AWS Cloud watch + yCrash = Monitoring + RCA – yCrash
  • 24.
  • 25.
    25 Memory Leak Program OpenSource app to simulate Performance Problems BuggyApp
  • 26.
    MemoryLeakDemo Object1 Object2 MapManager Key1 Large String…1 Key2Large String…2 key3 Large String…3 : : KeyN Large String…N myMap
  • 27.
    27 Memory of HealthyApplication - Full Garbage Collection Event
  • 28.
    28 Acute Memory Leak -Full Garbage Collection Event
  • 29.
    29 Memory Leak - FullGarbage Collection Event
  • 30.
    1. GC Log 10.netstat 12. vmstat 2. Thread Dump 9. dmesg 3. Heap Dump 6. ps 8. Disk Usage 5. top 13. iostat 11. ping 14. Kernel Params 15. App Logs 16. metadata 4. Heap Substitute 7. top -H 30 Open-source script: https://github.com/ycrash/yc-data-script 360° Troubleshooting artifacts
  • 31.
    How to analyzeHeap dump? jhat (oracle.com) Jhat Eclipse MAT https://www.eclipse.org/mat HeapHero https://heaphero.io/ 04 03 02 https://tinyurl.com/5sxz7dsr Sample heap report yCrash https://ycrash.io/ 01 31
  • 32.
  • 33.
    top –H –p<PROCESS_ID>’ Secrete Option: 33 We might have used ‘top’
  • 34.
    1. GC Log 10.netstat 12. vmstat 2. Thread Dump 9. dmesg 3. Heap Dump 6. ps 8. Disk Usage 5. top 13. iostat 11. ping 14. Kernel Params 15. App Logs 16. metadata 4. Heap Substitute 7. top -H 34 Open-source script: https://github.com/ycrash/yc-data-script 360° Troubleshooting artifacts
  • 35.
    Case Study Major Tradingapp in N. America https://blog.fastthread.io/2020/04/23/troubleshooting-cpu-spike-in-a-major-trading-application/ 35
  • 36.
  • 37.
    public void synchronizedgetData() { doSomething(); } Thread 1 Thread 2 Thread 1 BLOCKED THREADS BLOCKED thread state 37
  • 38.
    1. GC Log 10.netstat 12. vmstat 2. Thread Dump 9. dmesg 3. Heap Dump 6. ps 8. Disk Usage 5. top 13. iostat 11. ping 14. Kernel Params 15. App Logs 16. metadata 4. Heap Substitute 7. top -H 38 Open-source script: https://github.com/ycrash/yc-data-script 360° Troubleshooting artifacts
  • 39.
    Case Study Major LeisureTravel Service Provider https://blog.ycrash.io/2022/03/09/java-uuid-generation-performance-impact/ 39
  • 40.
    Deadlock Open-Source apache library AnalysisReport: Deadlock in Apache pdfbox library - yCrash Answers Deadlock Pattern
  • 41.
  • 42.
    Case Study Intermittent HTTP502 errors in AWS EBS Service 42
  • 43.
  • 44.
  • 45.
    1. GC Log 10.netstat 12. vmstat 2. Thread Dump 9. dmesg 3. Heap Dump 6. ps 8. Disk Usage 5. top 13. iostat 11. ping 14. Kernel Params 15. App Logs 16. metadata 4. Heap Substitute 7. top -H 45 Open-source script: https://github.com/ycrash/yc-data-script 360° Data
  • 46.
  • 47.
    Ram Lakshmanan ram@tier1app.com @tier1apphttps://www.linkedin.com/company/ycrash This deck will be published in: https://blog.heaphero.io If you want to learn more … 47 THANK YOU FRIENDS

Editor's Notes

  • #11 http://localhost:8080/yc-load-report-gc?ou=SAP&de=145.23.82.1&app=yc&ts=2023-06-11T23-03-50 http://localhost:8080/yc-load-report-gc?ou=SAP&de=193.45.89.12&app=yc&ts=2023-06-11T23-09-10
  • #24 http://localhost:8080/yc-report.jsp?ou=SAP&de=189.34.21.56&app=yc&ts=2024-02-27T10-04-26
  • #26 http://localhost:8080/yc-report.jsp?ou=SAP&de=192.168.17.183&app=yc&ts=2023-10-05T07-38-13
  • #27 http://localhost:8080/yc-report.jsp?ou=SAP&de=192.168.17.183&app=yc&ts=2023-10-05T07-38-13
  • #31 http://localhost:8080/yc-load-report-hd?isWCReport=true&ou=SAP&de=192.168.17.183&app=yc&ts=2023-10-05T07-38-13
  • #32 http://localhost:8080/yc-load-report-hd?isWCReport=true&ou=SAP&de=192.168.17.183&app=yc&ts=2023-10-05T07-38-13
  • #36 http://localhost:8080/yc-report.jsp?ou=SAP&de=32.123.89.12&app=yc&ts=2023-06-11T23-54-10
  • #40 http://localhost:8080/yc-report.jsp?ou=SAP&de=90.21.123.19&app=yc&ts=2023-12-03T19-11-33
  • #47 https://test.ycrash.io/yc-report-kernel.jsp?ou=czlWbG0rUko0UXAxazlSbjZrSUIwUT09&de=172.31.7.106&app=yc&ts=2023-09-01T10-25-39