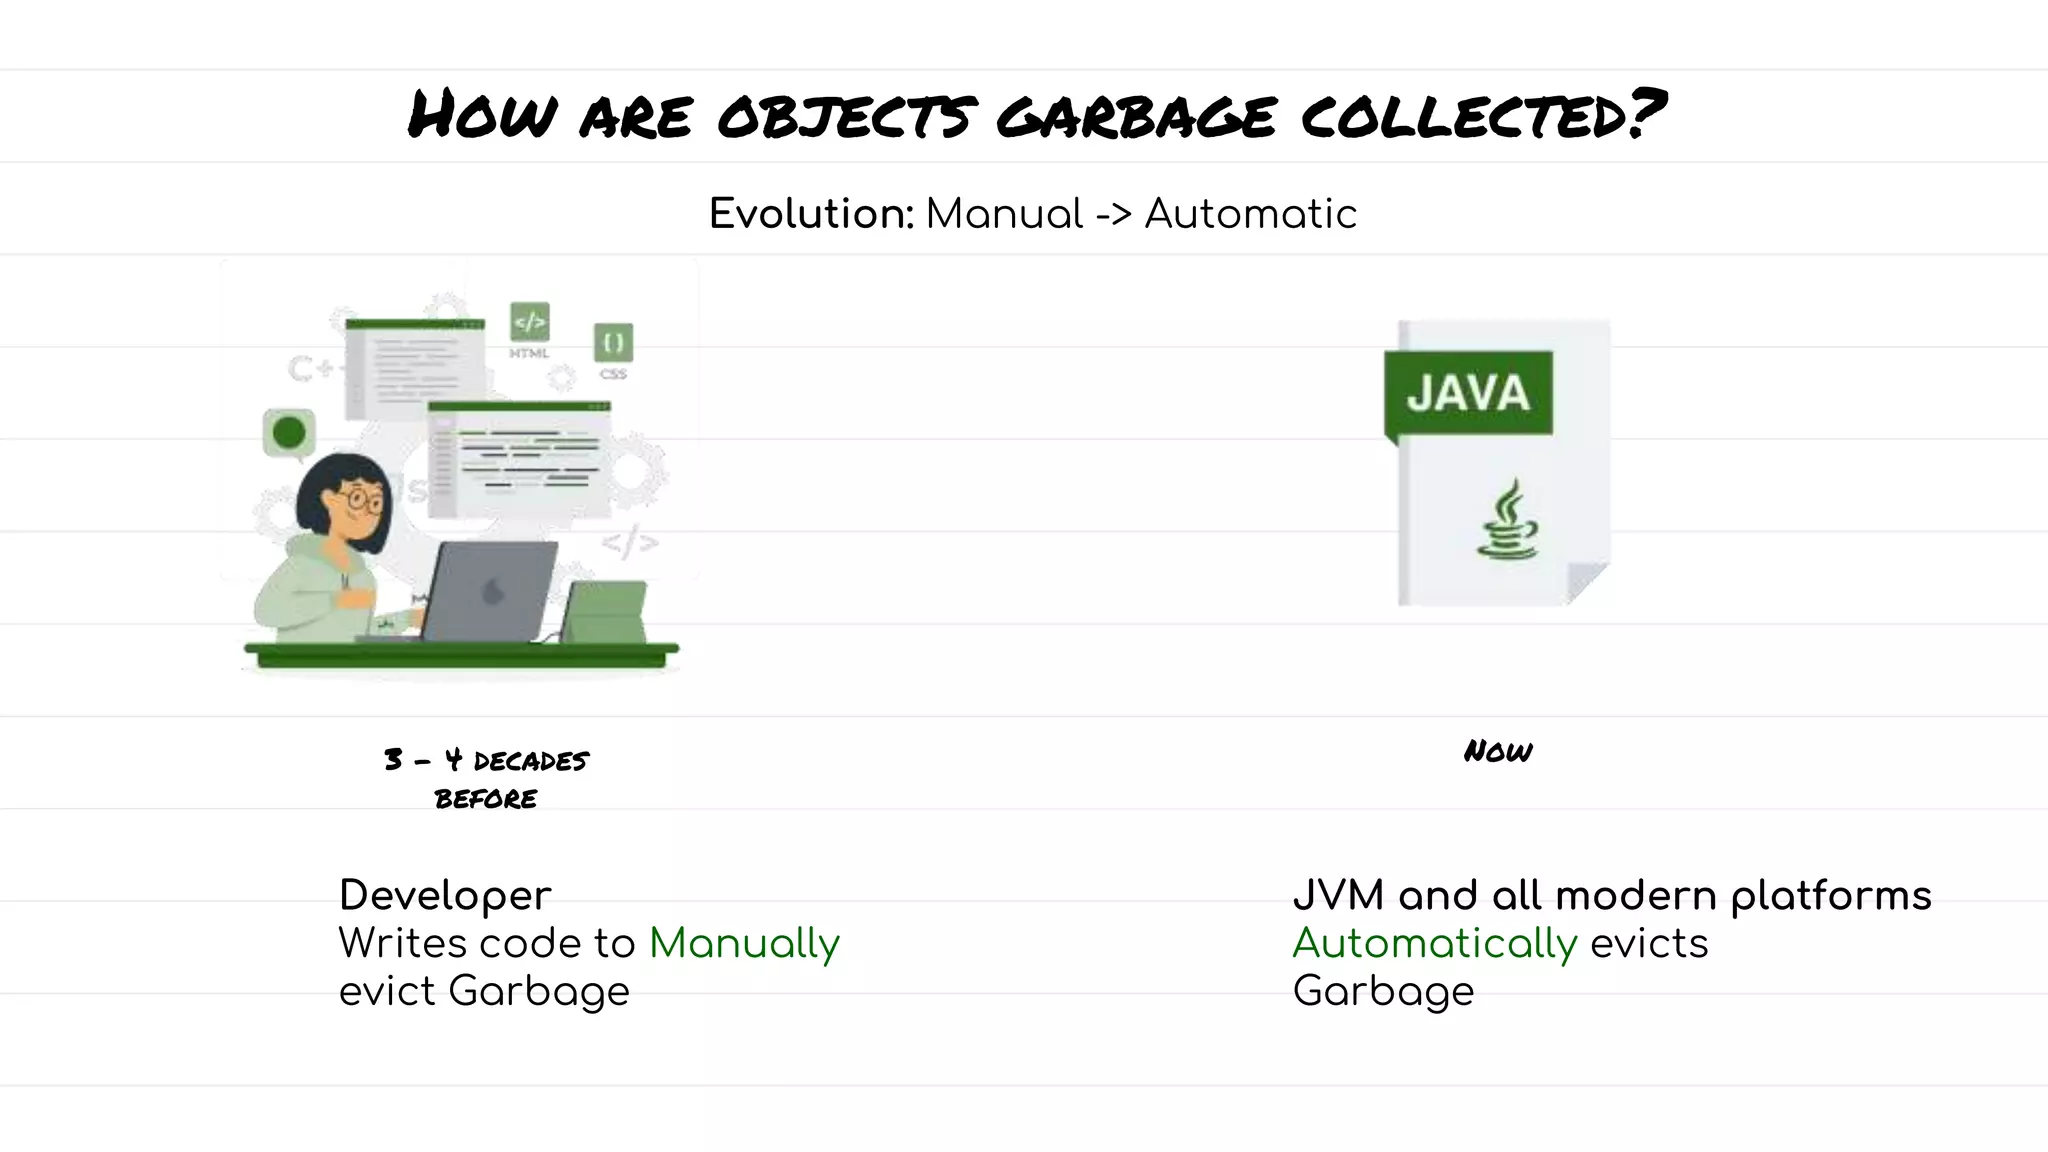
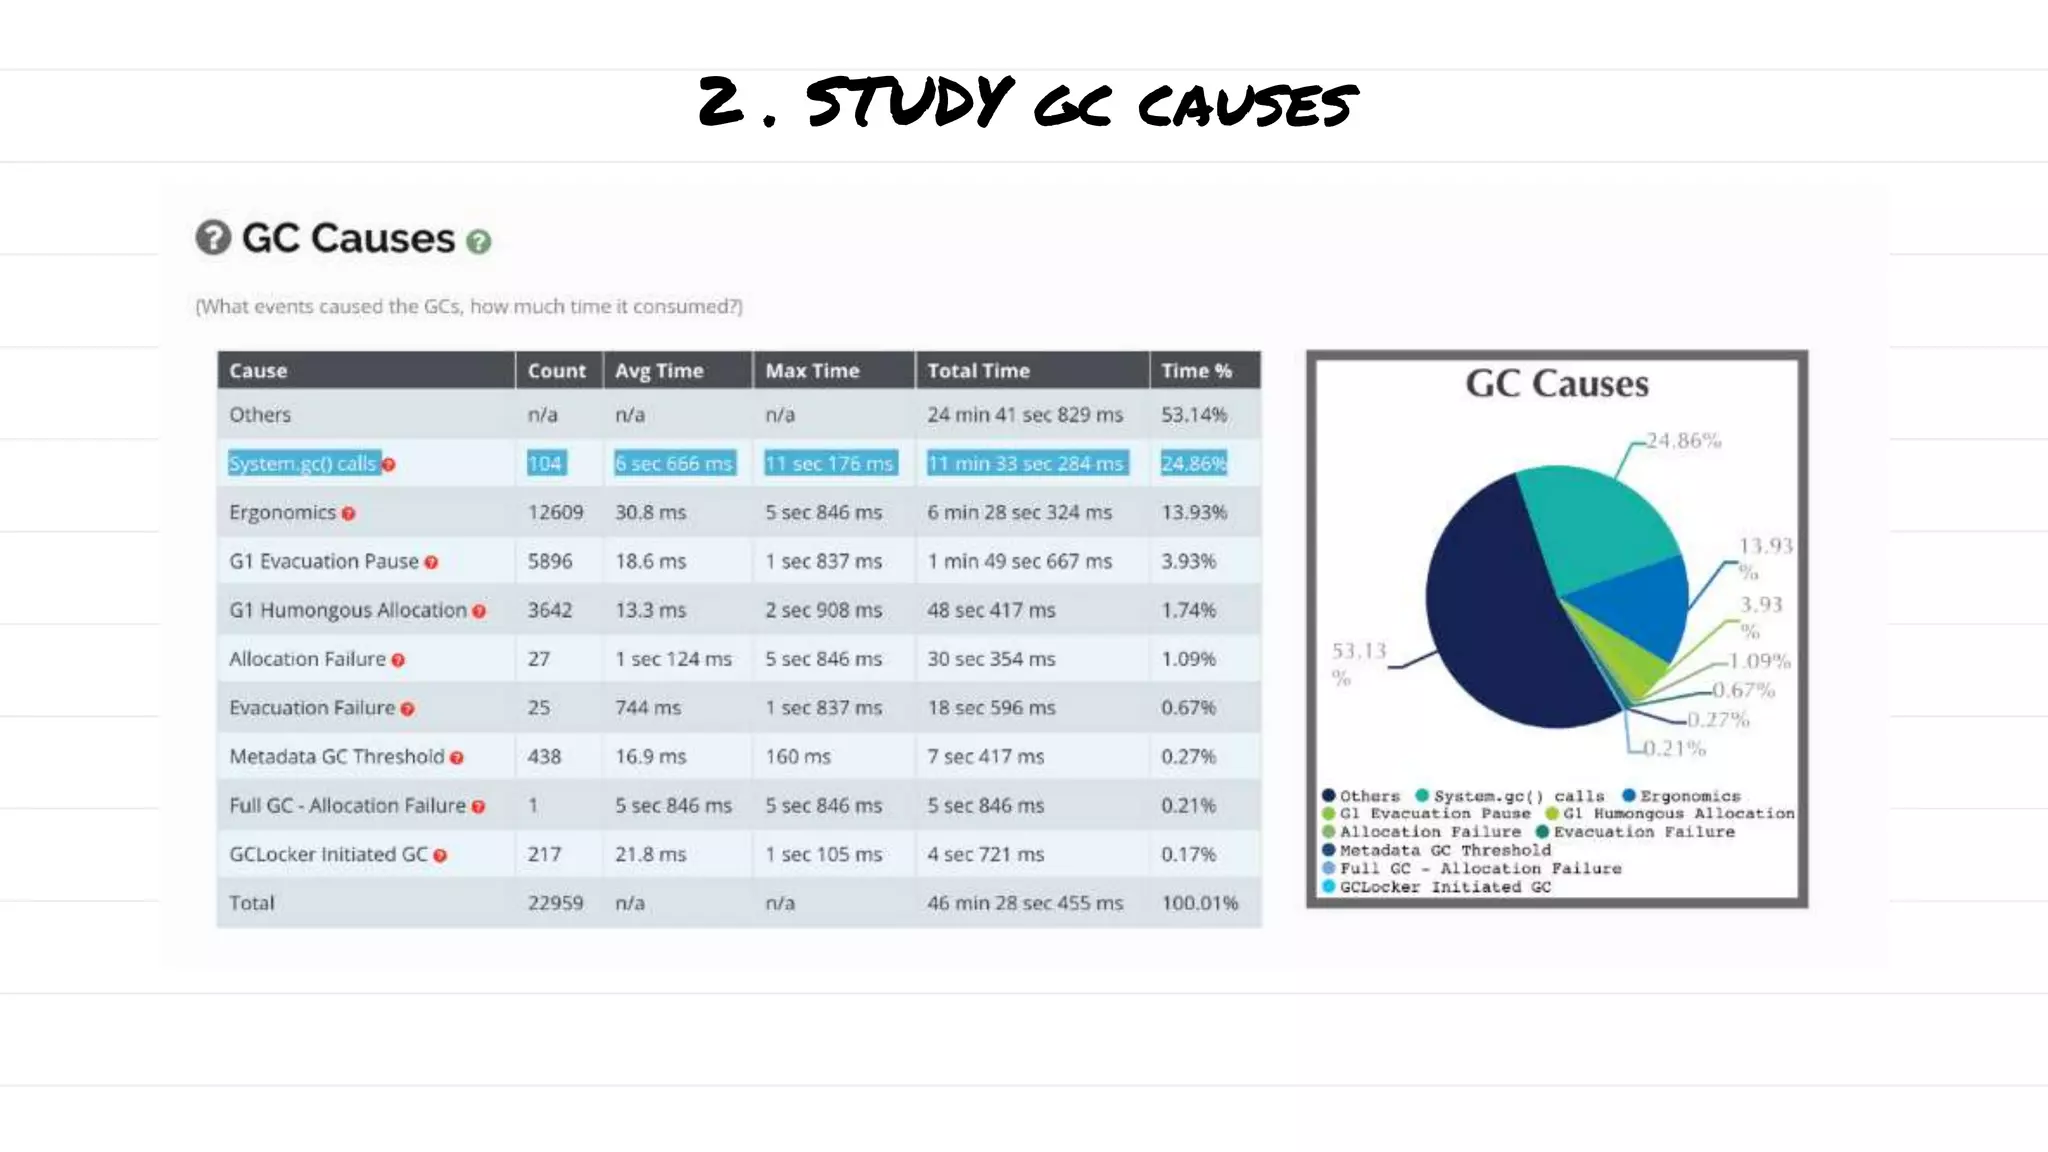
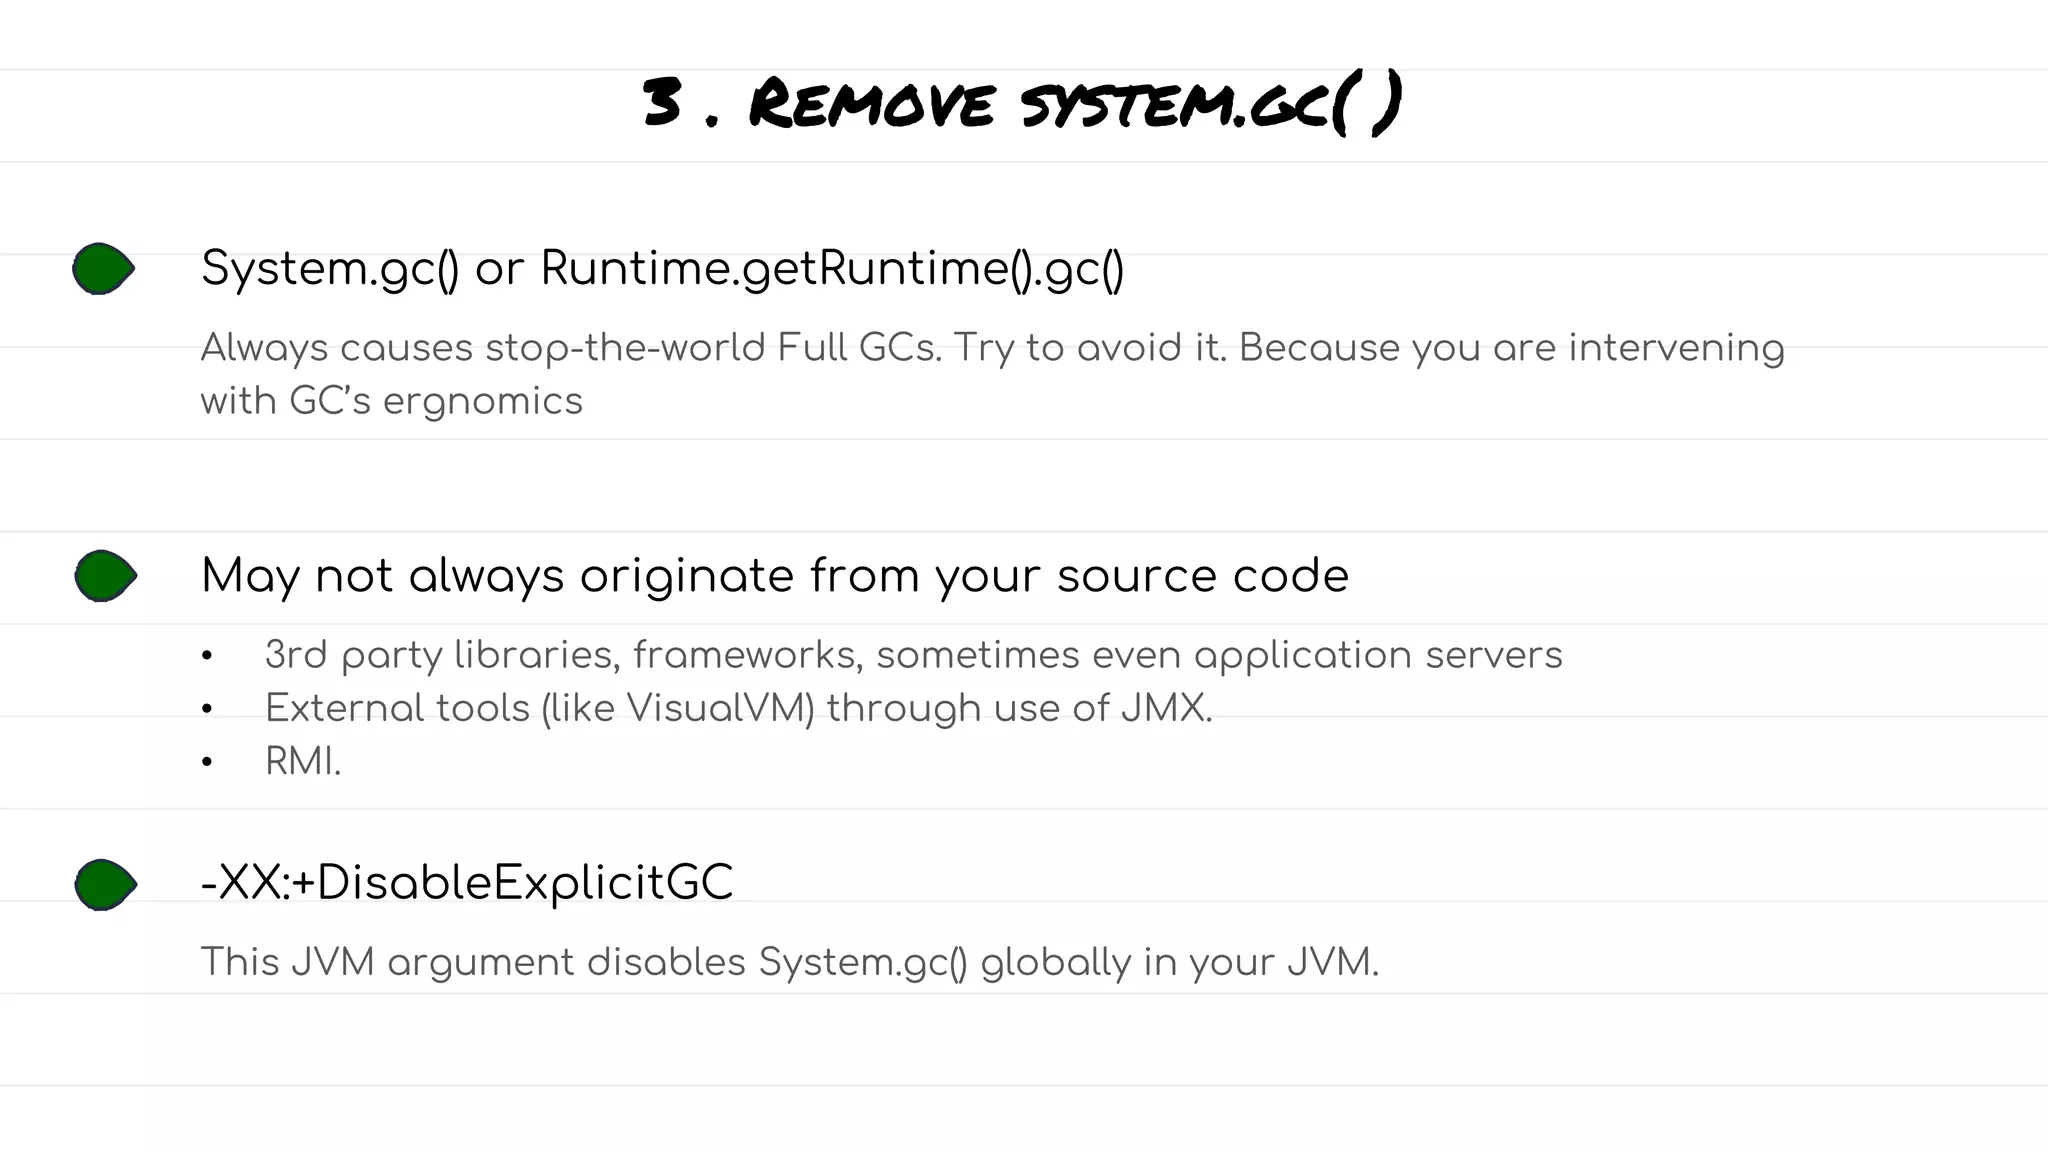
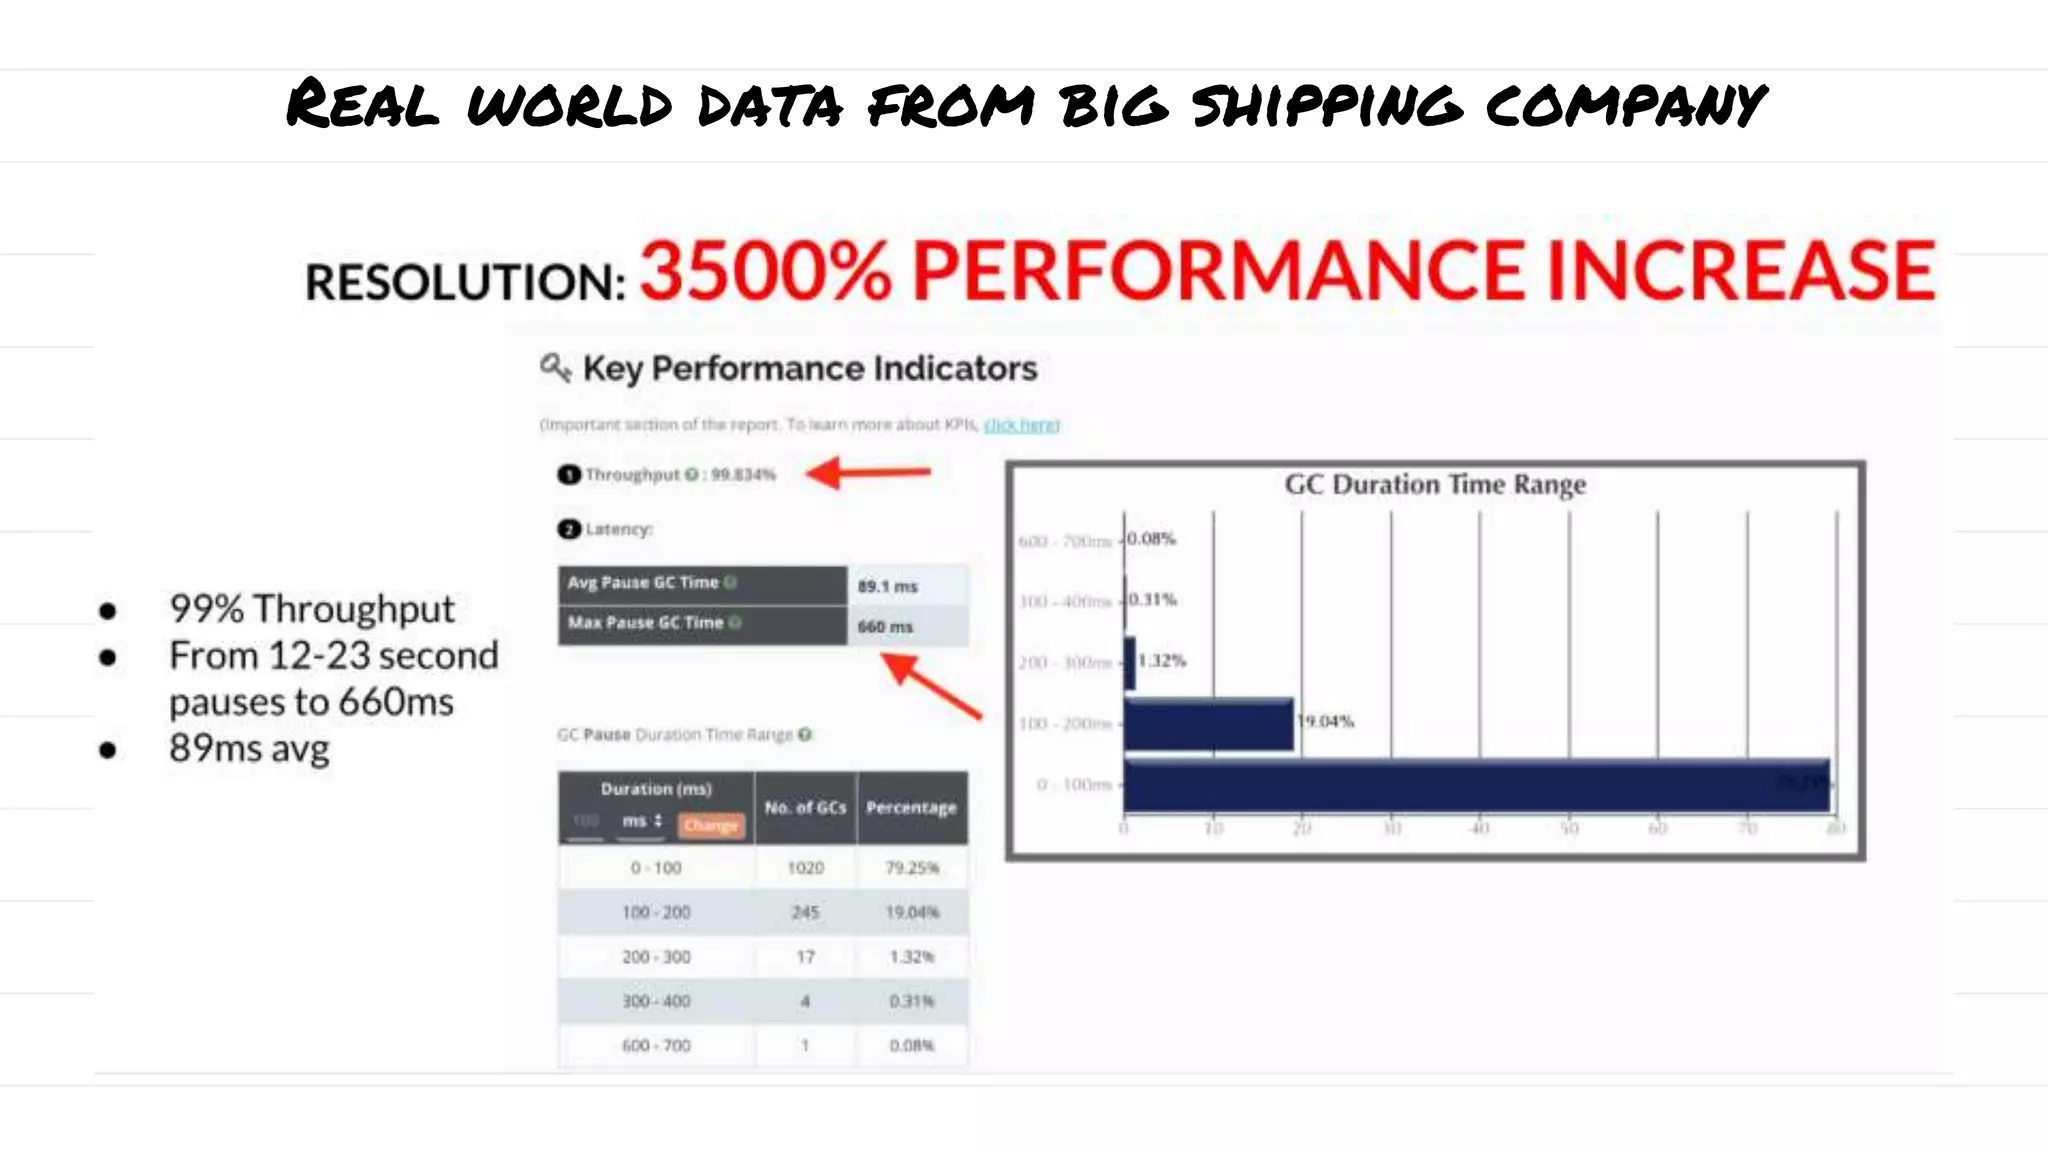
The document discusses the evolution and impact of garbage collection (GC) in application development, highlighting the shift from manual to automatic garbage collection processes. It includes insights on the monetary costs associated with inefficient GC, tips for optimization, and key performance indicators for monitoring GC performance. Additionally, it addresses common pitfalls, such as unnecessary calls to system.gc(), and emphasizes the importance of proper GC configuration to enhance application performance.


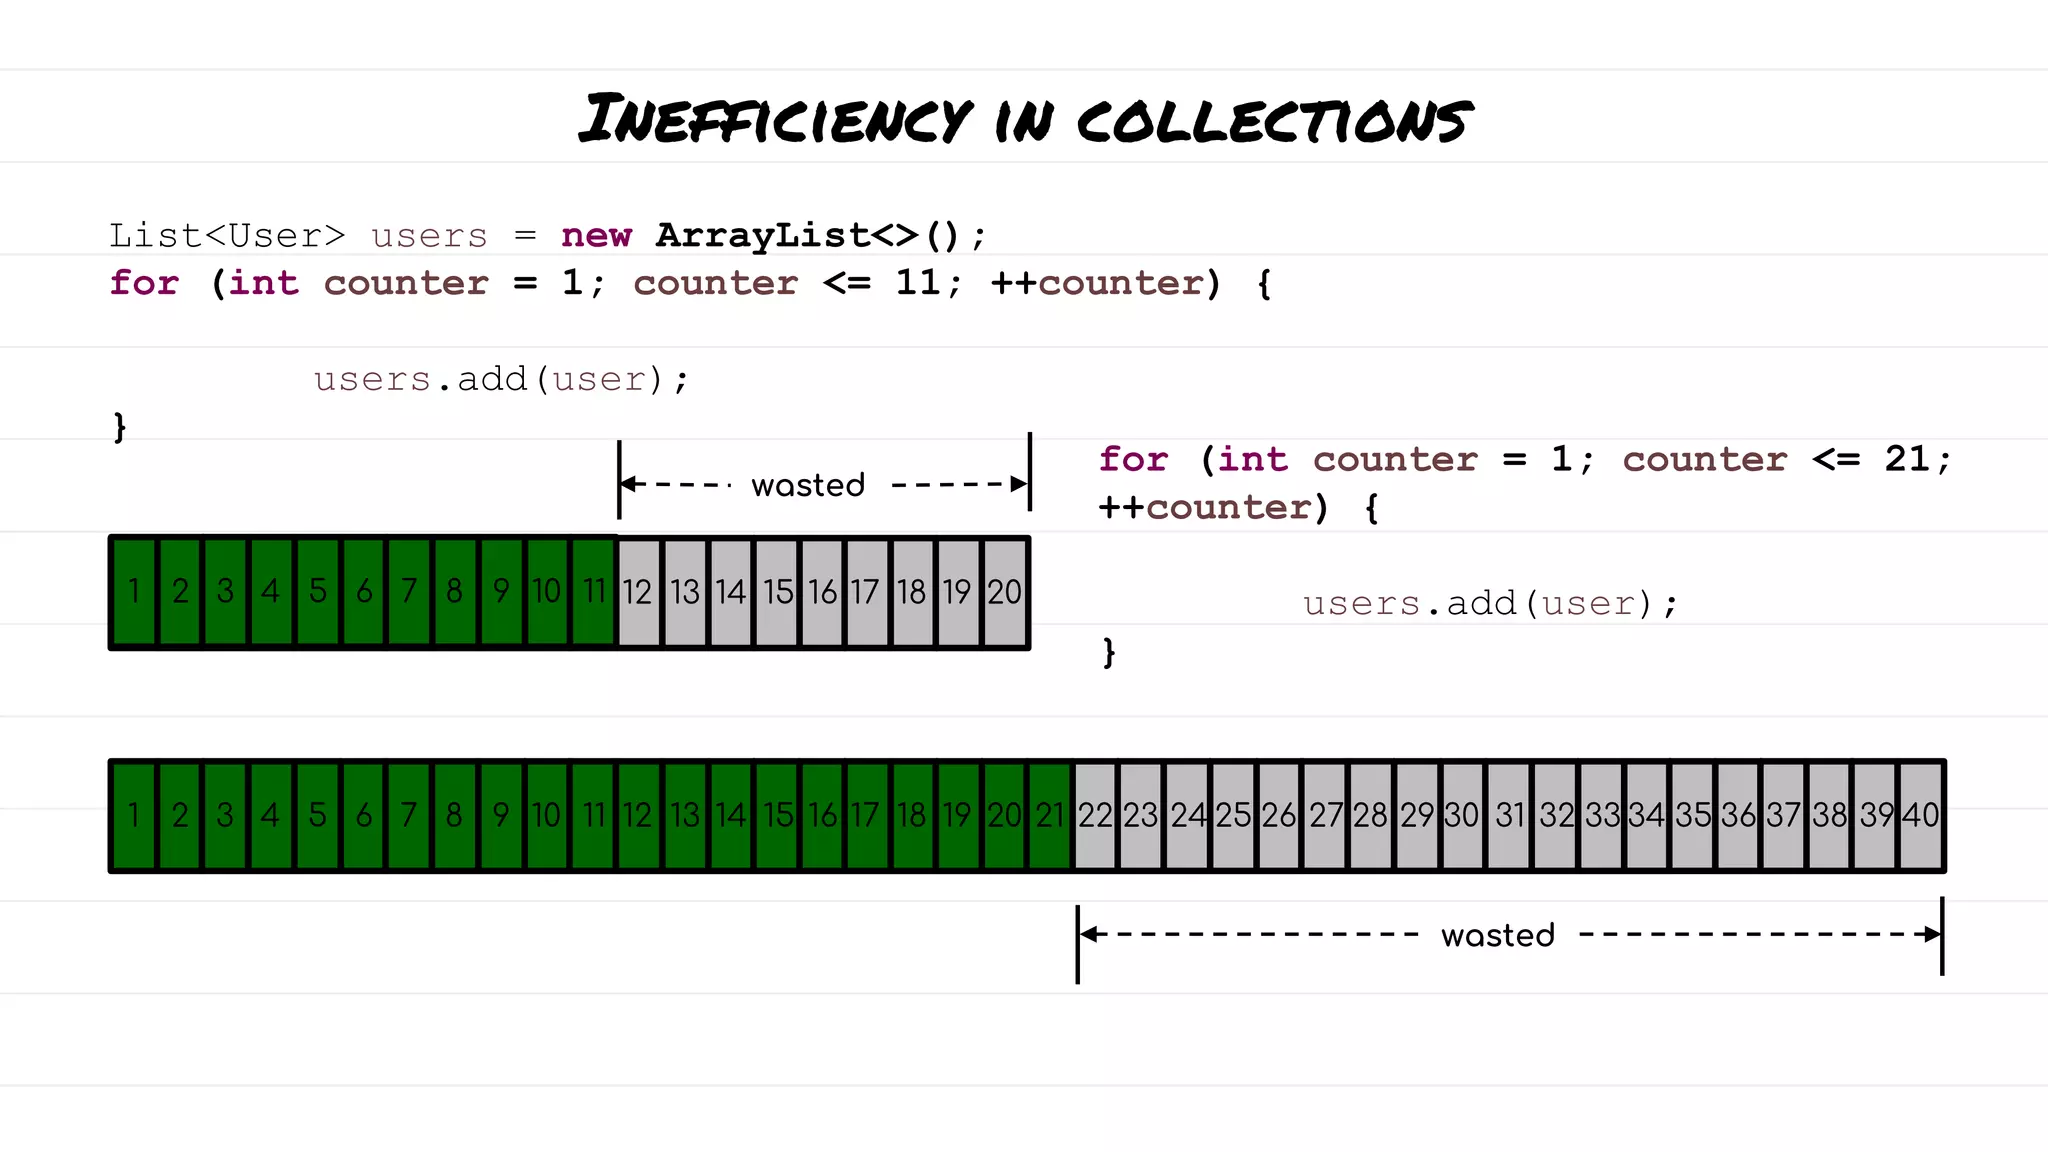
![Inefficiency in collections
List<User> users = new ArrayList<>();
users.add(user);
ArrayList underlyingly maintains
Object[ ]
2 5
4 6 7 8 10
9
3
wasted
1
1
initial capacity = 10](https://image.slidesharecdn.com/this-is-garbage-talk-2022-221107114551-58479421/75/this-is-garbage-talk-2022-pptx-28-2048.jpg)


![[BGOUG] Java GC - Friend or Foe](https://cdn.slidesharecdn.com/ss_thumbnails/javagcfriendorfoe-101125015602-phpapp01-thumbnail.jpg?width=640&height=640&fit=bounds)