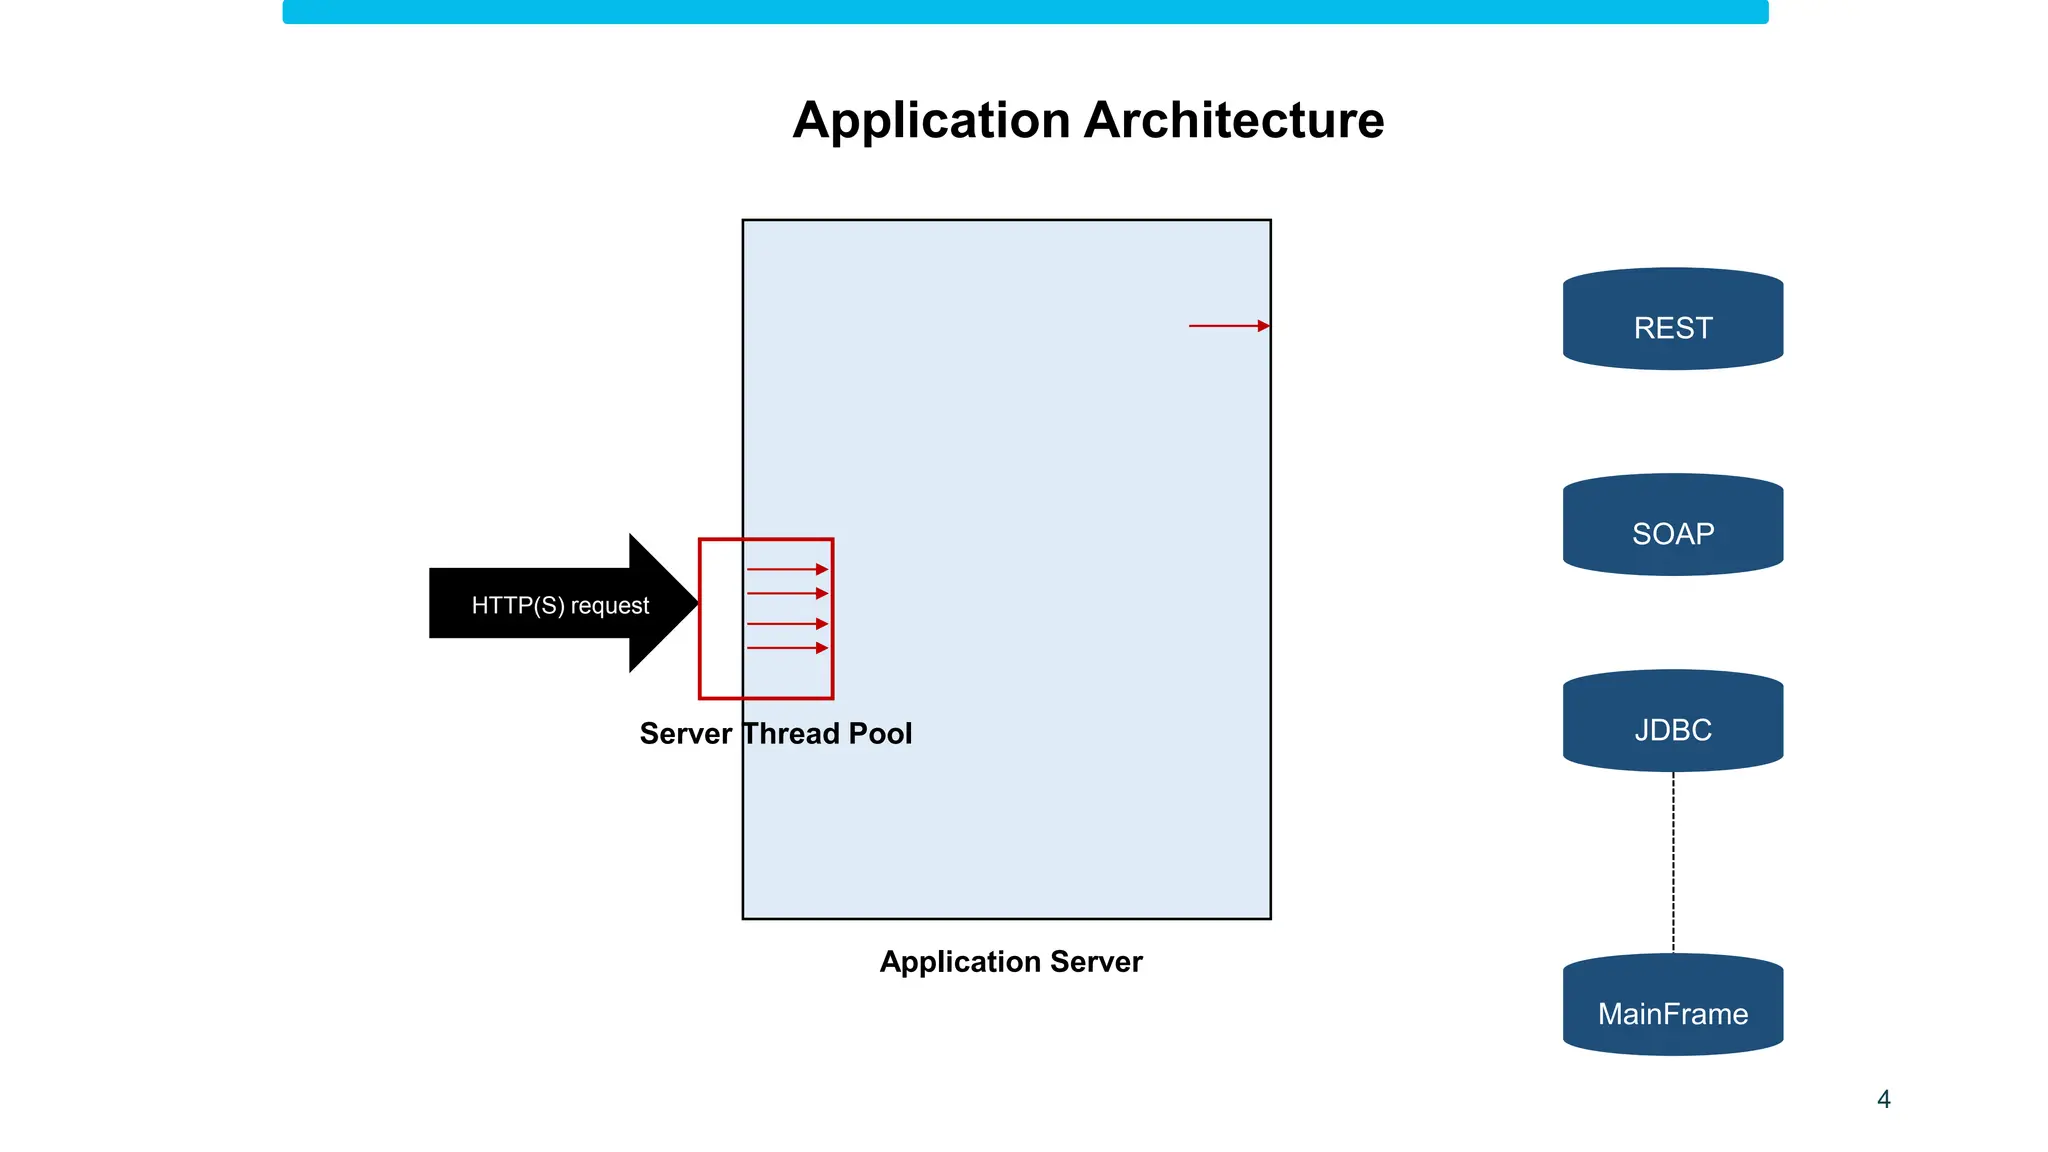
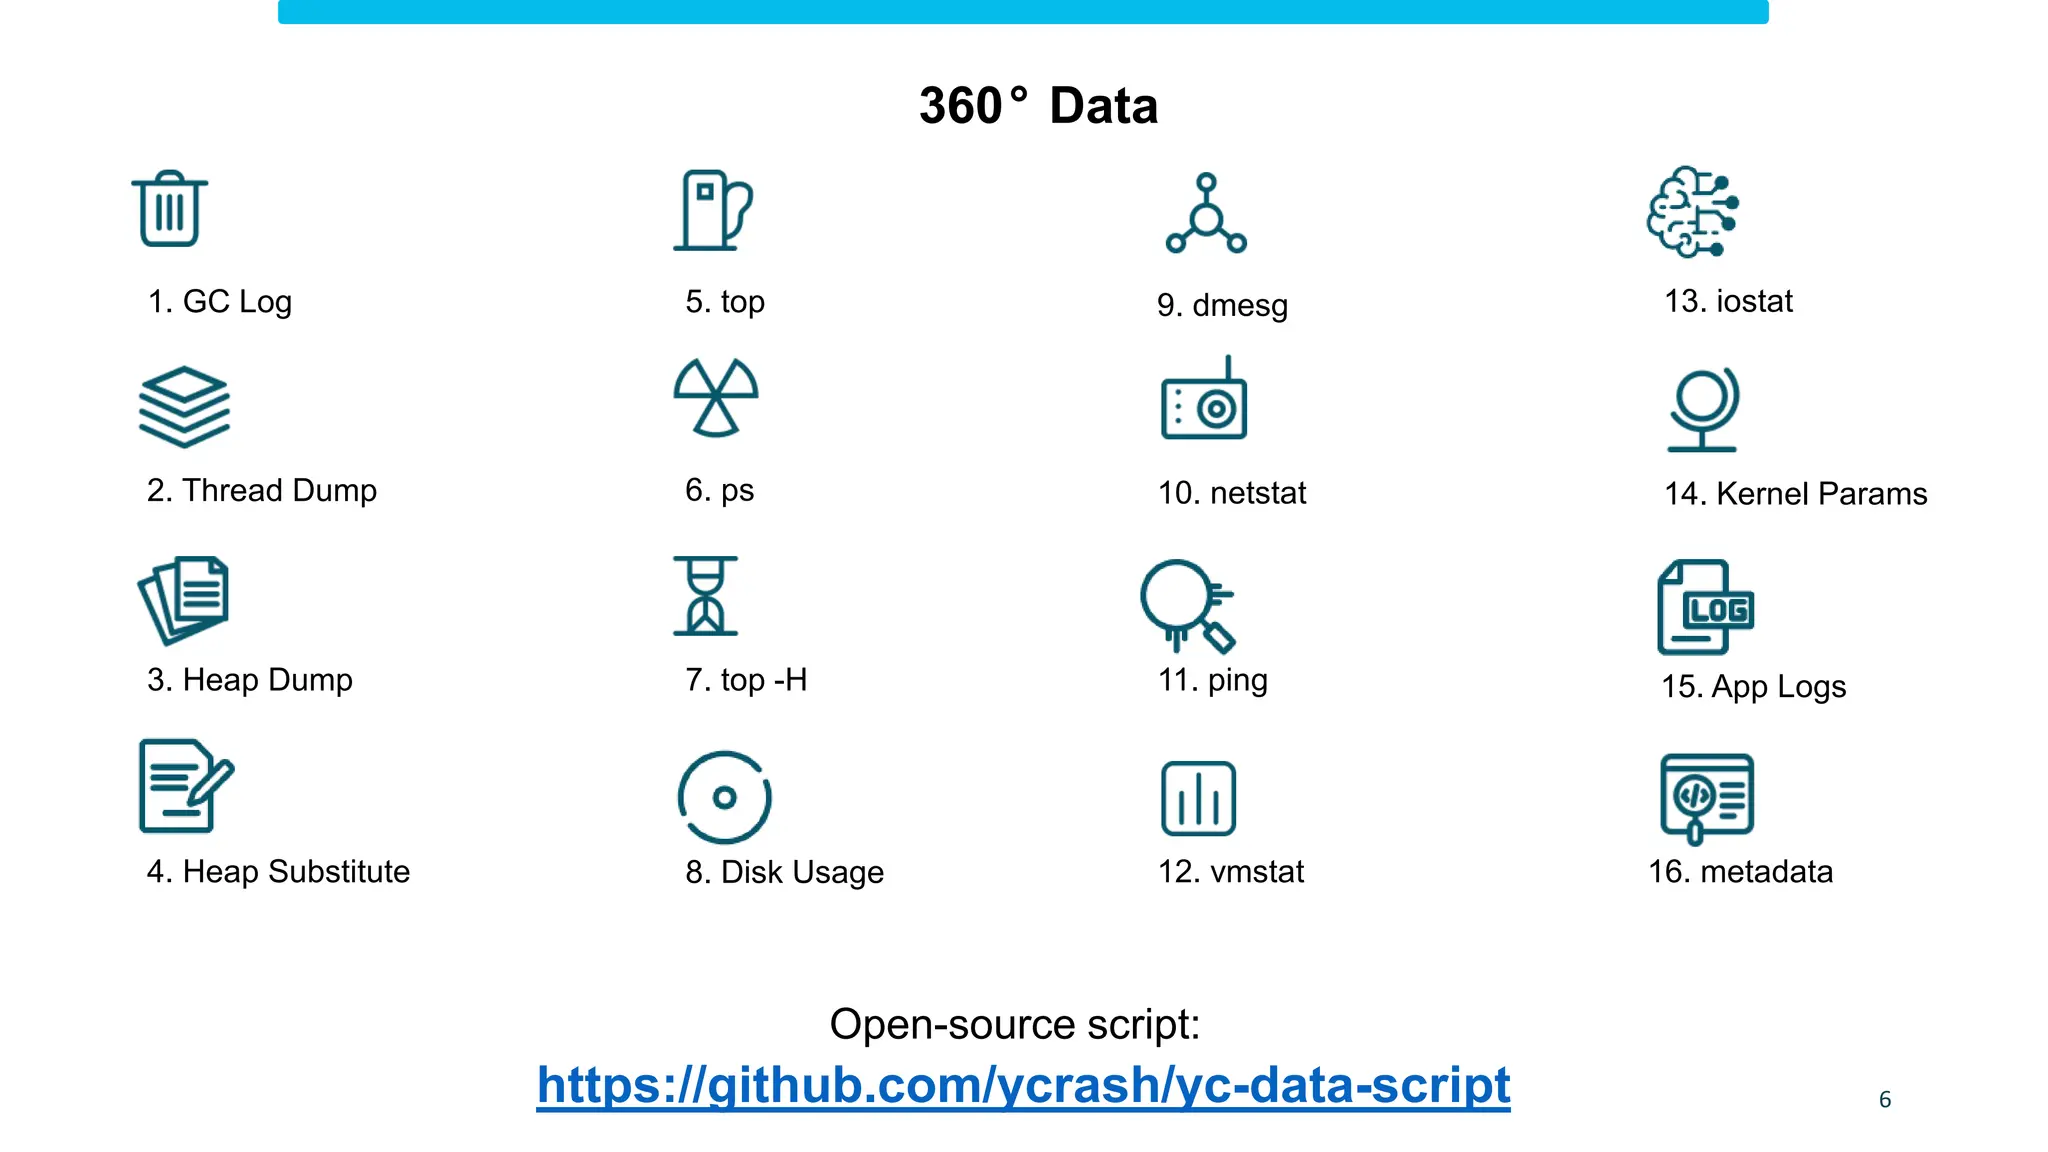
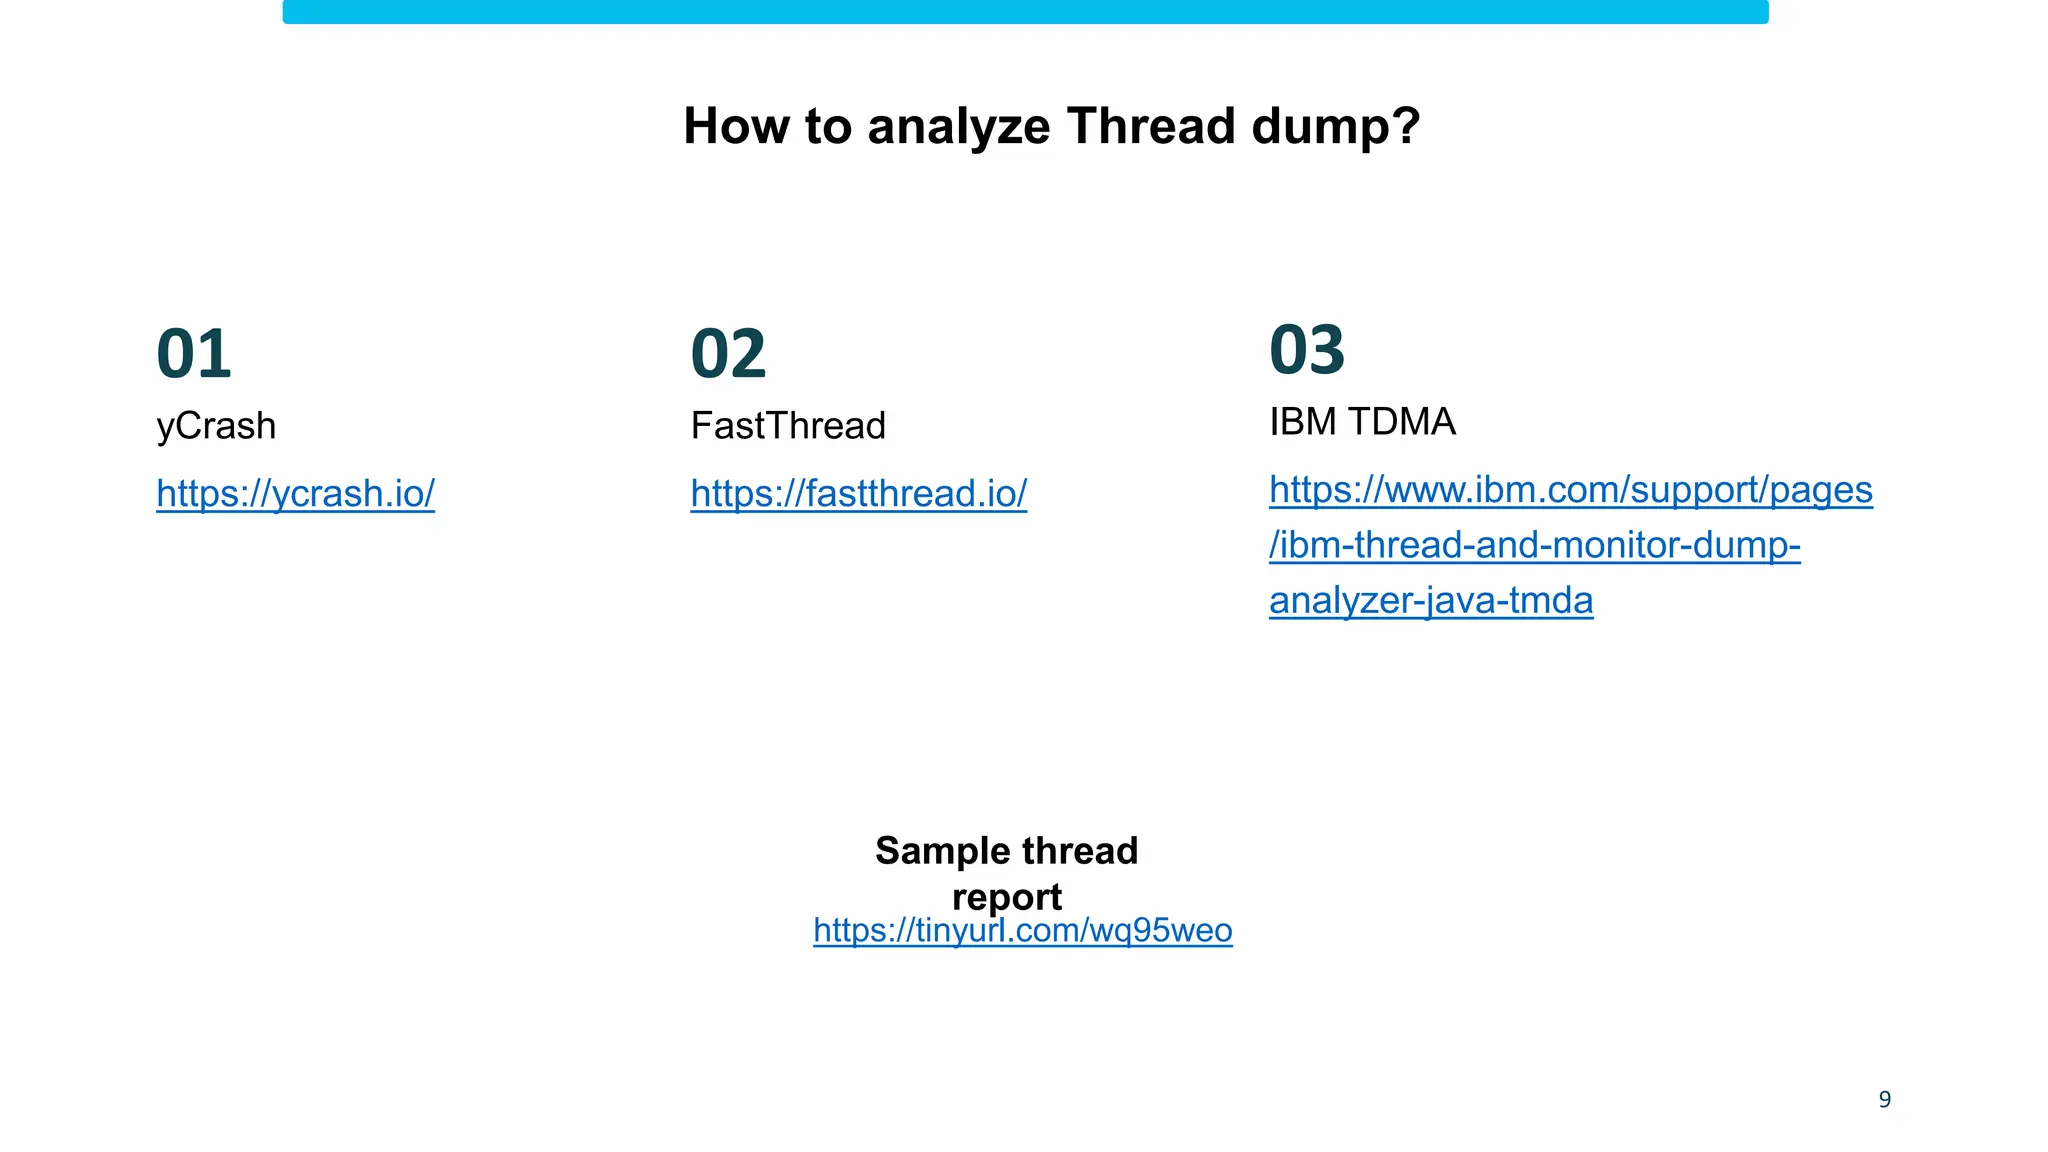
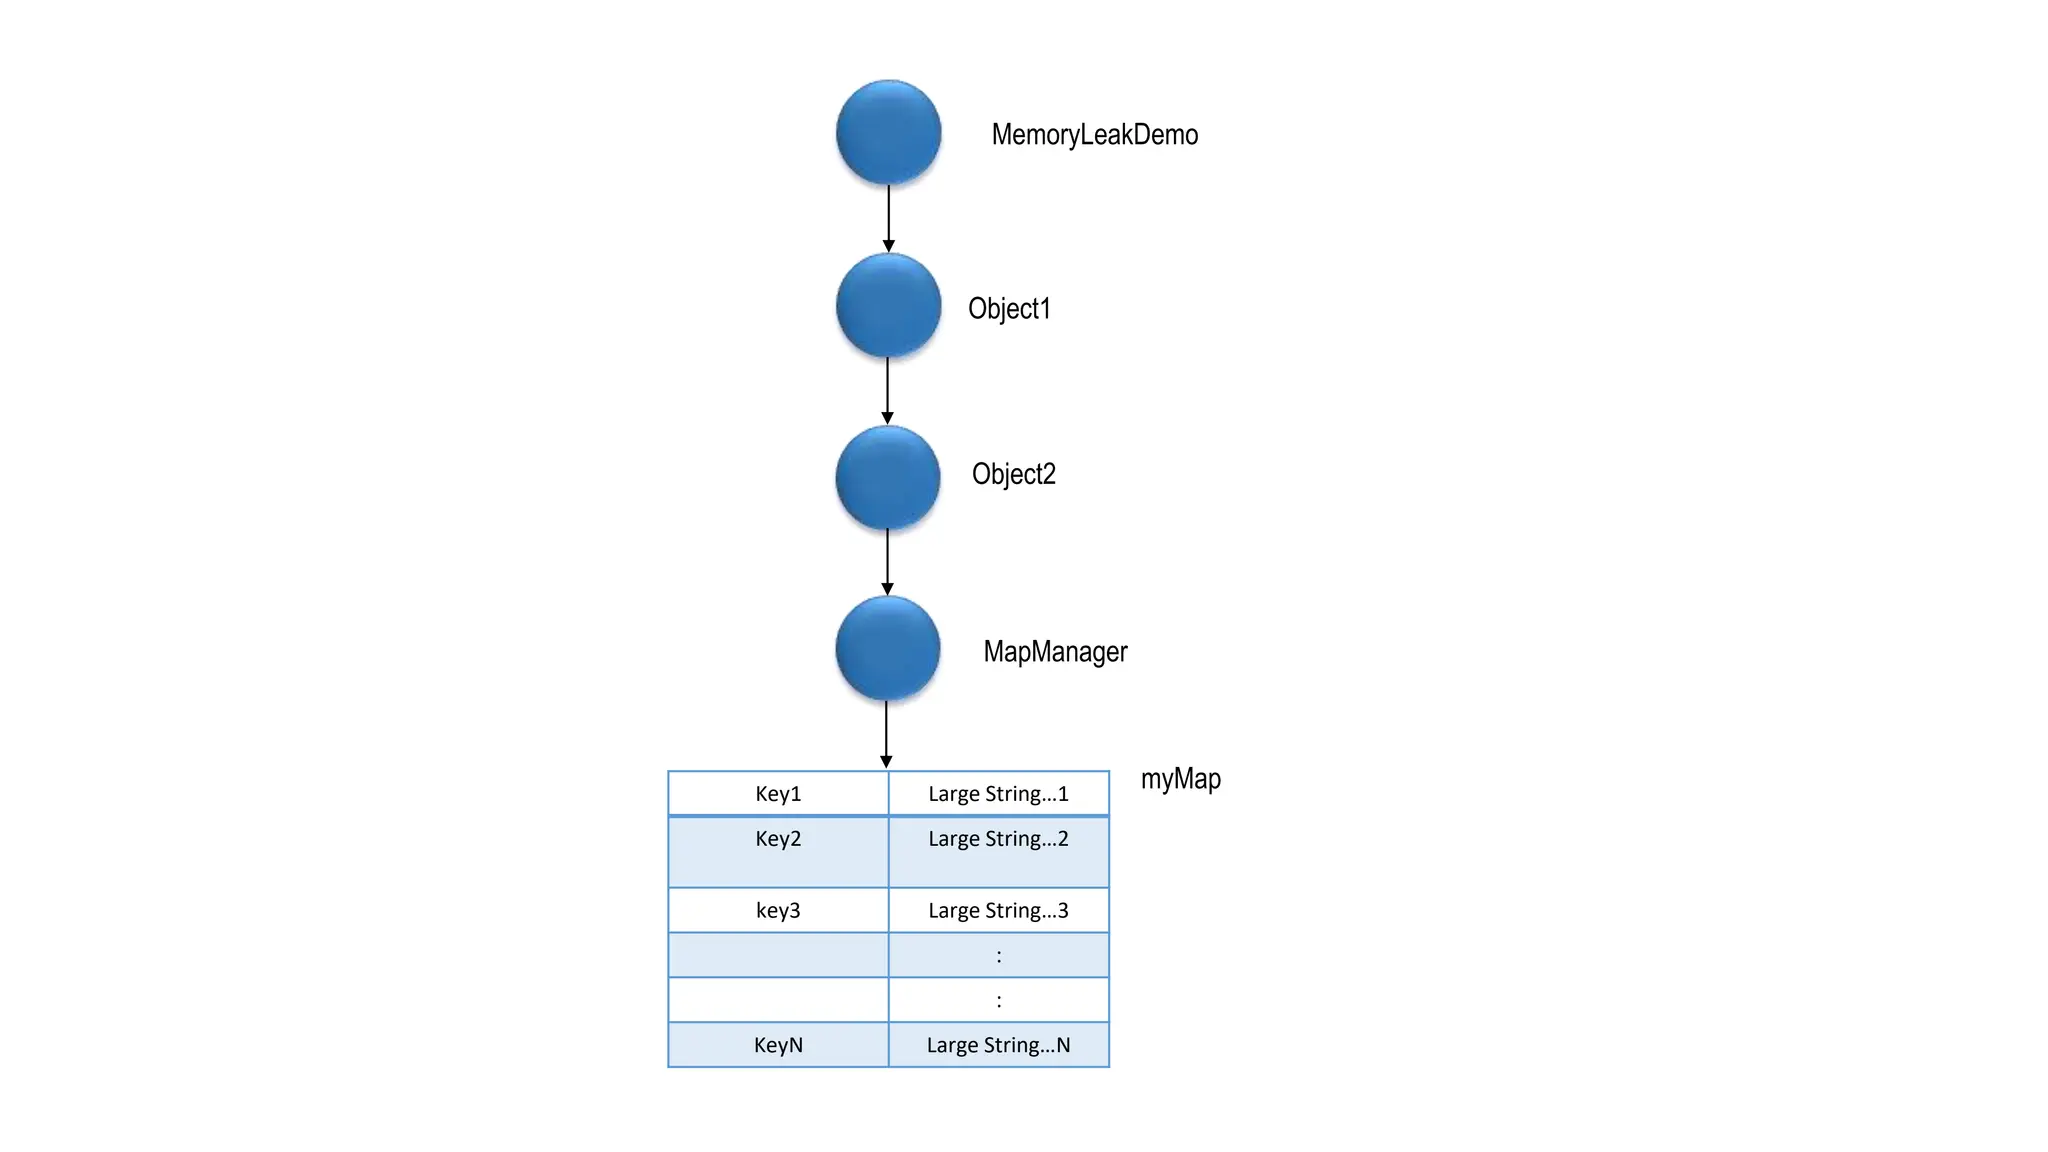
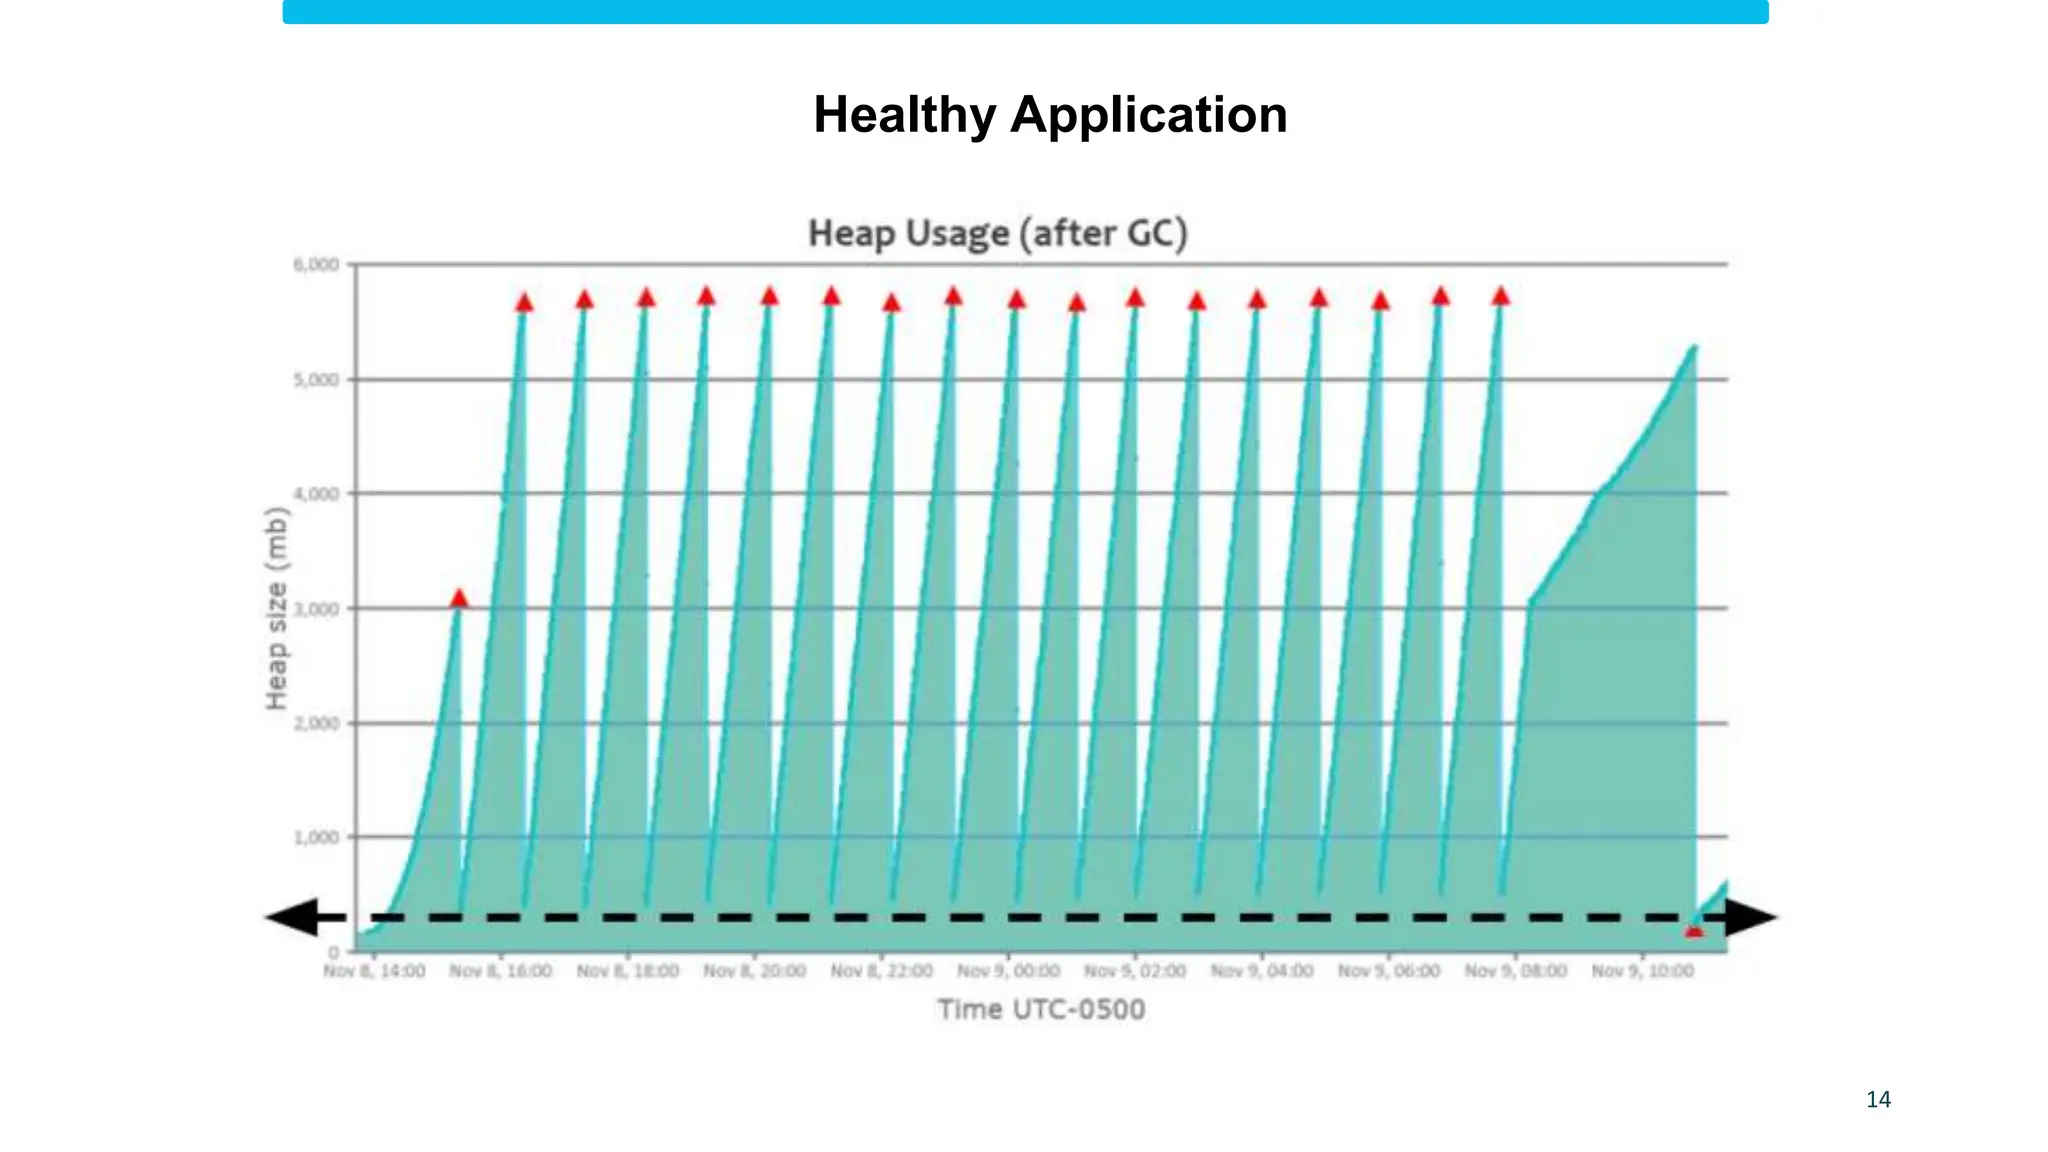
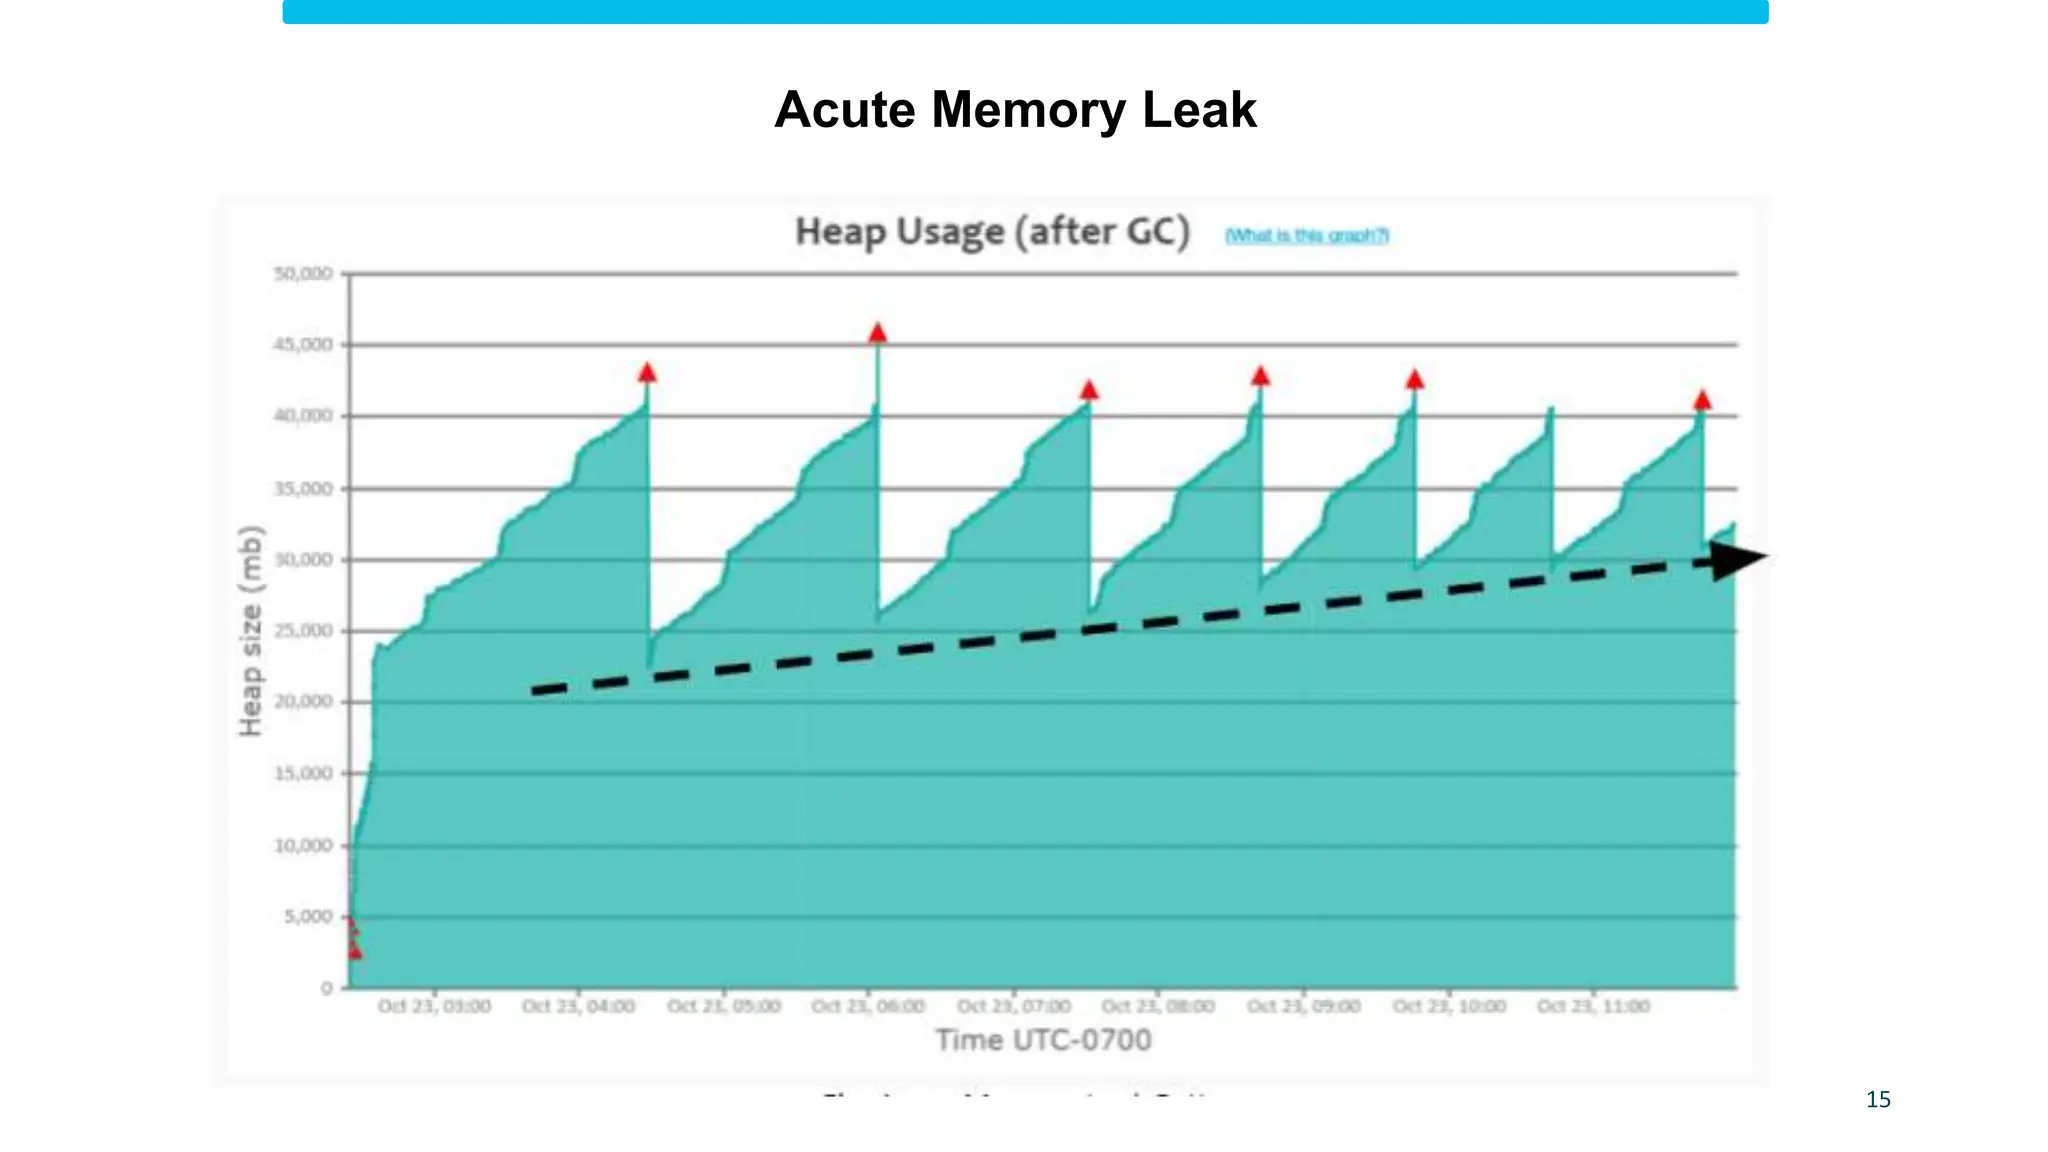
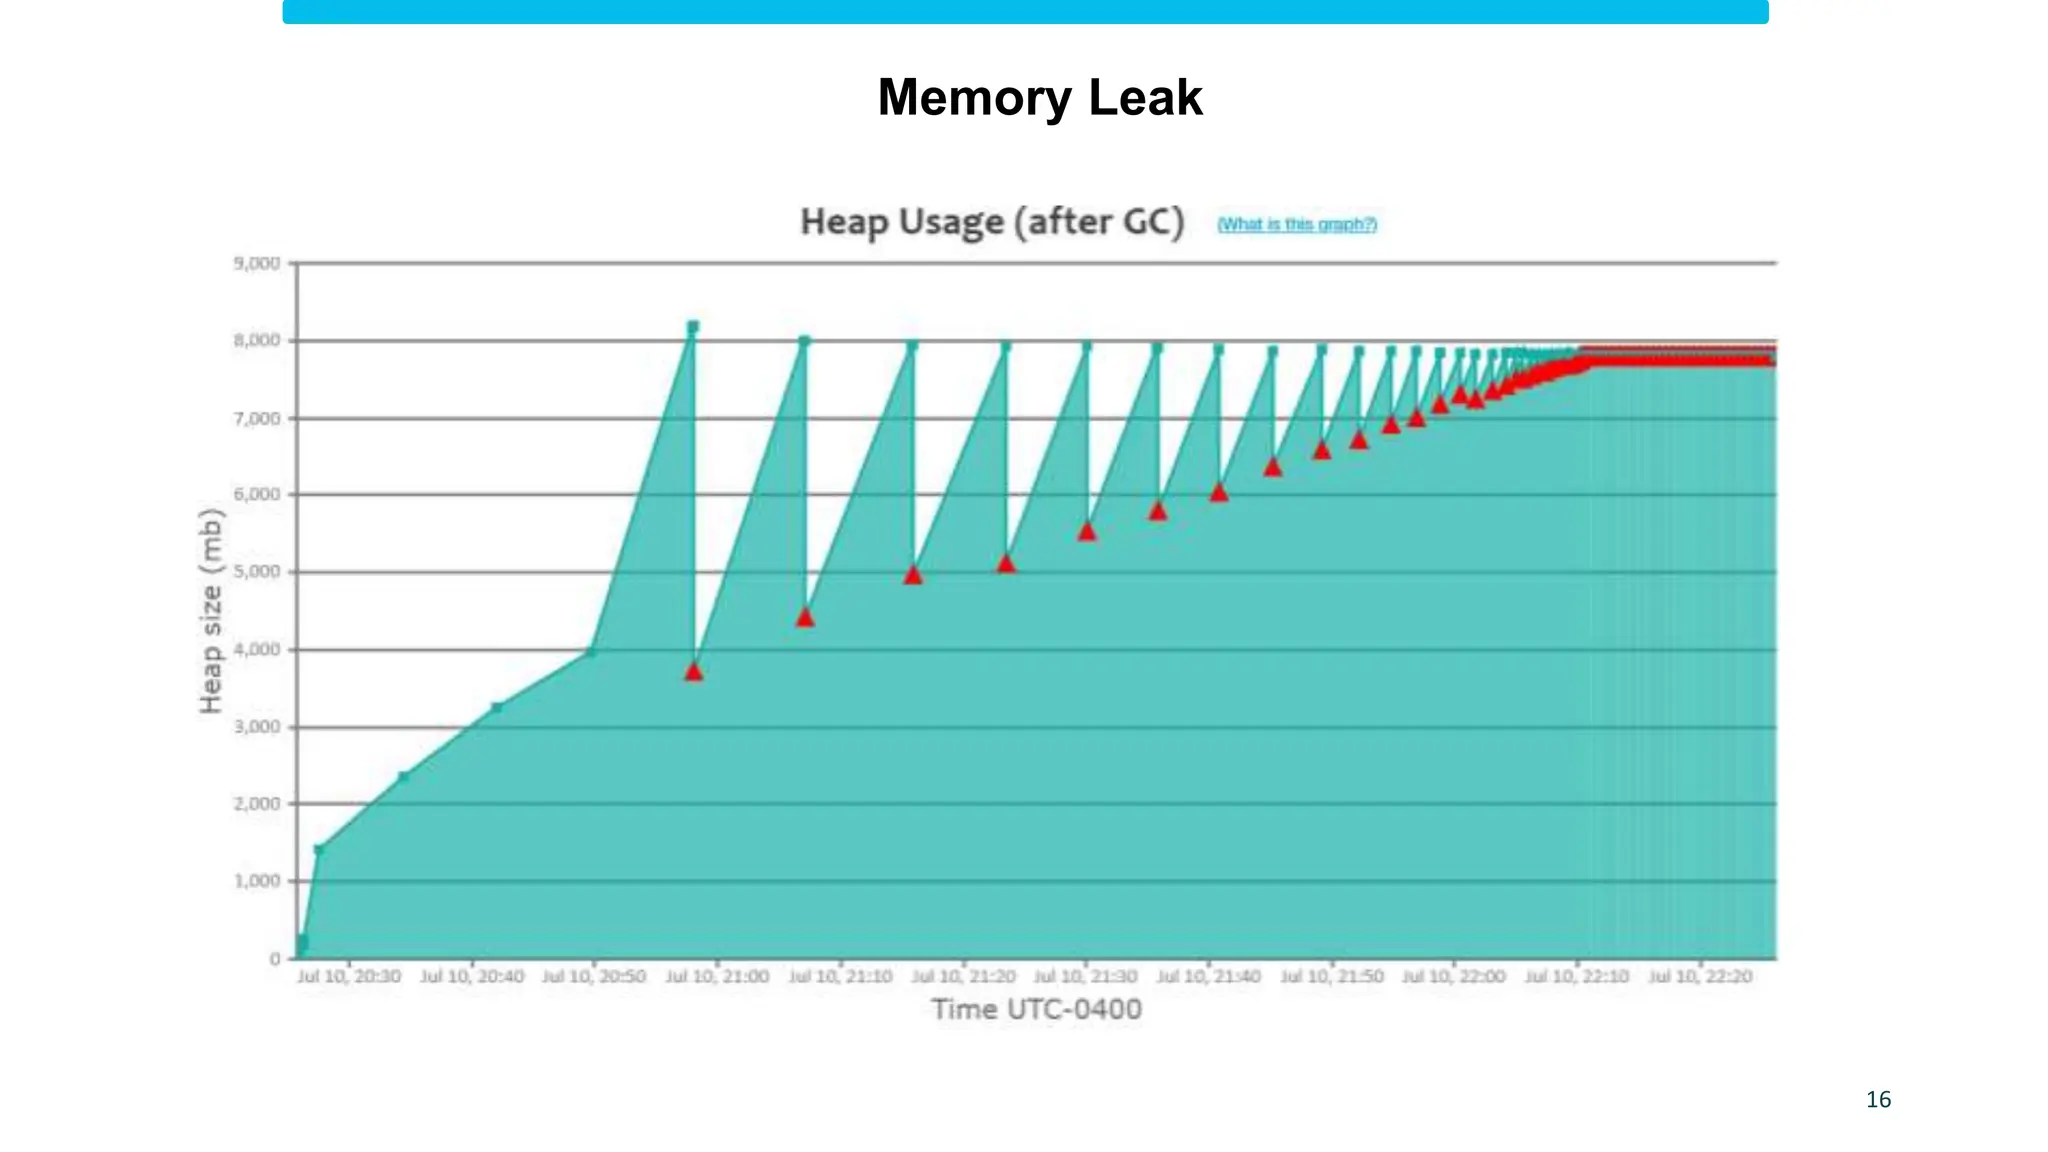
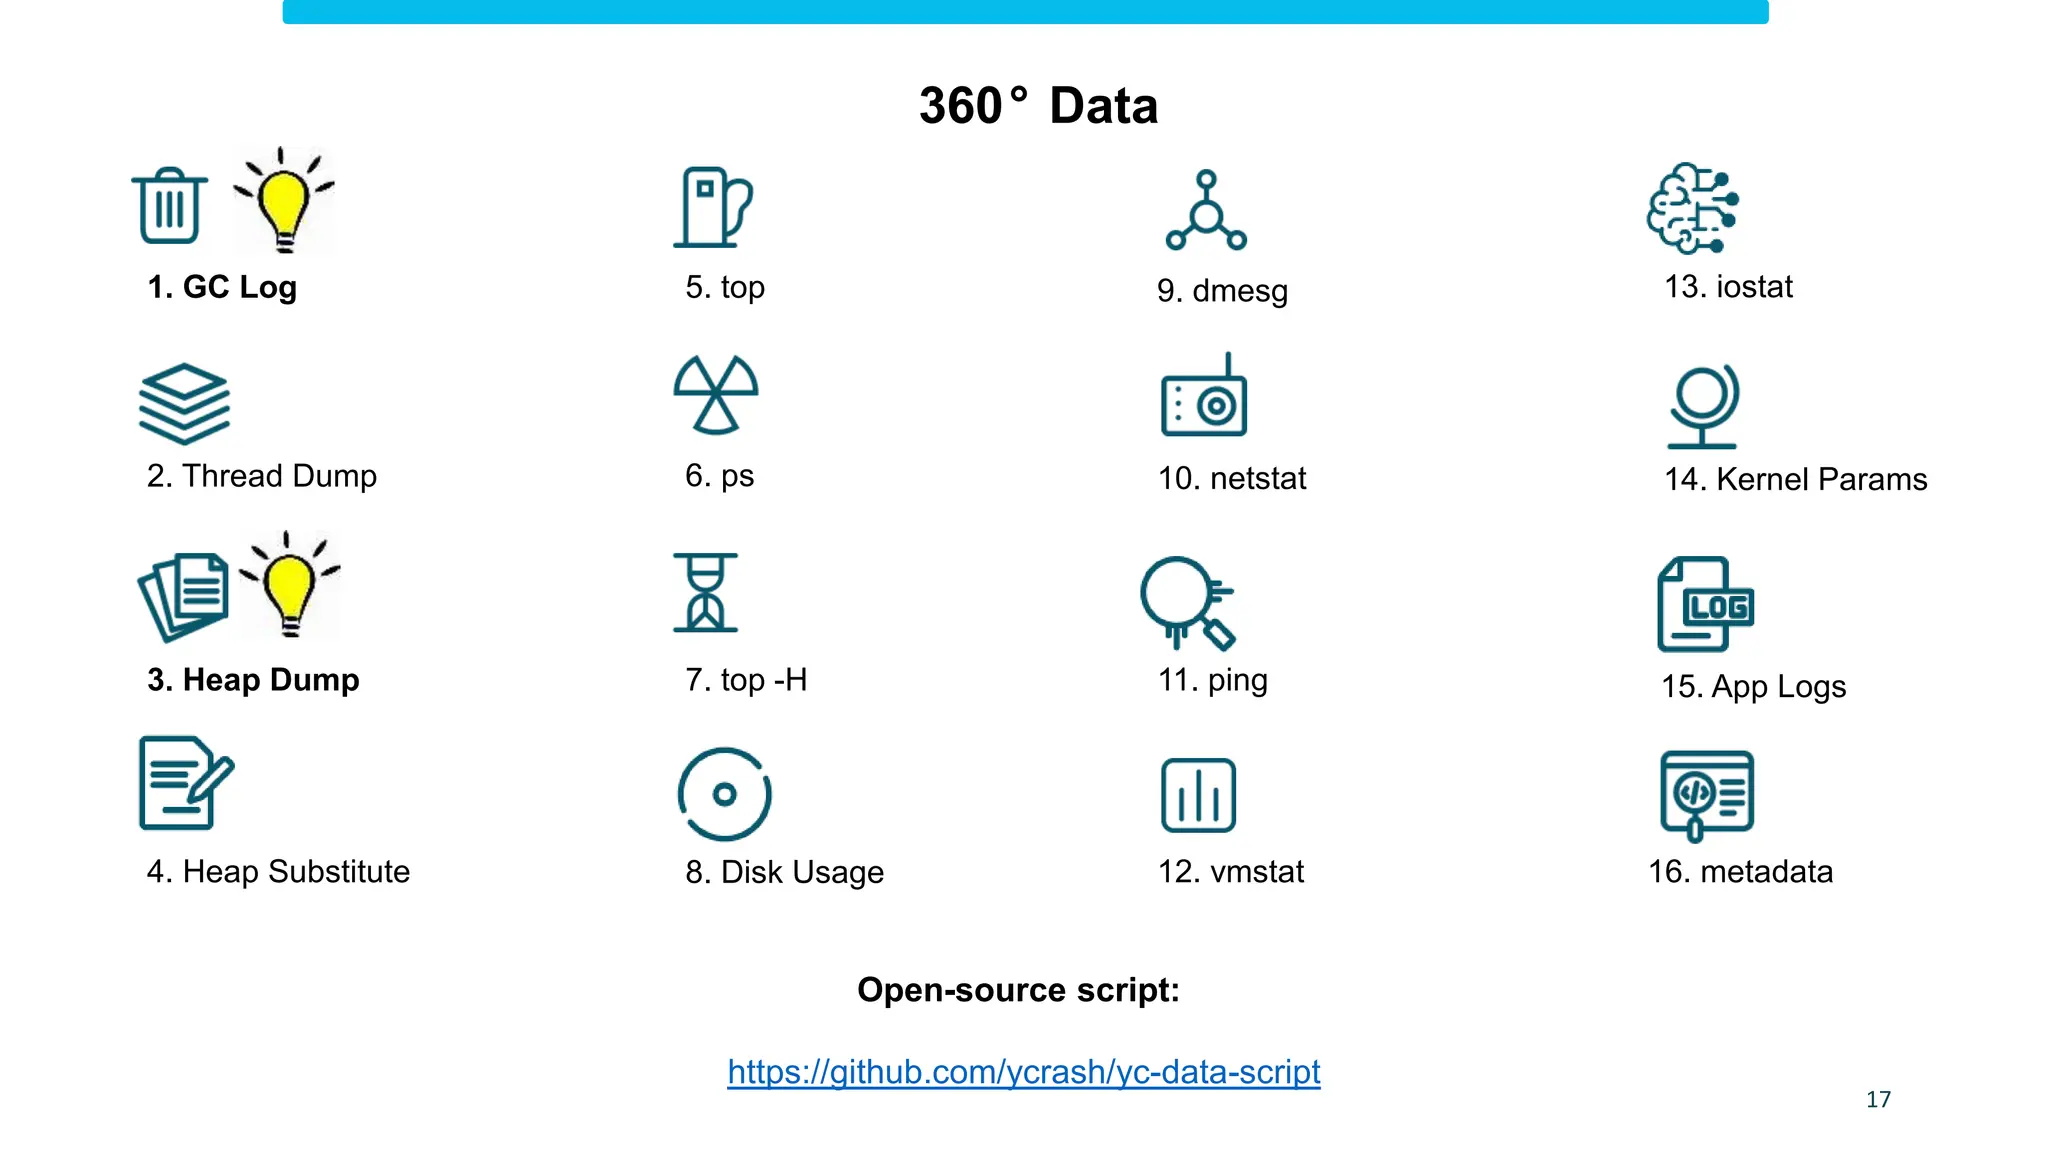
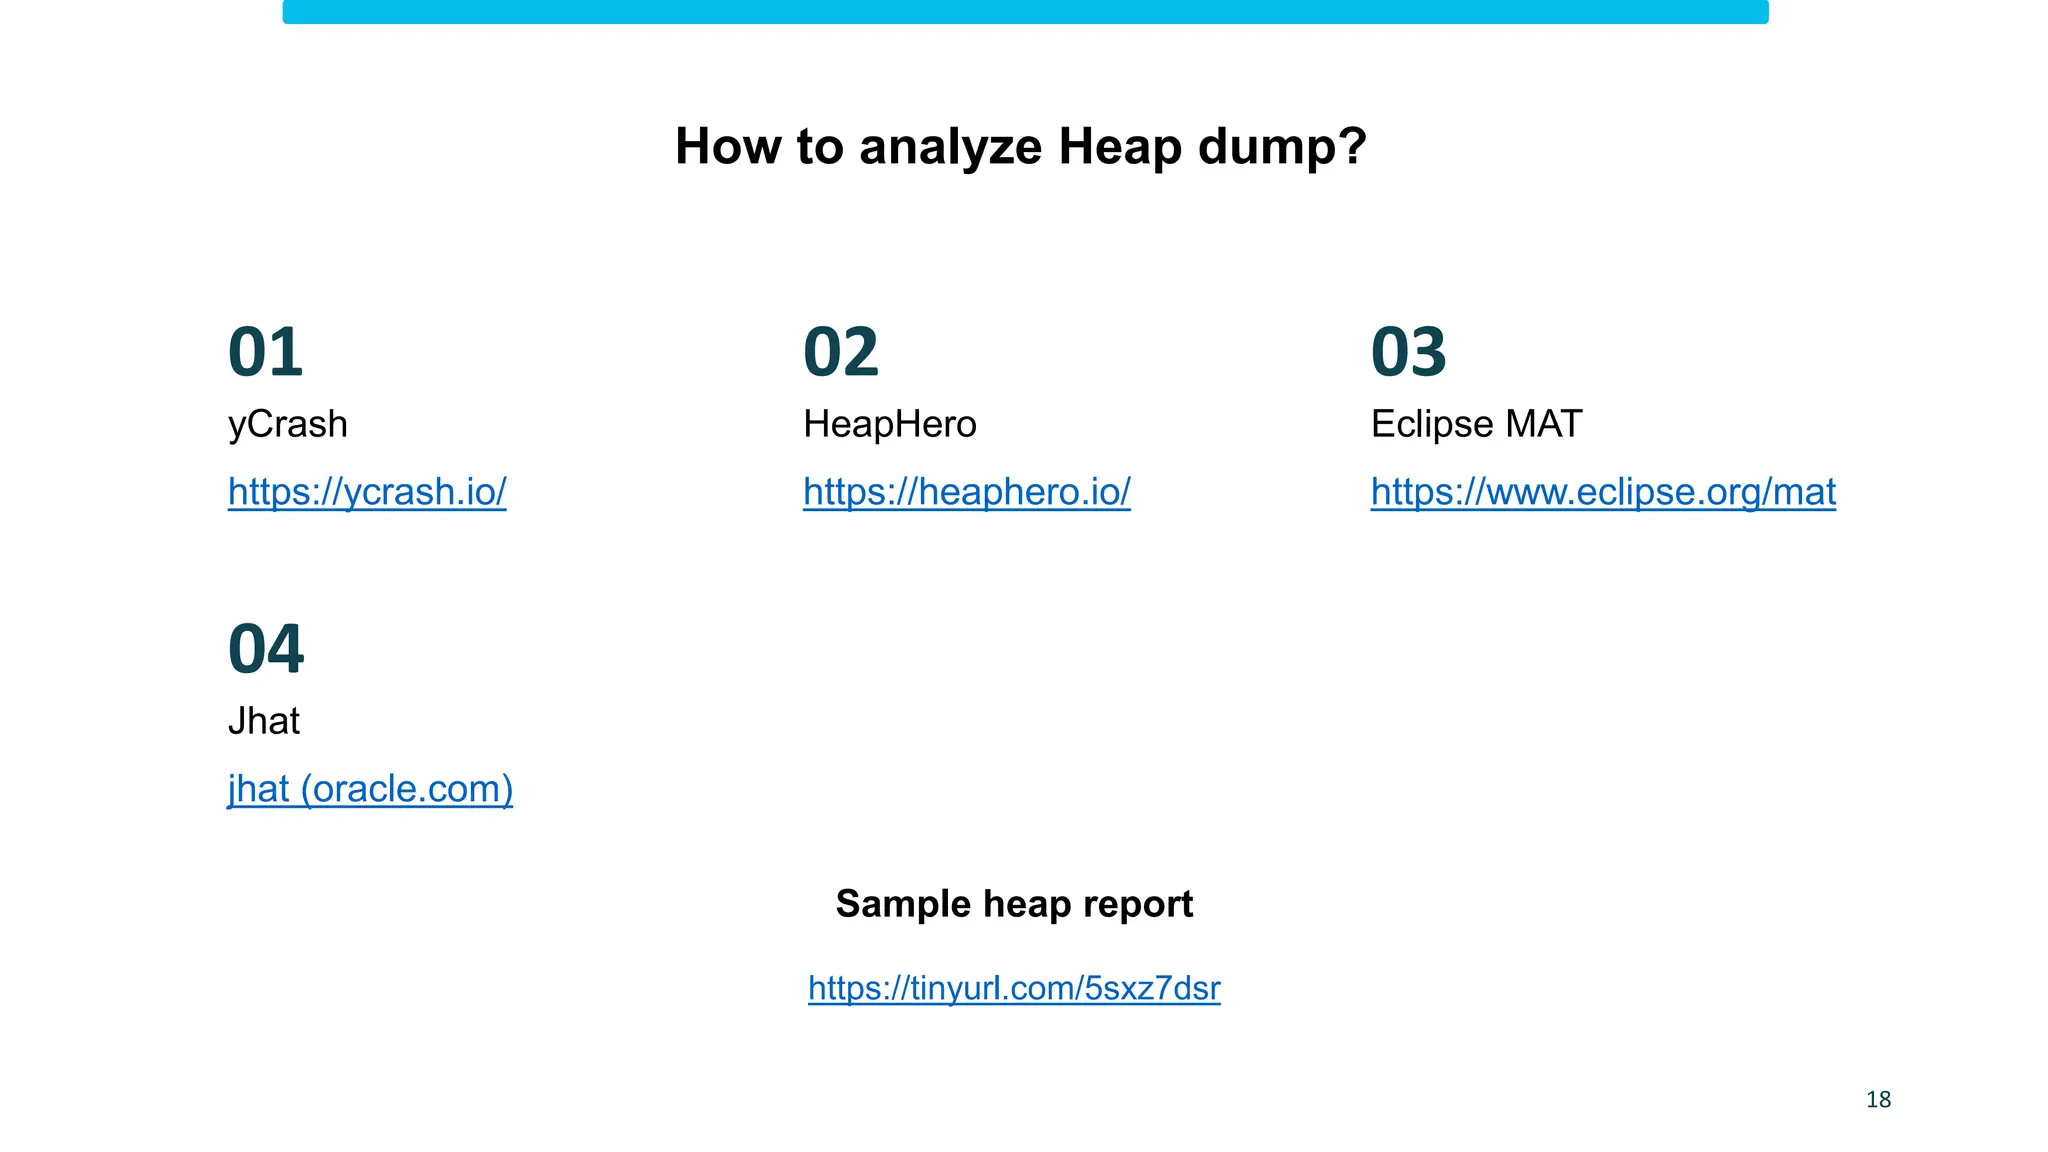
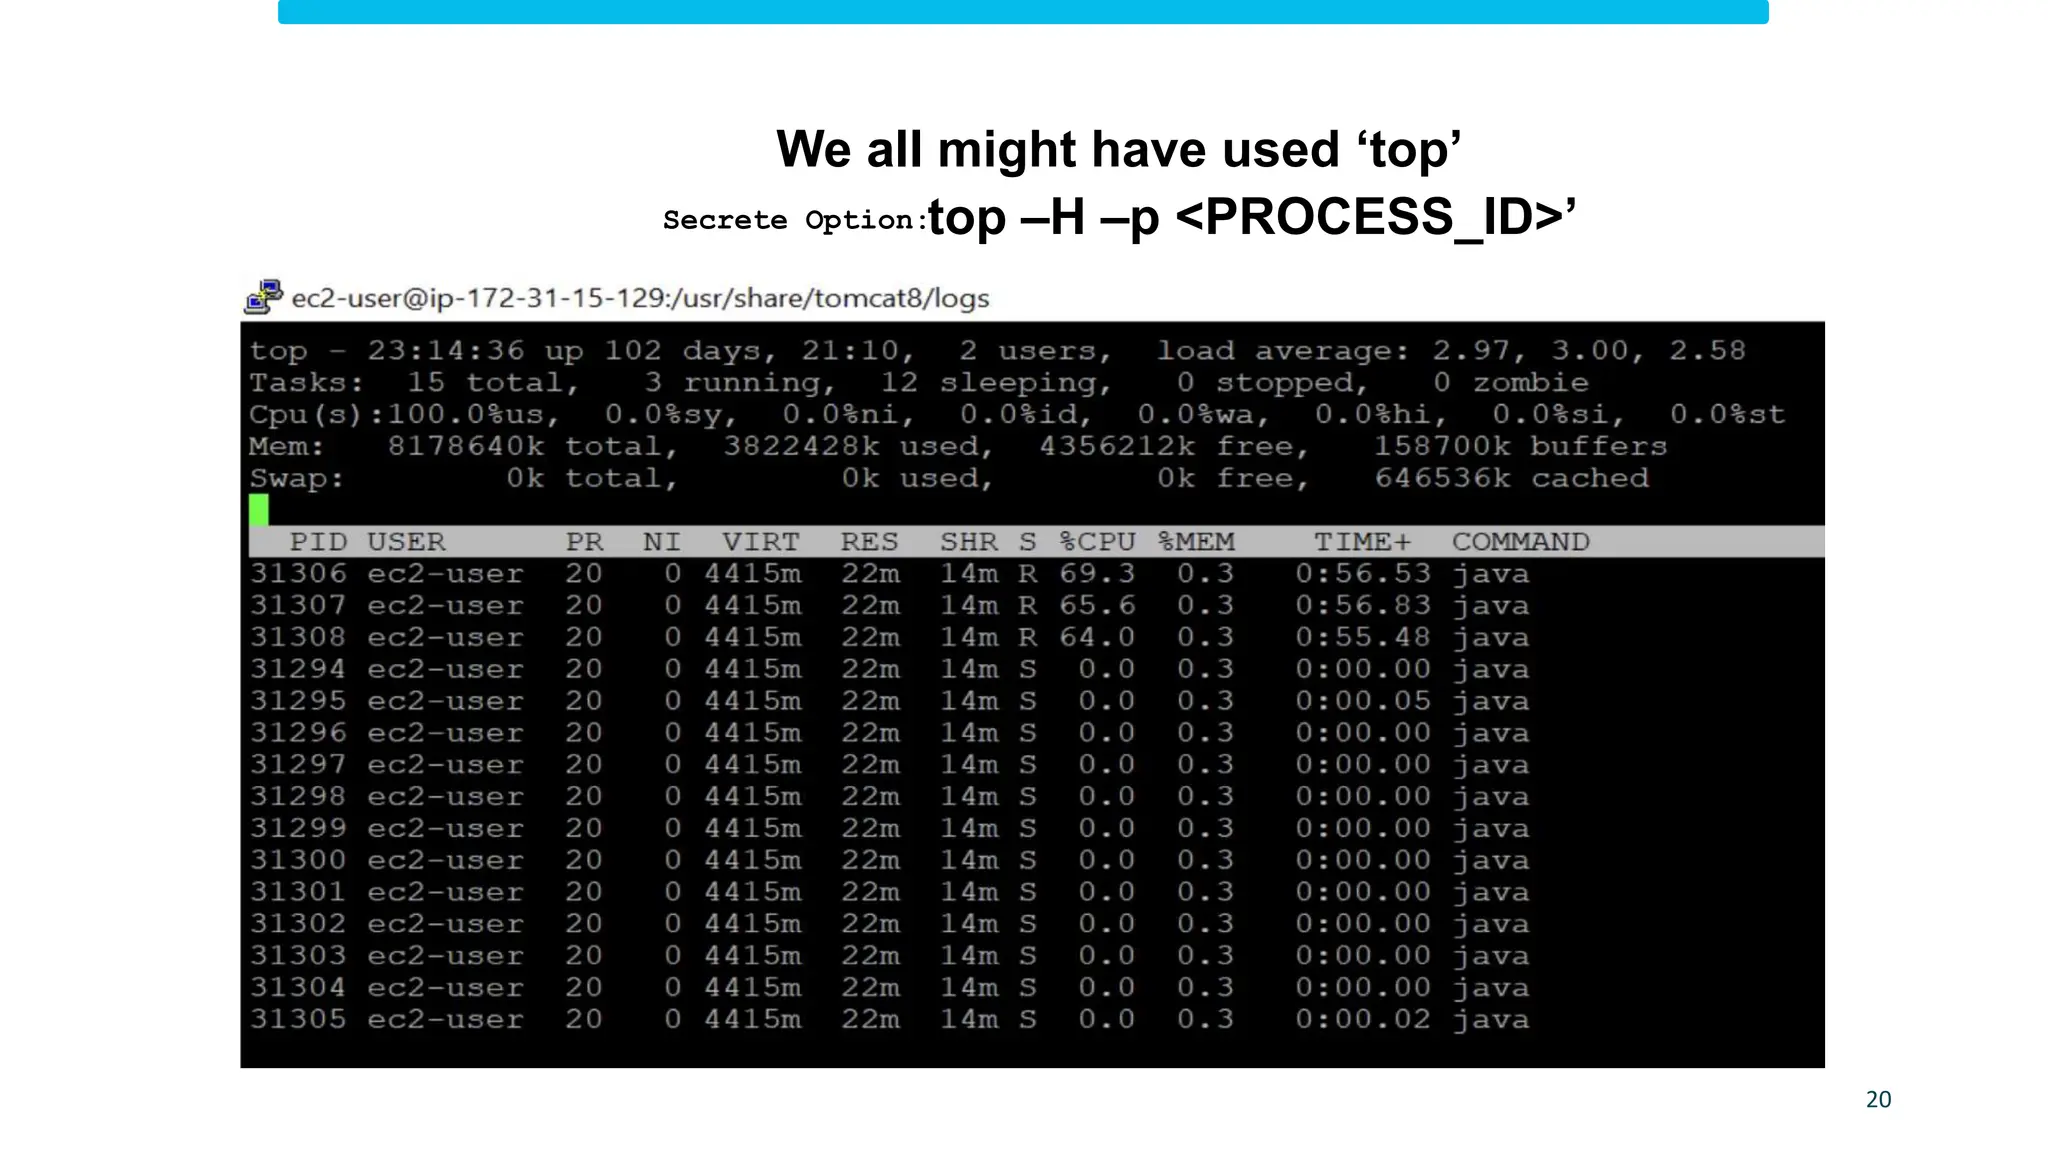
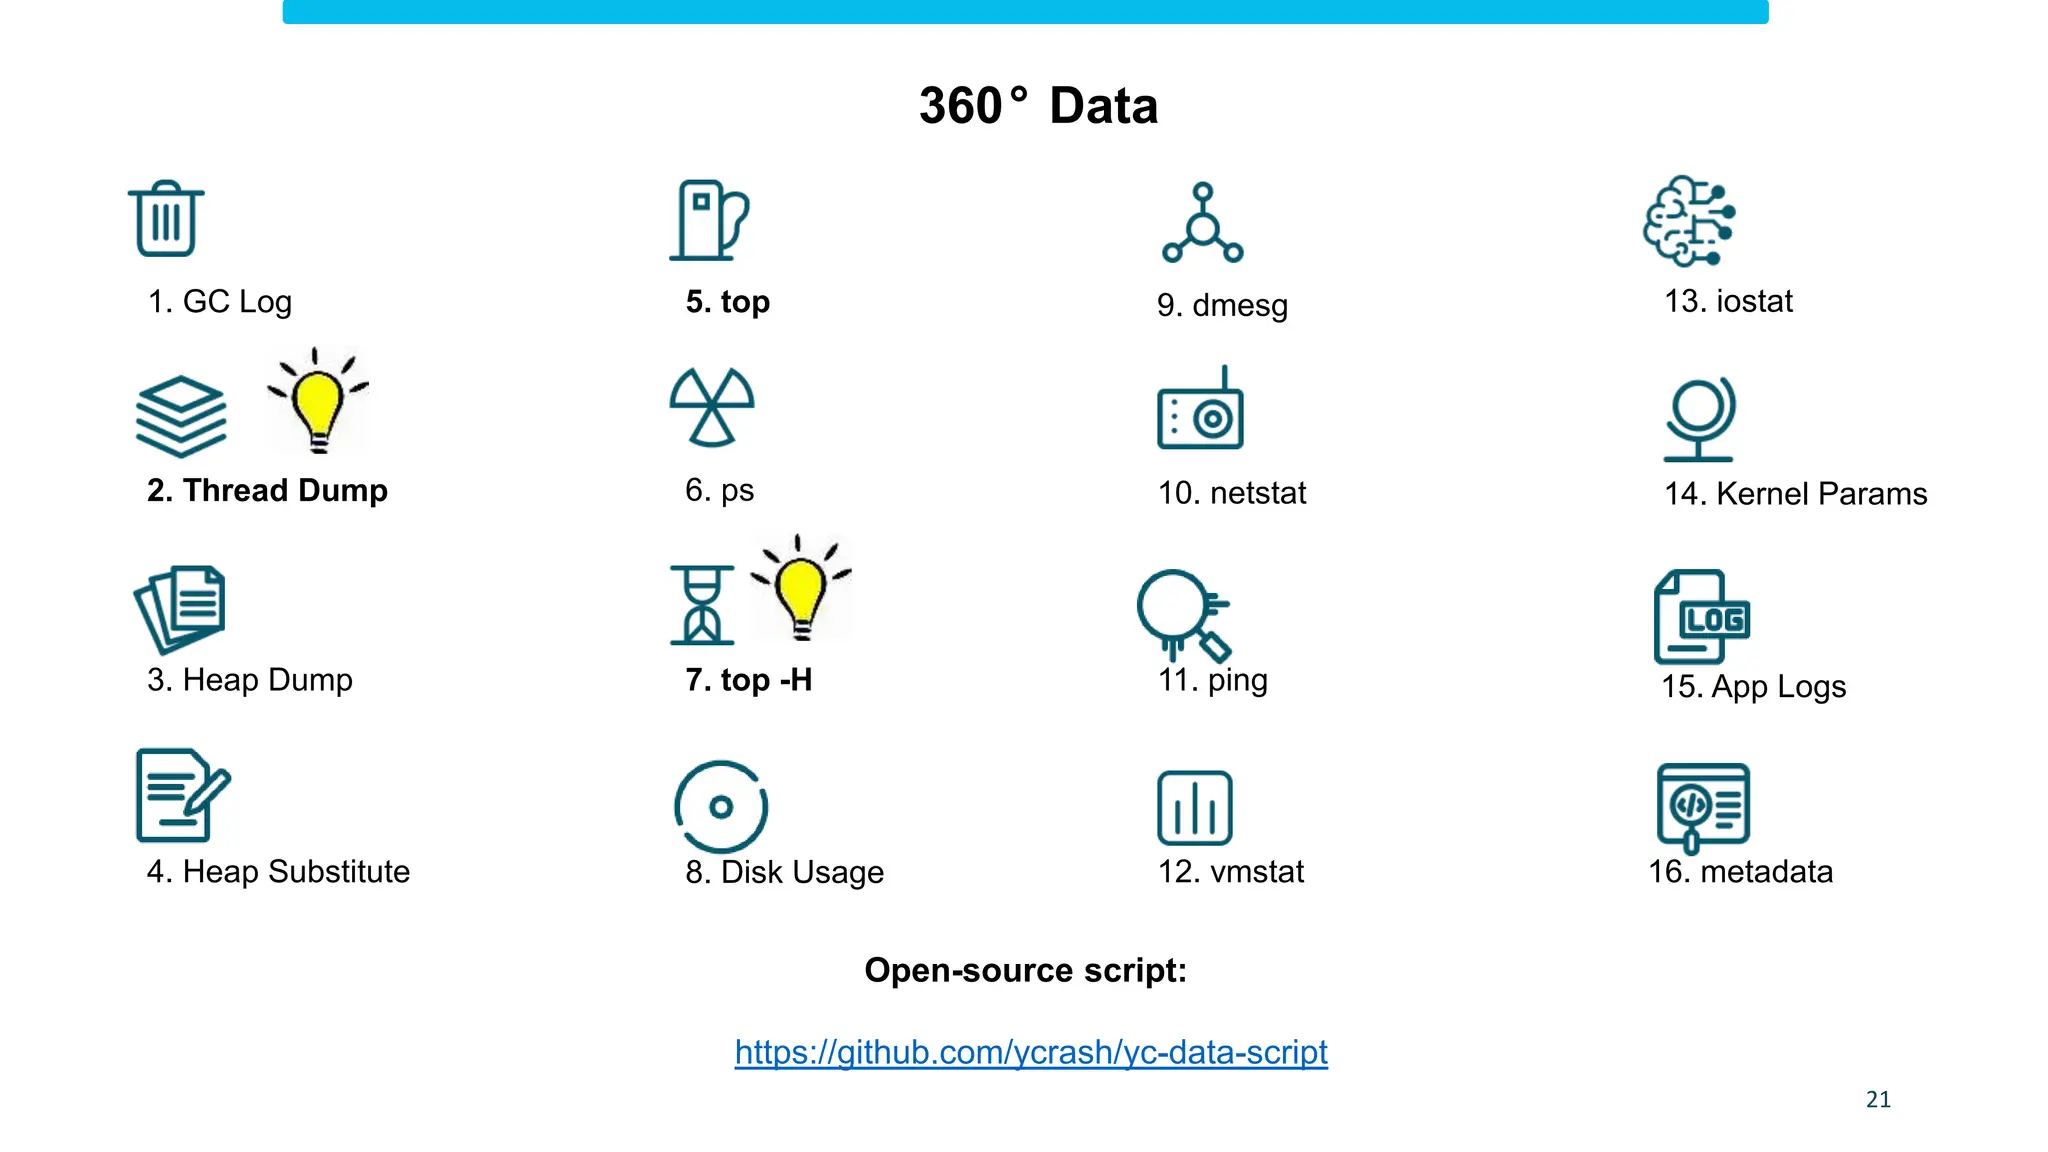
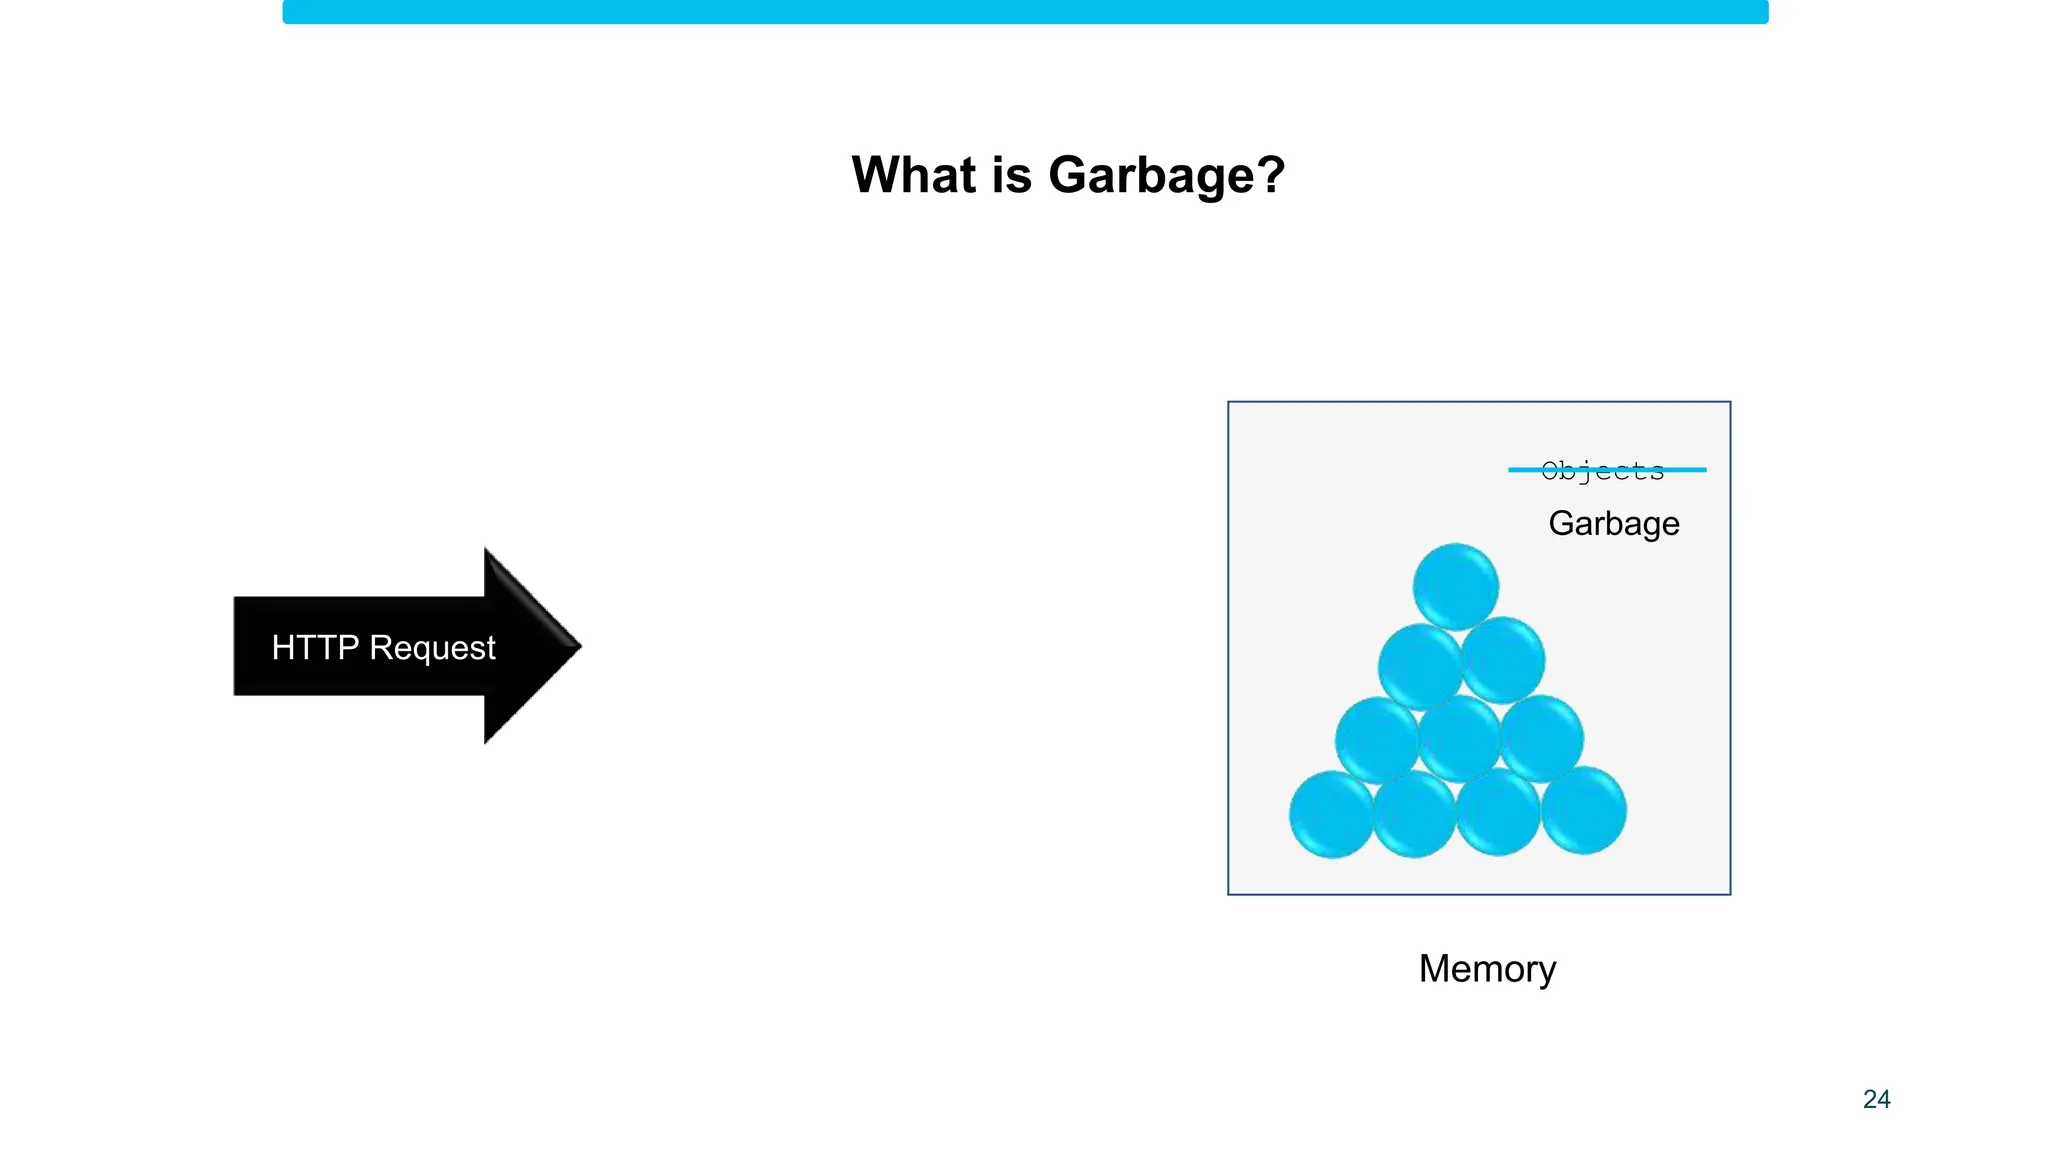
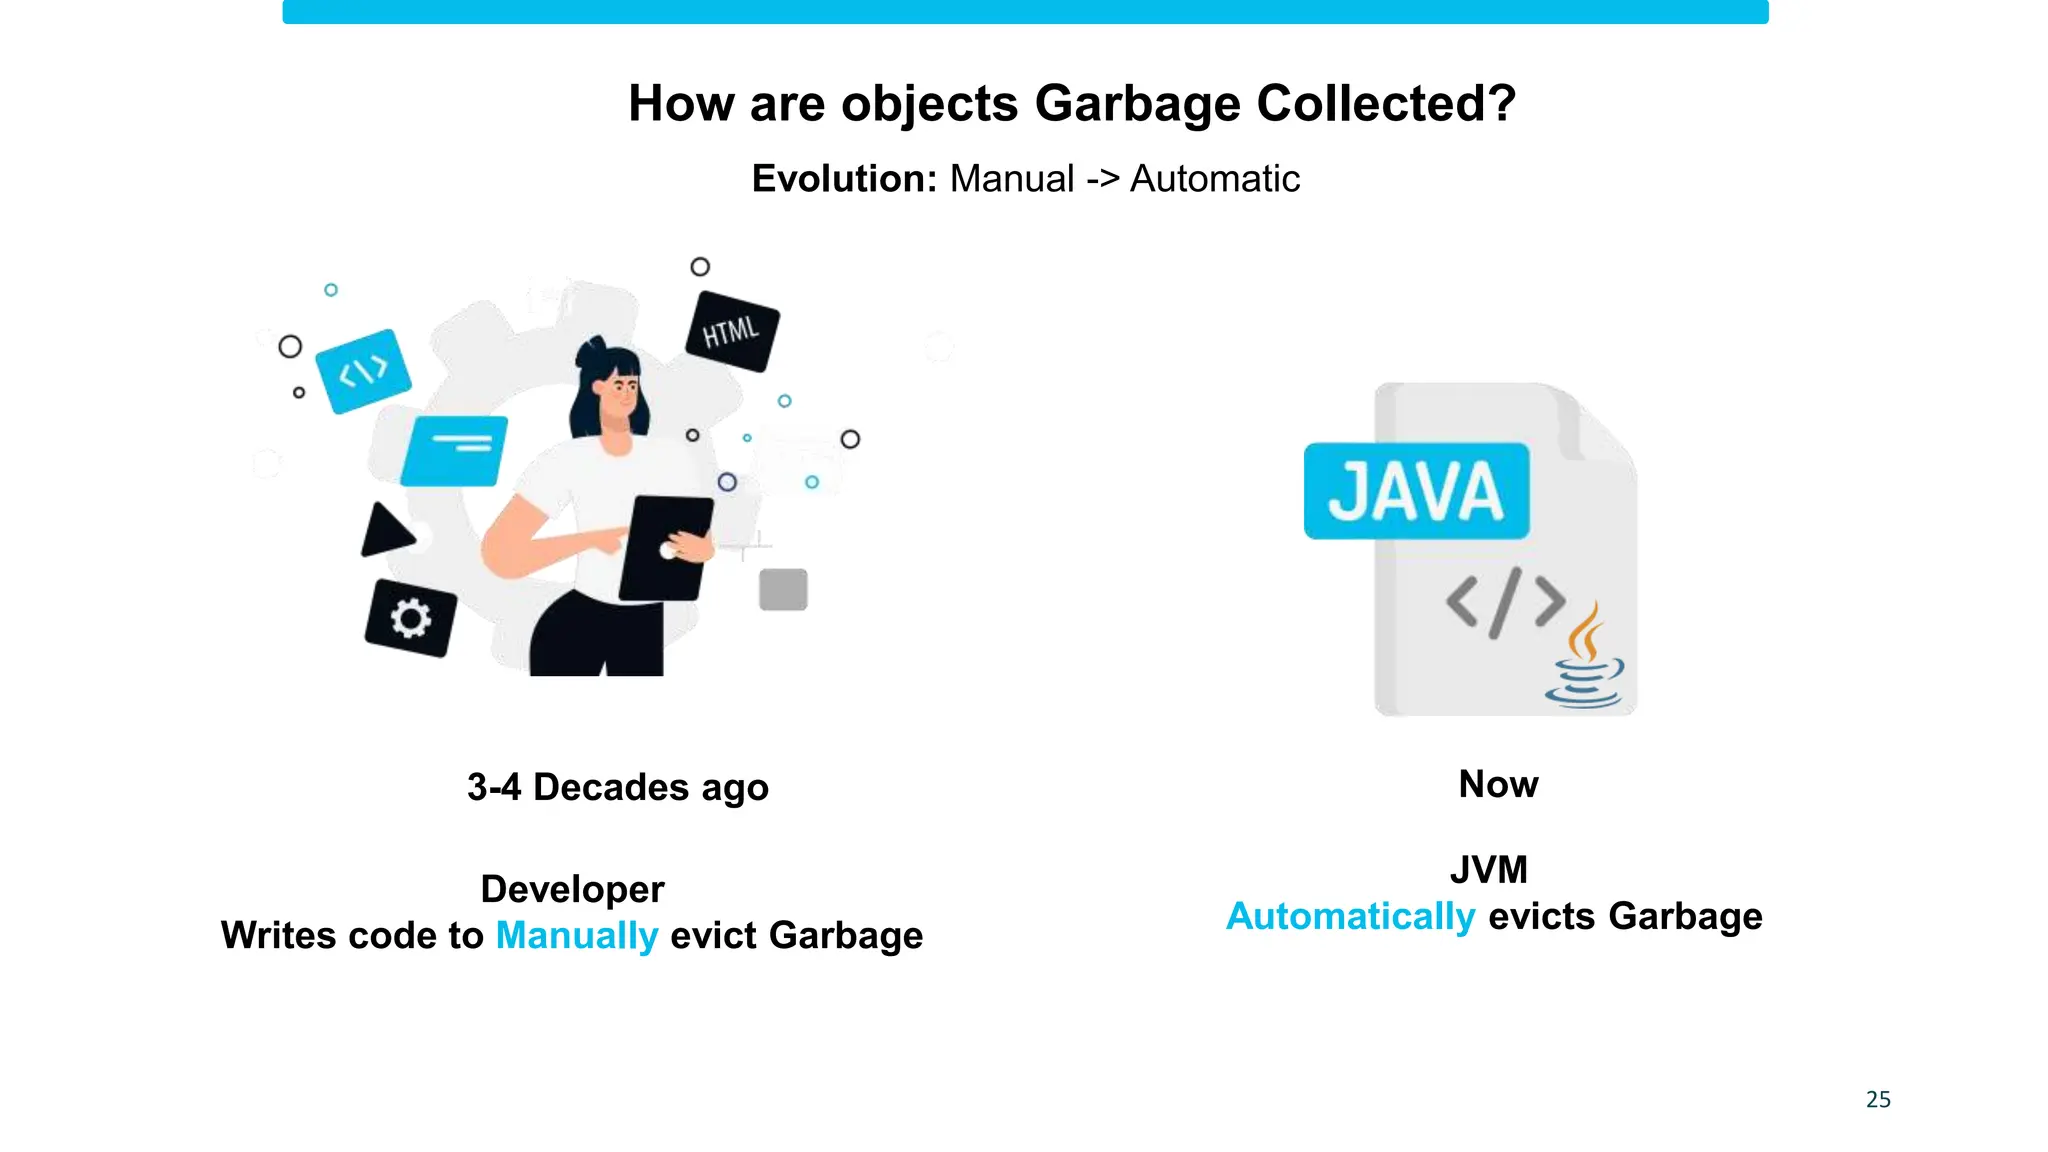
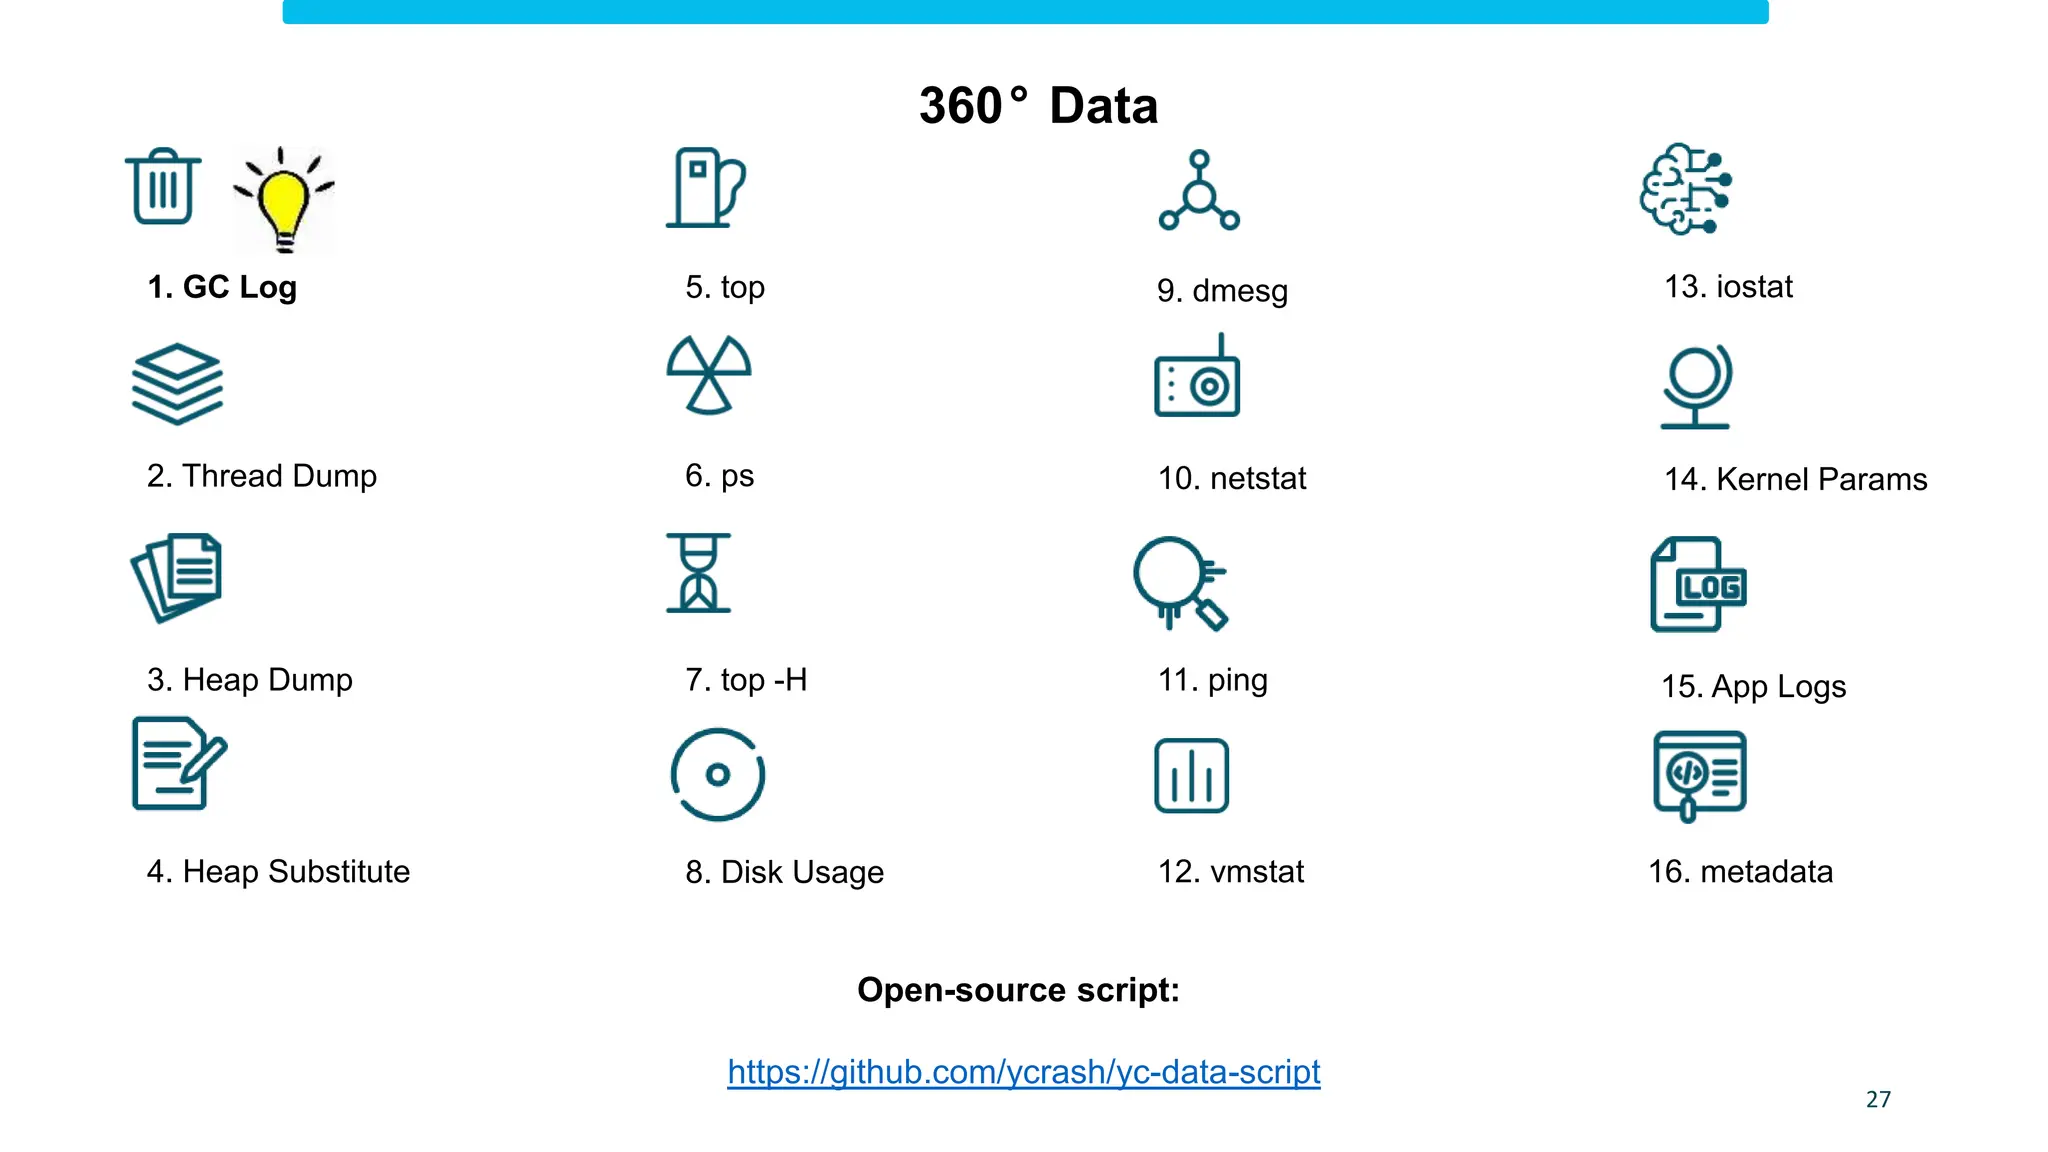
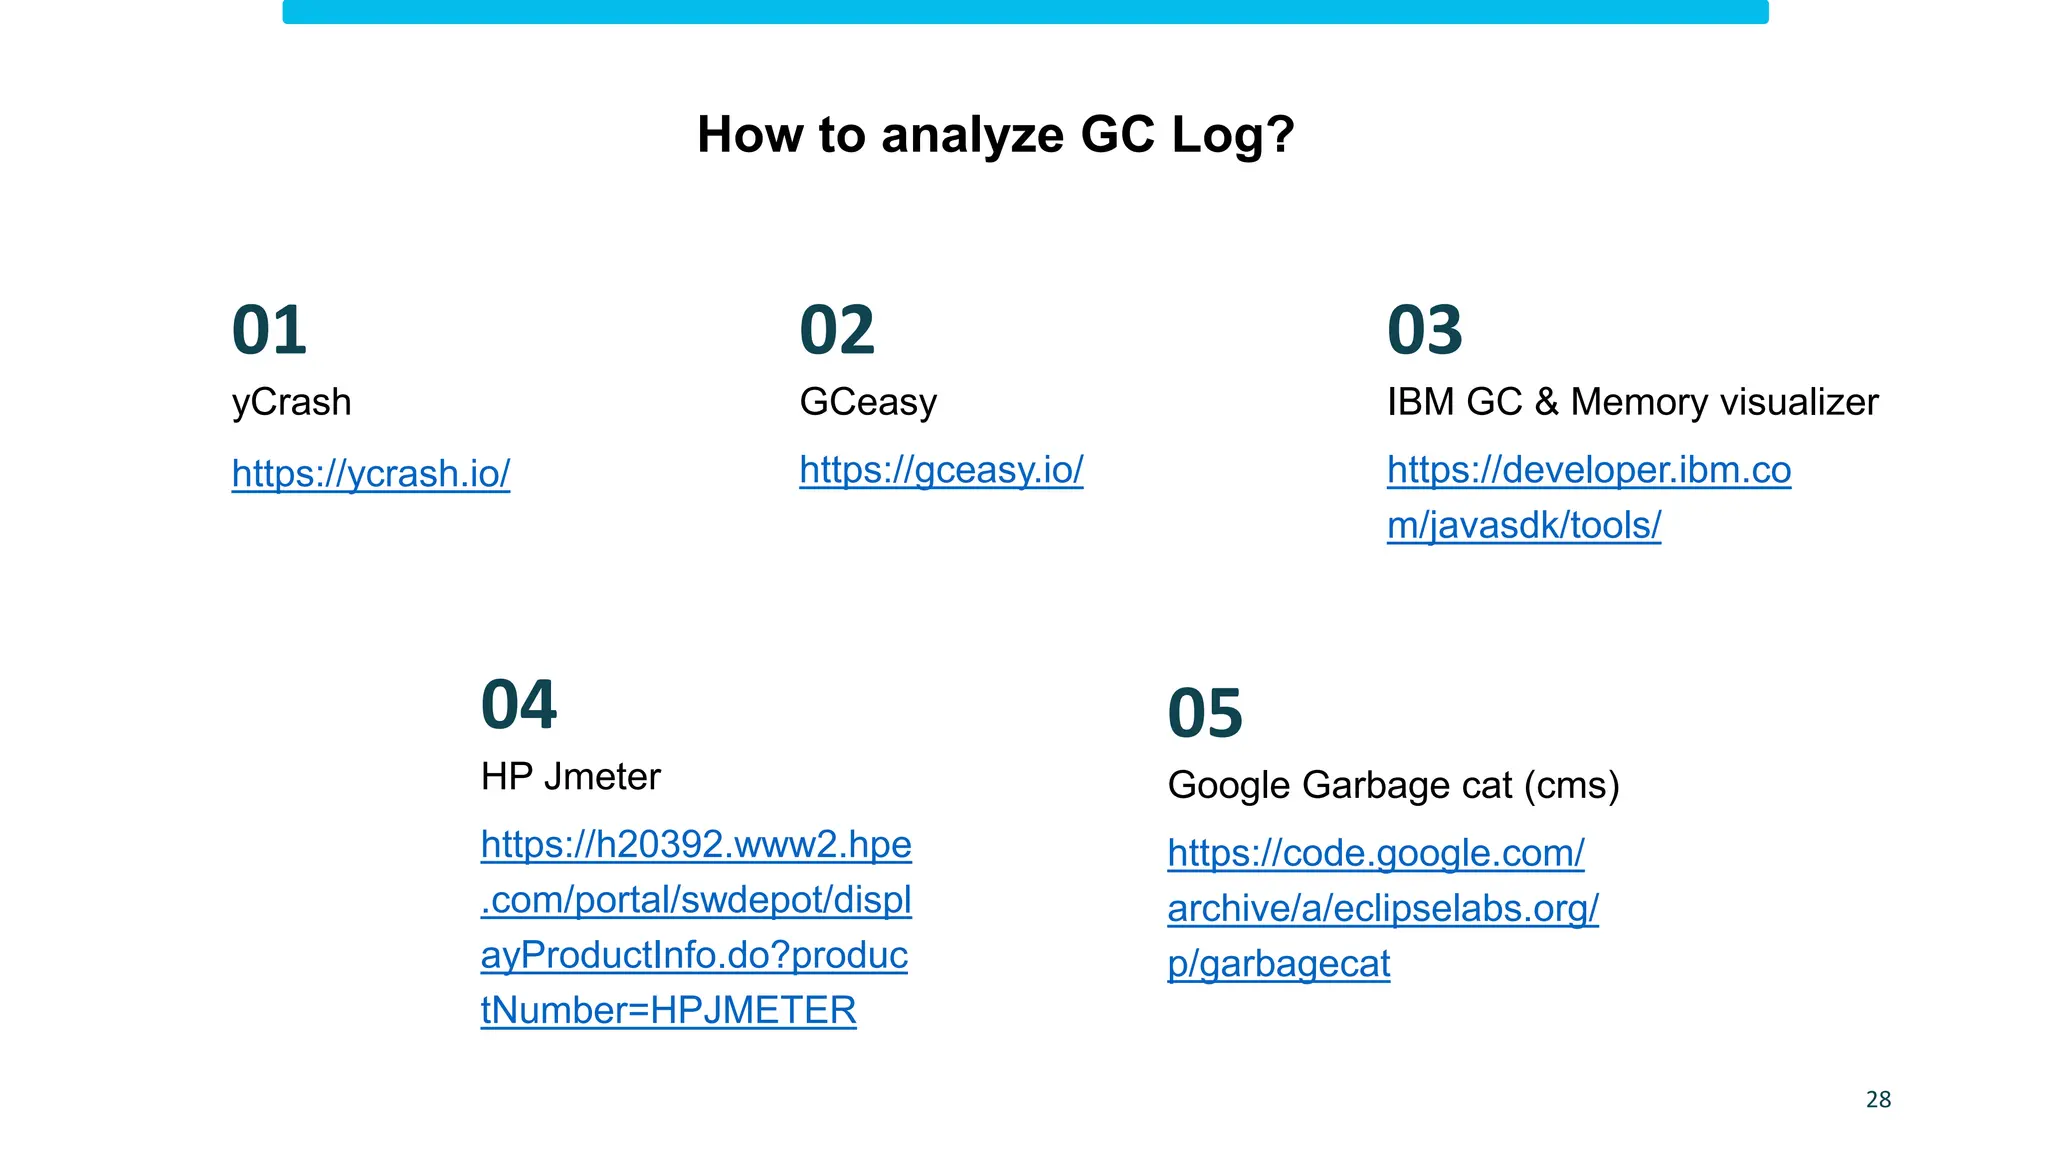
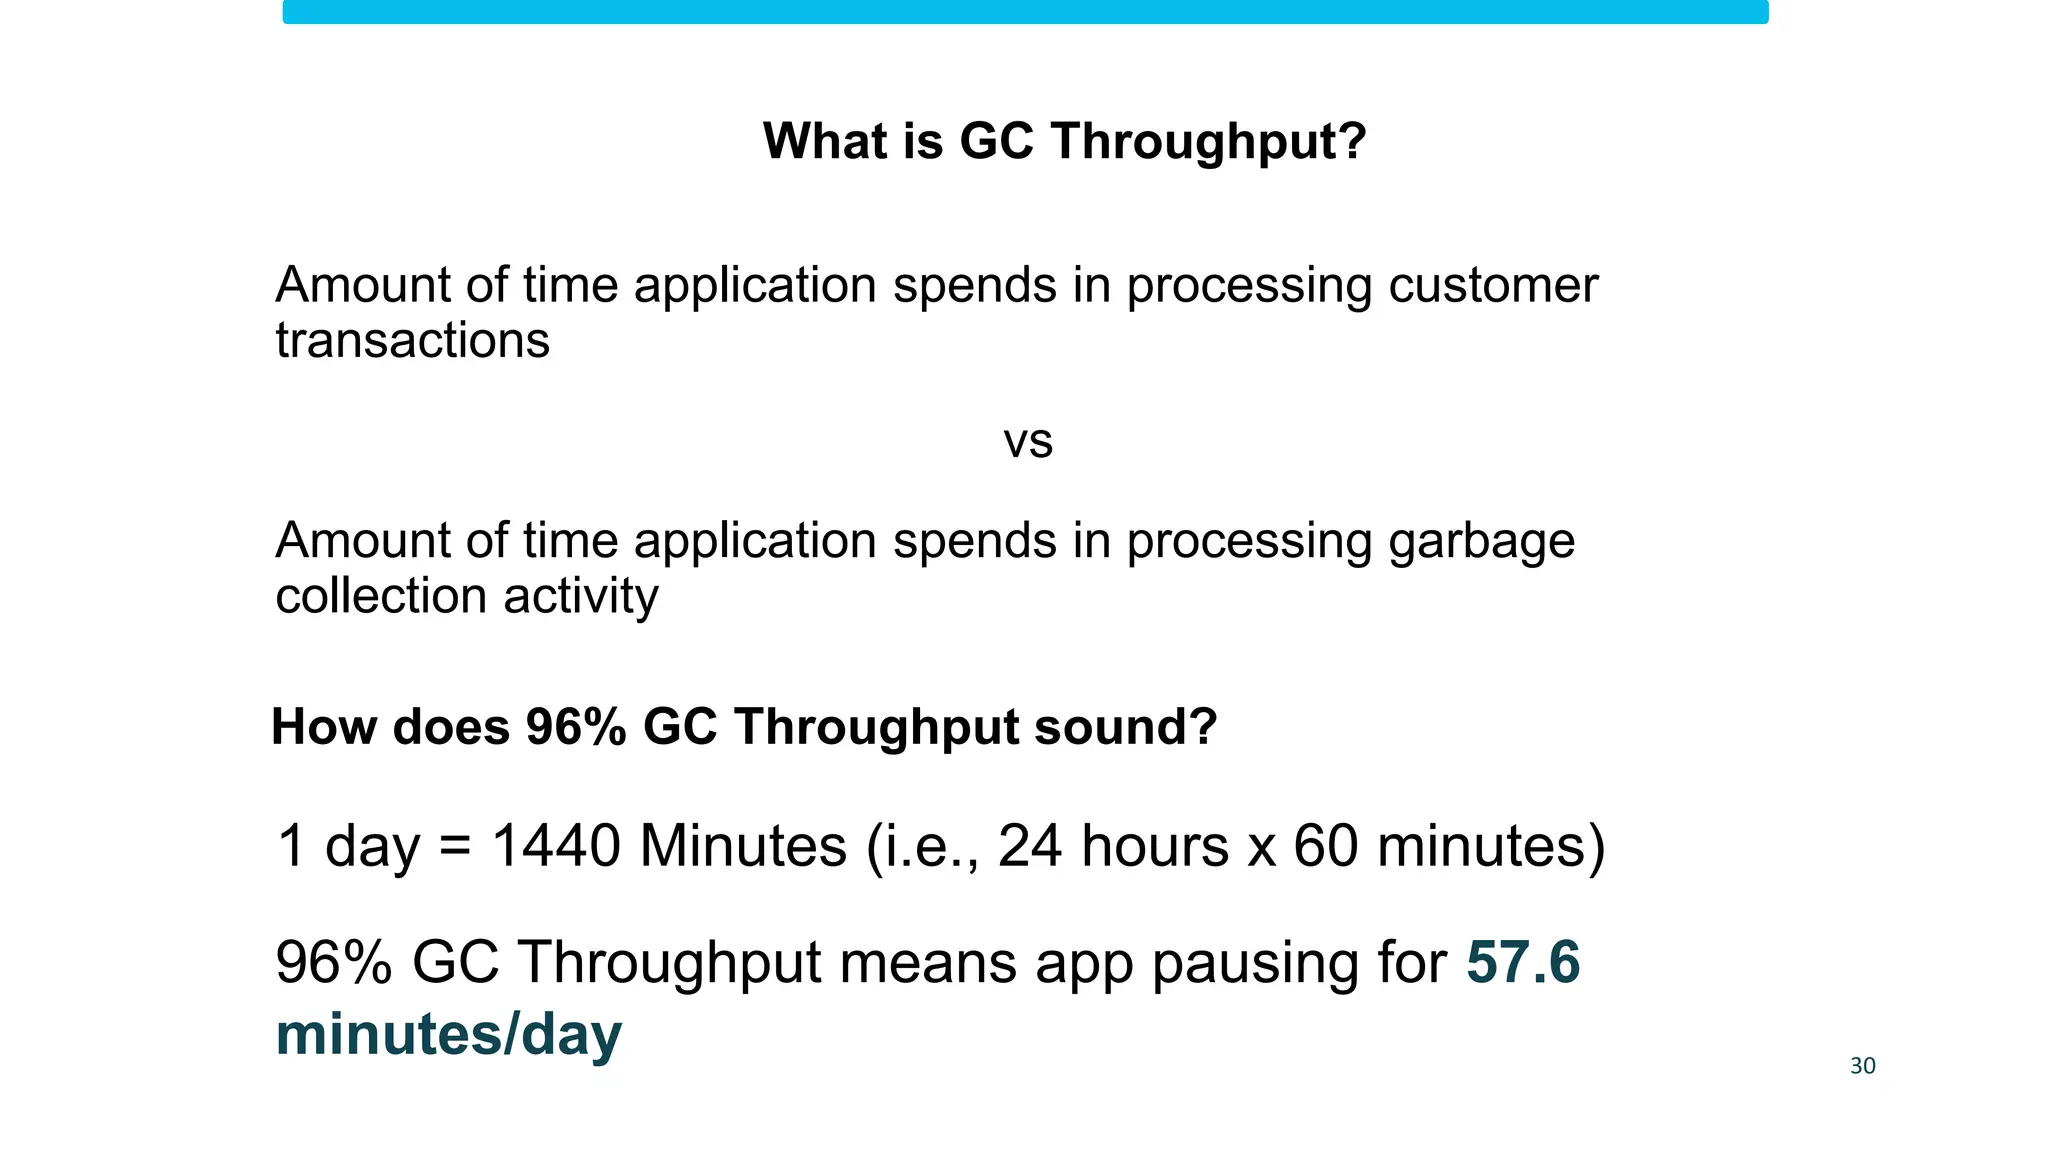
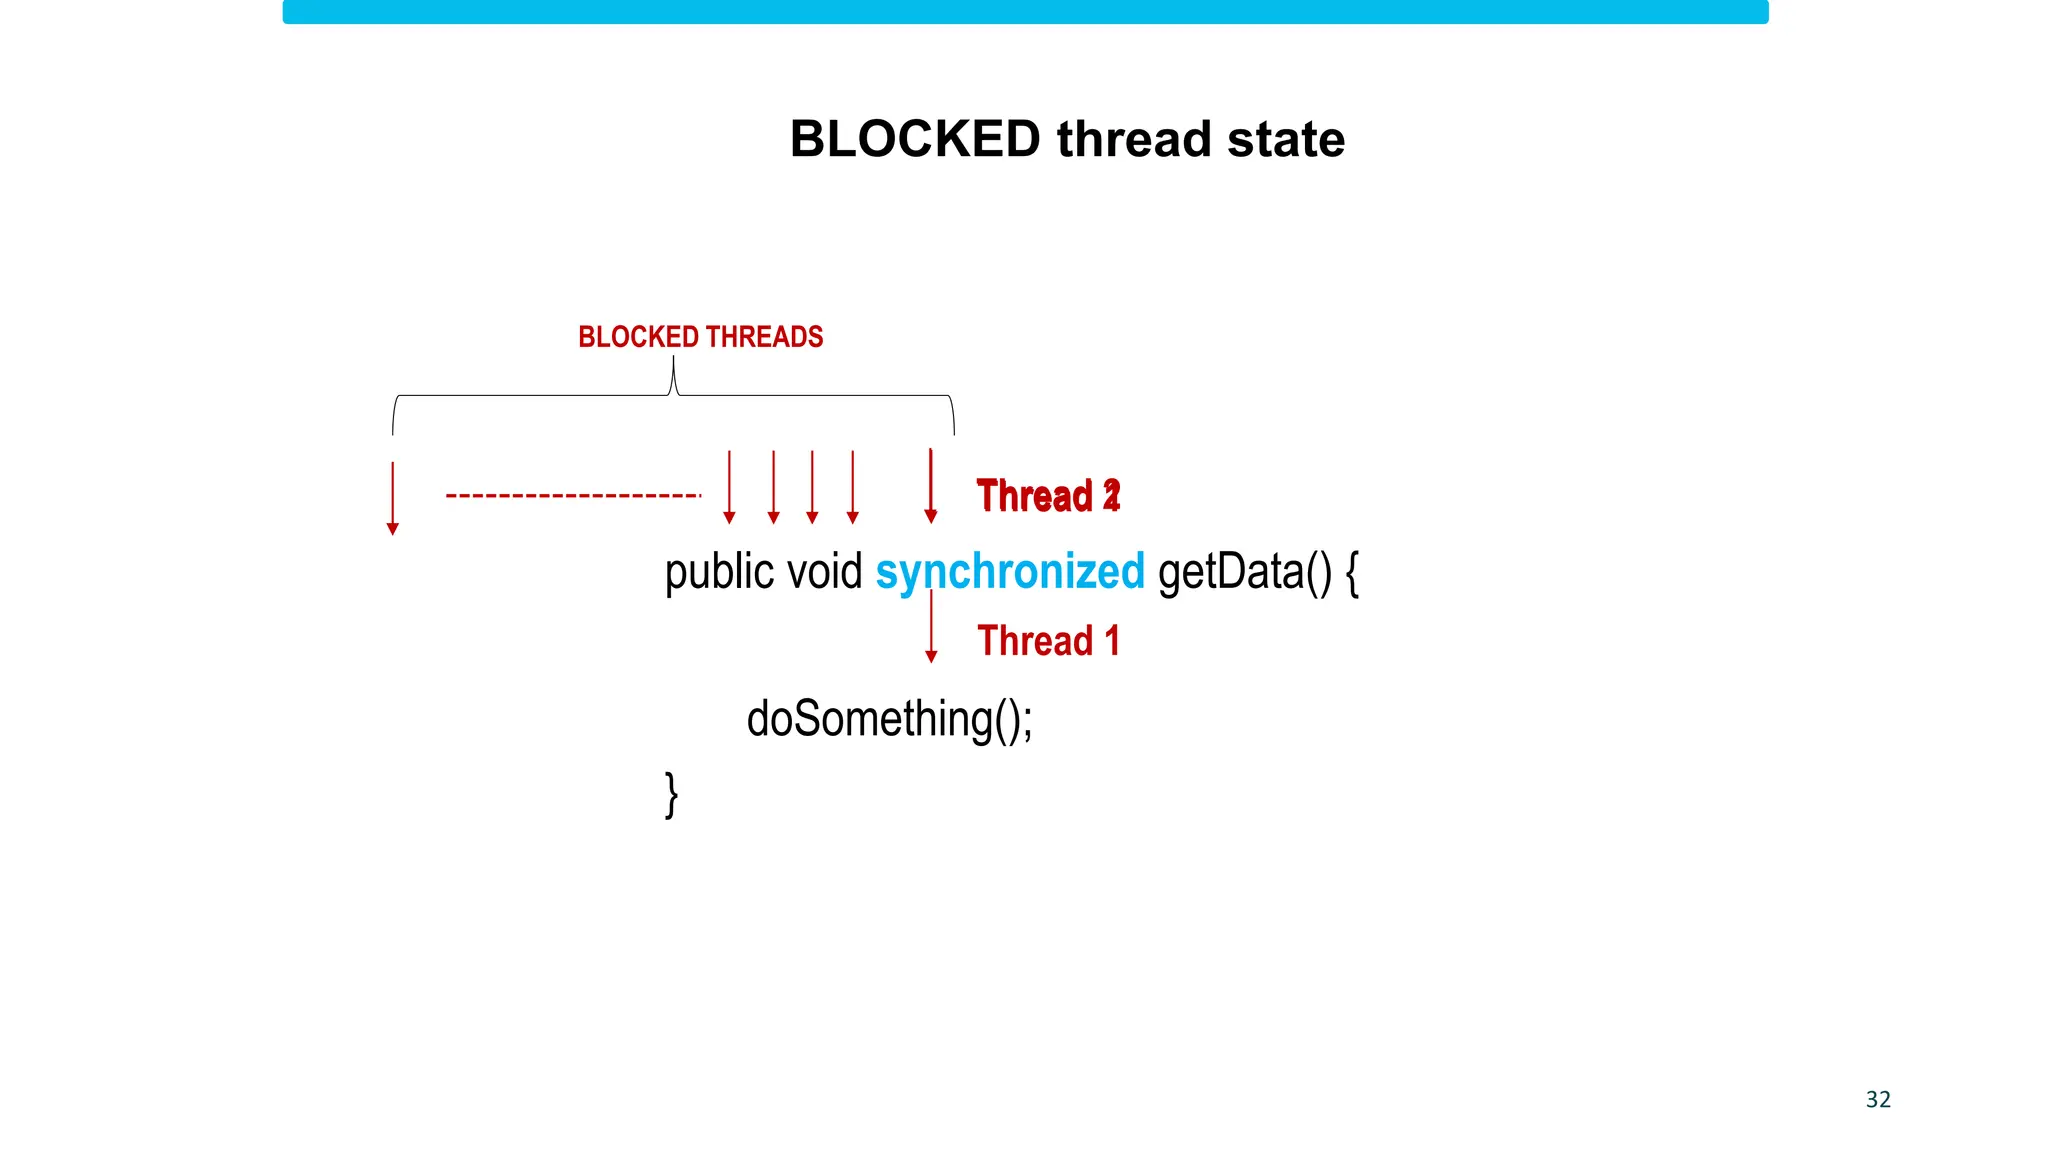
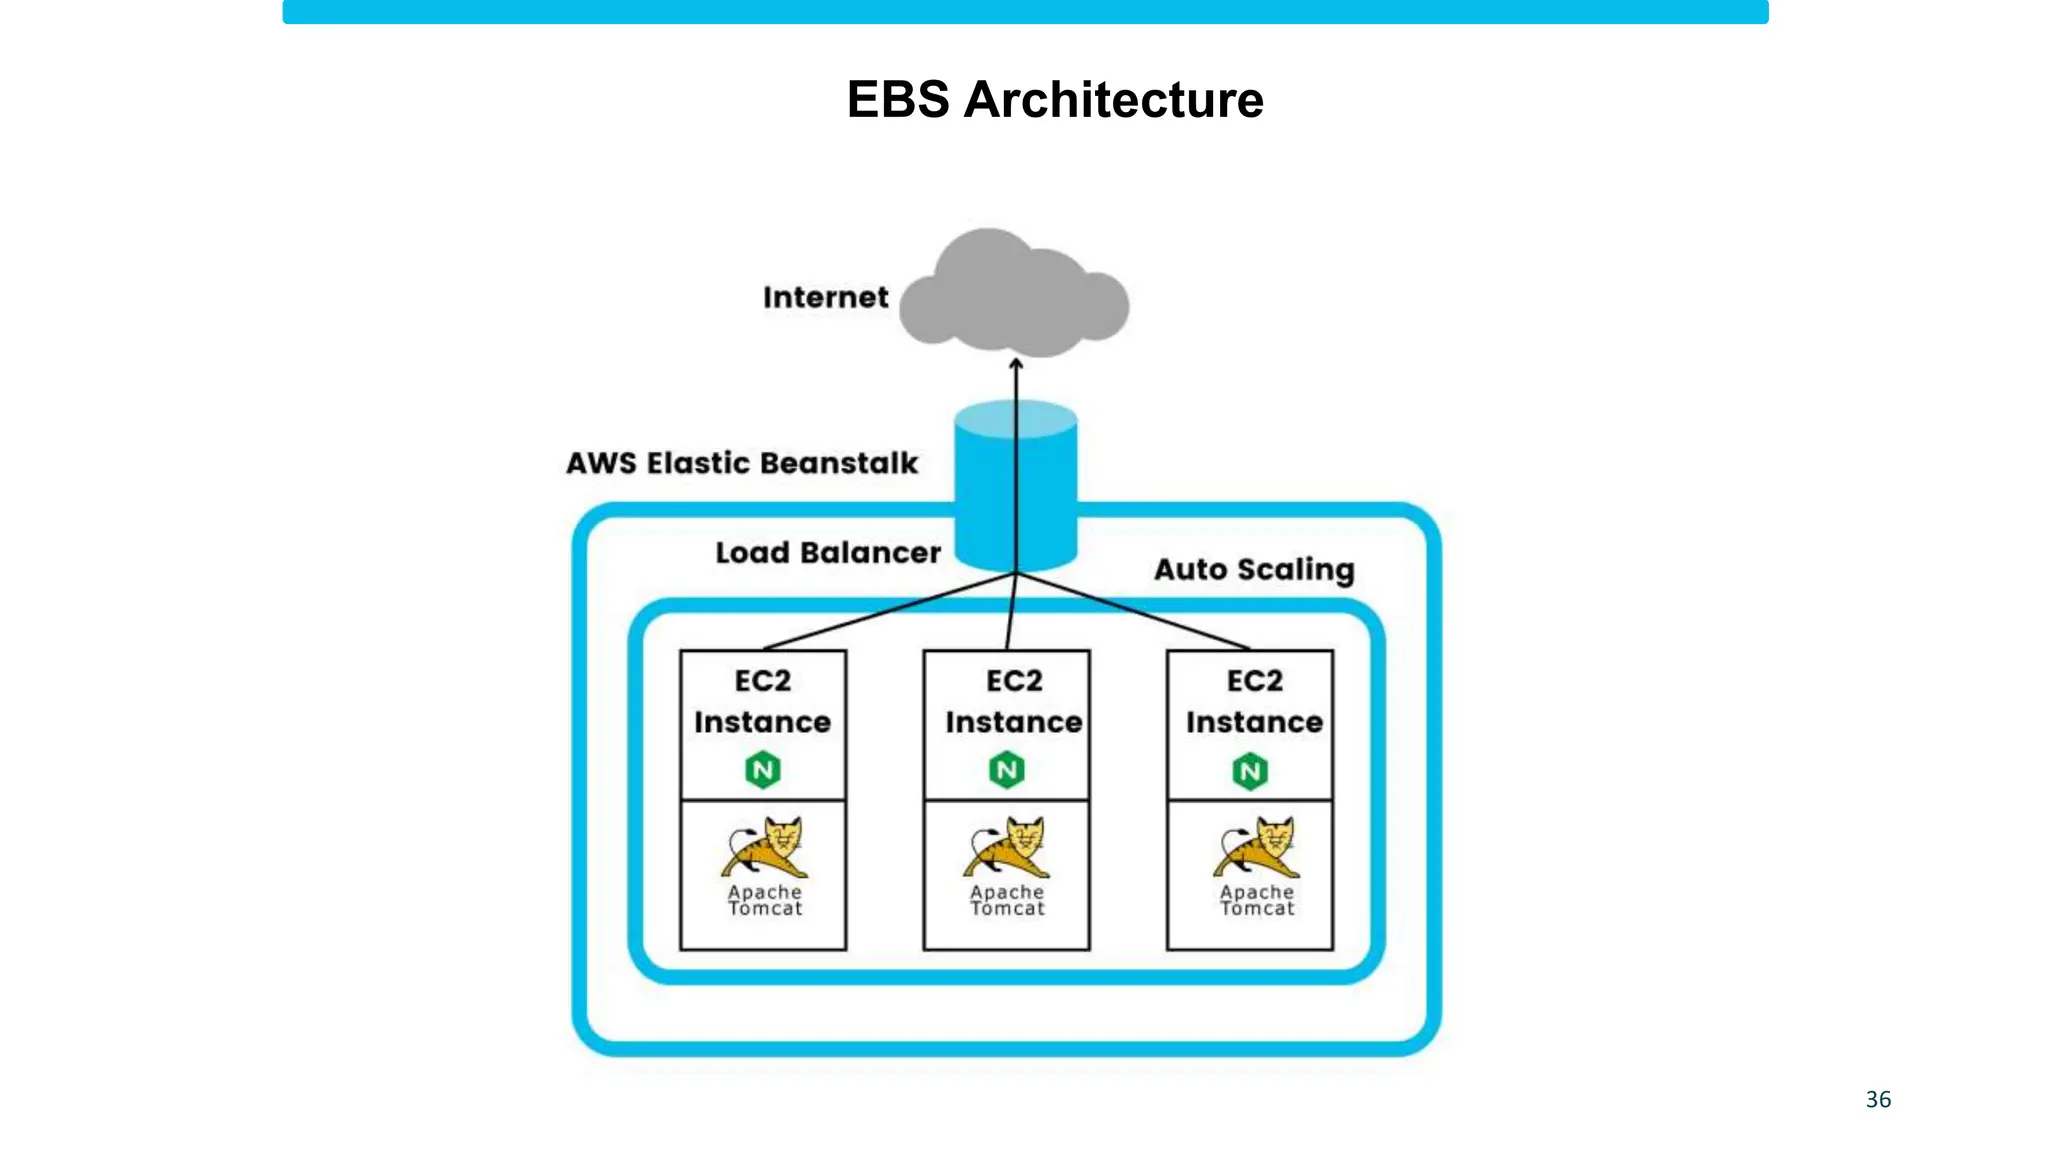
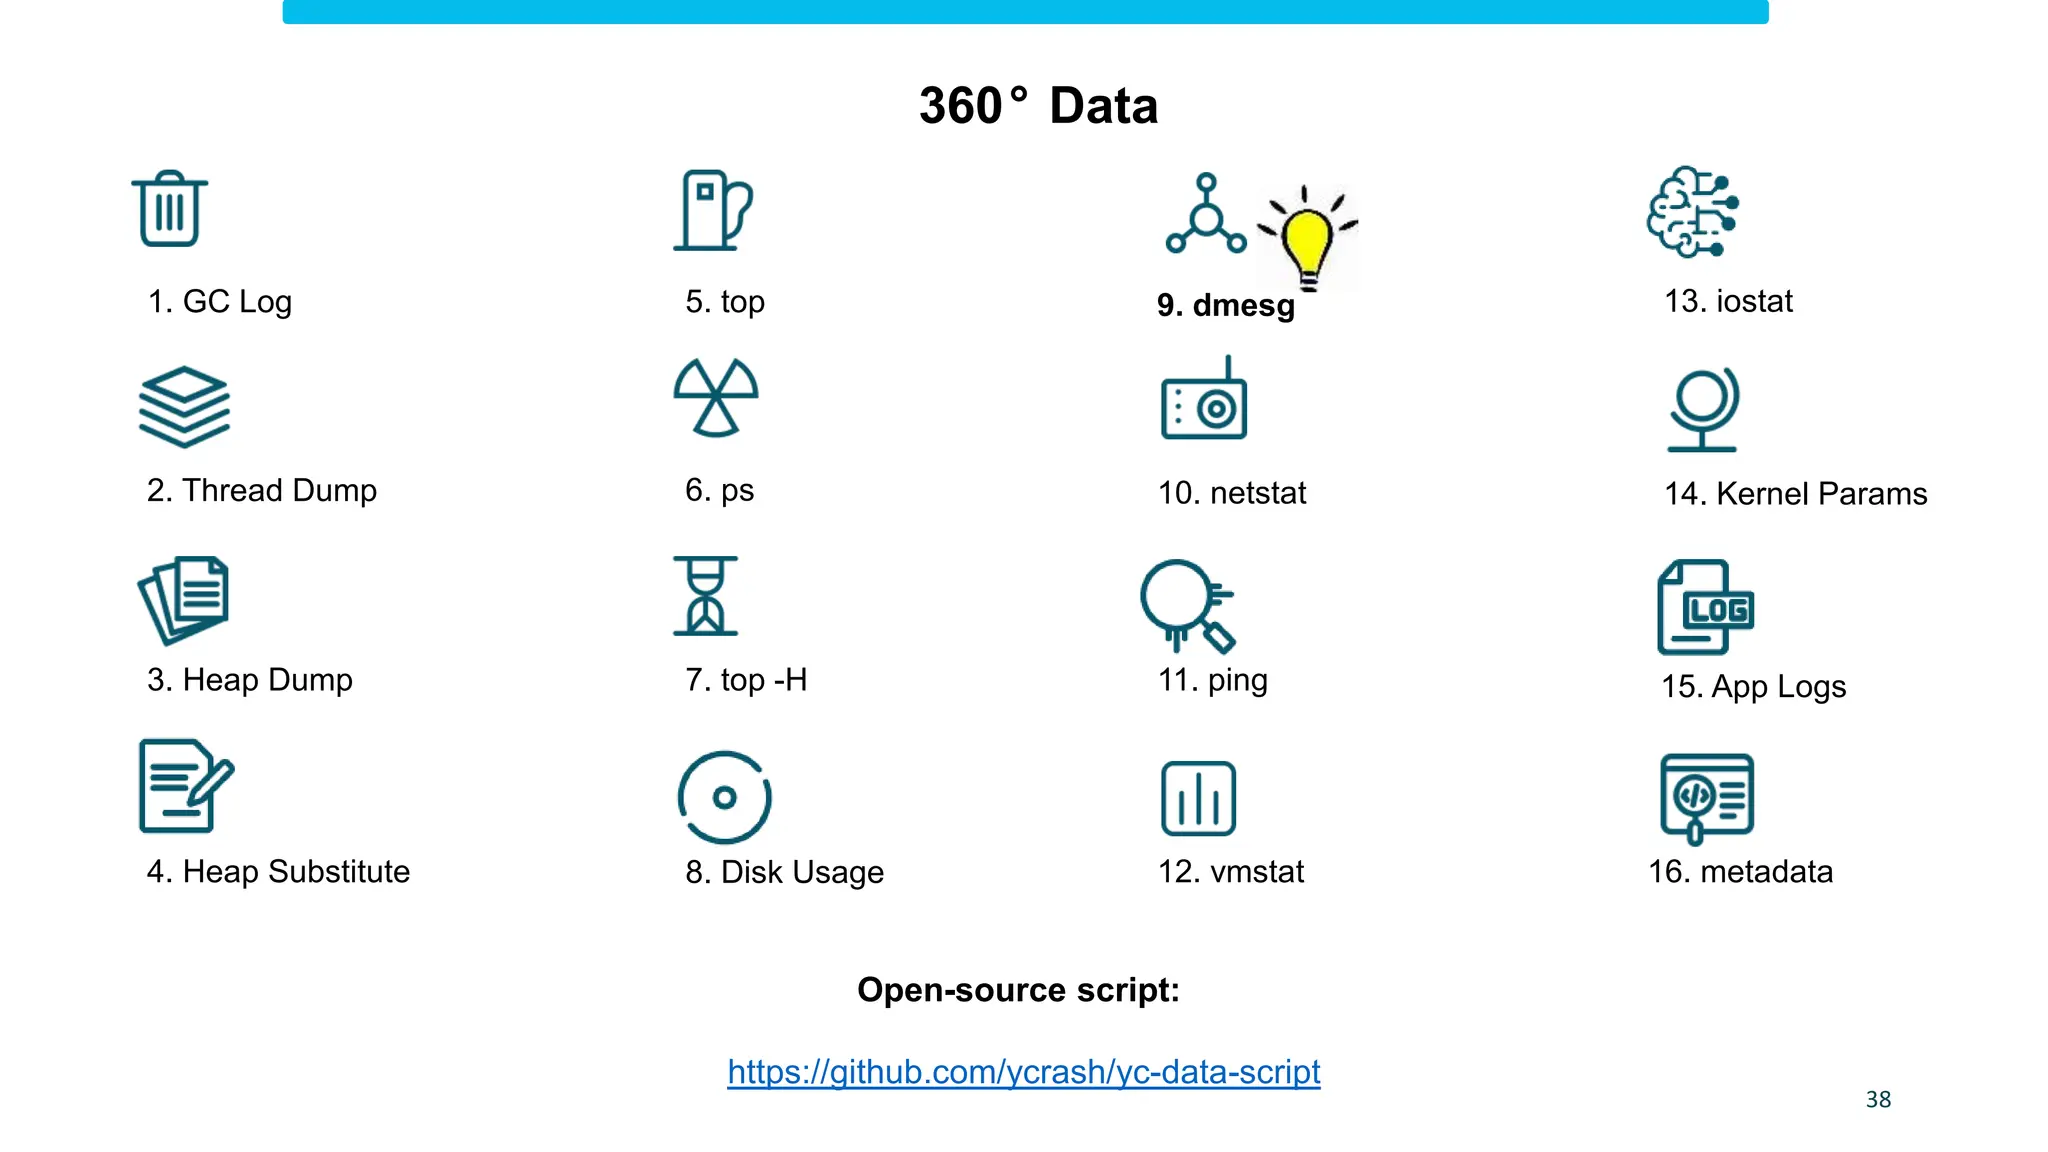
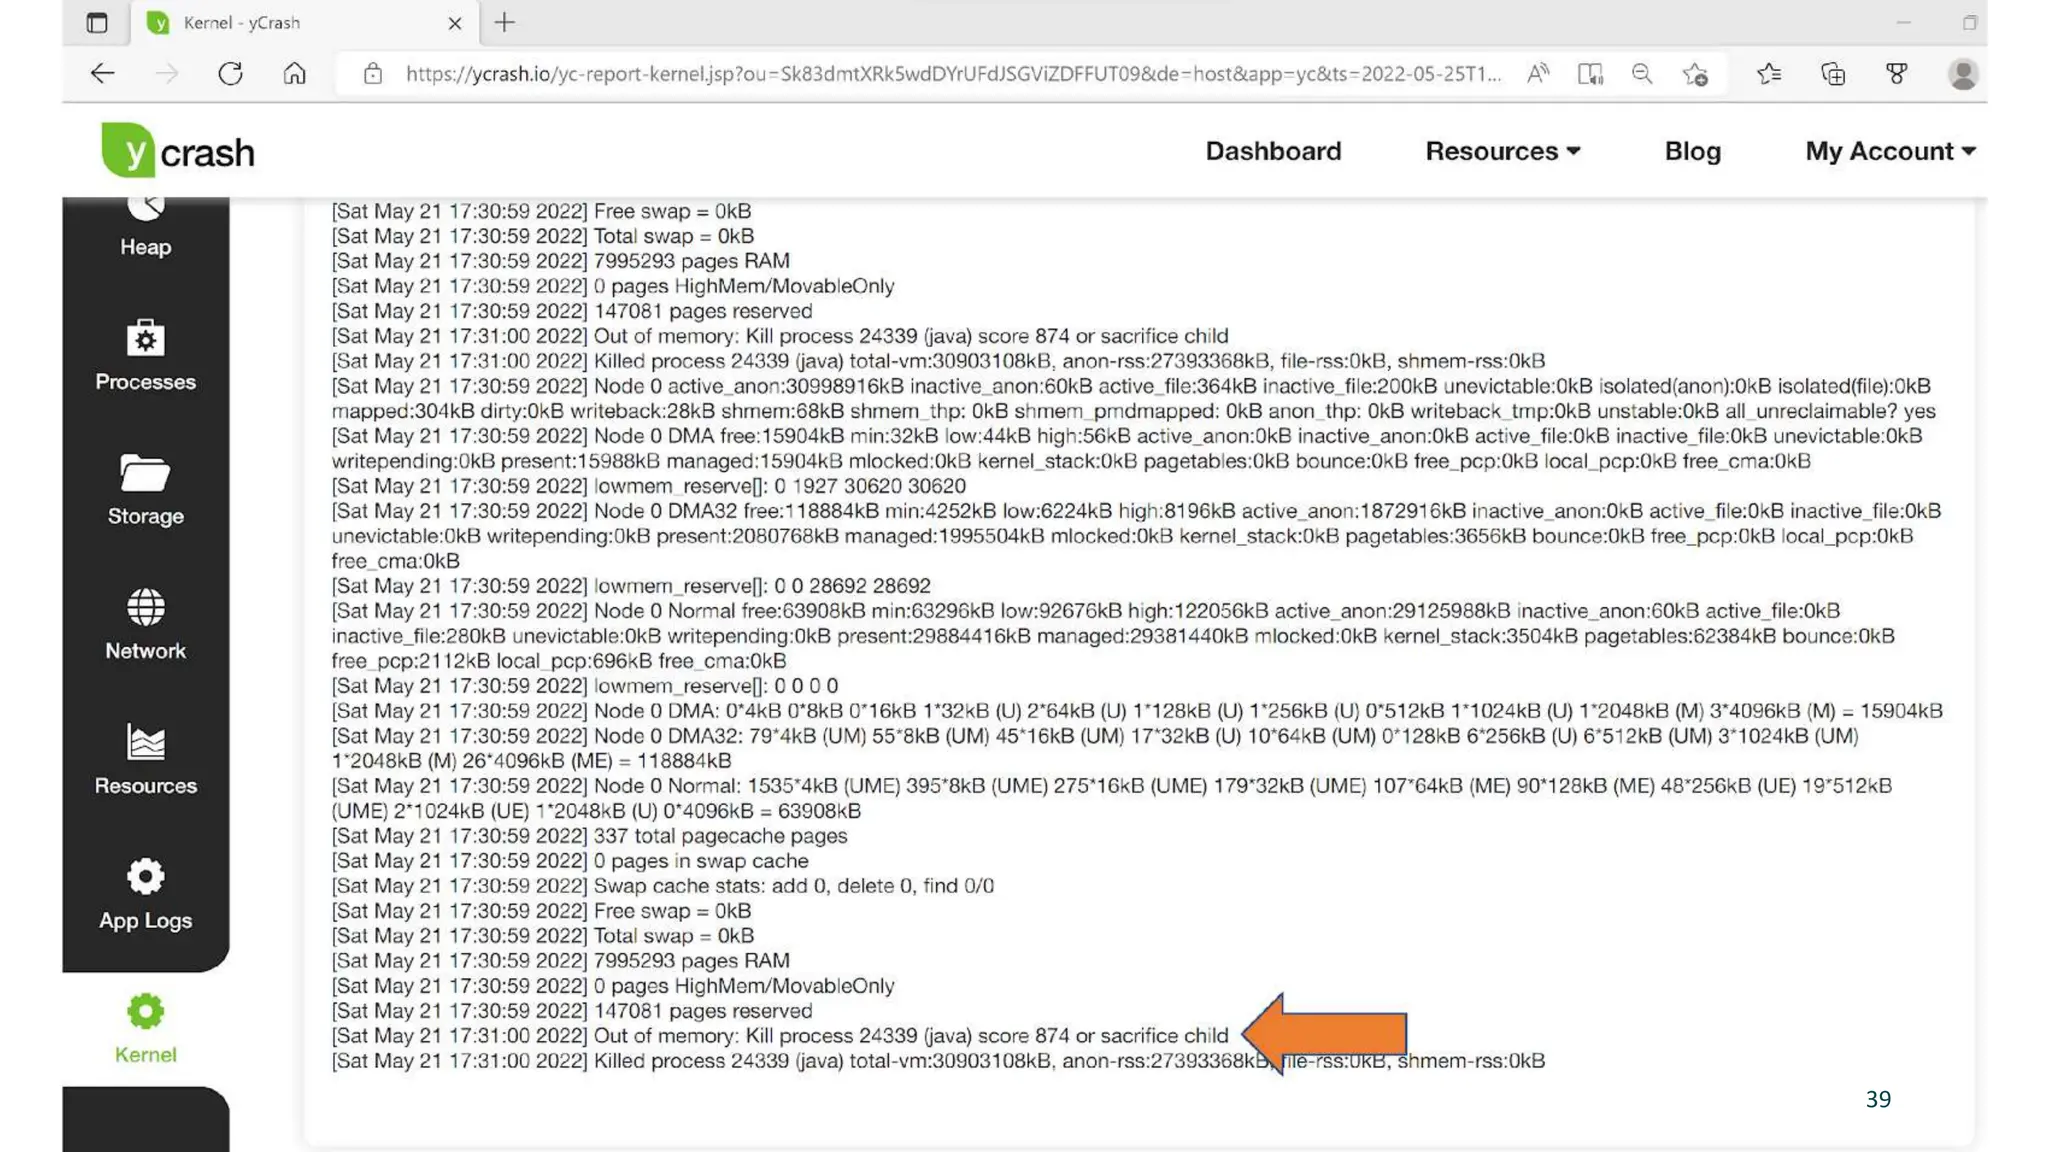
Top 5 Production
Performance
Problems
Ram Lakshmanan
Architect yCrash
Top 5 Performance problems
What you will be learning?
2
Real case studies with Real data
Most efficient way to troubleshoot these problems
3
Backend Slowdown
Application Architecture
JDBC
SOAP
MainFrame
REST
Server Thread Pool
Application Server
HTTP(S) request
4
Application Architecture
JDBC
SOAP
MainFrame
REST
Server Thread Pool
Application Server
HTTP(S) request
5
1. GC Log
10. netstat
12. vmstat
2. Thread Dump
9. dmesg
3. Heap Dump
6. ps
8. Disk Usage
5. top 13. iostat
11. ping
14. Kernel Params
15. App Logs
16. metadata
4. Heap Substitute
7. top -H
6
Open-source script:
https://github.com/ycrash/yc-data-script
360° Data
1 2
3
1 Timestamp at which thread dump was triggered
2 JVM Version info
3 Thread Details - <<details in following slides>>
7
1 2 3 4 5
6
7
1 Thread Name - InvoiceThread-A996
2 Priority - Can have values from 1 to 10
3 Thread Id - 0x00002b7cfc6fb000 – Unique ID assigned by JVM. It's returned by calling the Thread.getId() method.
4 Native Id - 0x4479 - This ID is highly platform dependent. On Linux, it's the pid of the thread. On Windows, it's simply the OS-level thread ID with
a process. On Mac OS X, it is said to be the native pthread_t value.
5 Address space - 0x00002b7d17ab8000 -
6 Thread State - RUNNABLE
7 Stack trace -
8
How to analyze Thread dump?
https://www.ibm.com/support/pages
/ibm-thread-and-monitor-dump-
analyzer-java-tmda
IBM TDMA
FastThread
https://fastthread.io/
03
02
https://tinyurl.com/wq95weo
Sample thread
report
yCrash
https://ycrash.io/
01
9
10
Case Study
Backend Slowdown in a Major
Financial Institution in N.
America
OutOfMemoryError
11
12
Memory Leak Program
Open Source app to simulate Performance Problems
BuggyApp
MemoryLeakDemo
Object1
Object2
MapManager
Key1 Large String…1
Key2 Large String…2
key3 Large String…3
:
:
KeyN Large String…N
myMap
14
Healthy Application
15
Acute Memory Leak
16
Memory Leak
1. GC Log
10. netstat
12. vmstat
2. Thread Dump
9. dmesg
3. Heap Dump
6. ps
8. Disk Usage
5. top 13. iostat
11. ping
14. Kernel Params
15. App Logs
16. metadata
4. Heap Substitute
7. top -H
17
Open-source script:
https://github.com/ycrash/yc-data-script
360° Data
How to analyze Heap dump?
jhat (oracle.com)
Jhat
Eclipse MAT
https://www.eclipse.org/mat
HeapHero
https://heaphero.io/
04
03
02
https://tinyurl.com/5sxz7dsr
Sample heap report
yCrash
https://ycrash.io/
01
18
CPU Spike
19
top –H –p <PROCESS_ID>’
Secrete Option:
20
We all might have used ‘top’
1. GC Log
10. netstat
12. vmstat
2. Thread Dump
9. dmesg
3. Heap Dump
6. ps
8. Disk Usage
5. top 13. iostat
11. ping
14. Kernel Params
15. App Logs
16. metadata
4. Heap Substitute
7. top -H
21
Open-source script:
https://github.com/ycrash/yc-data-script
360° Data
Case Study
Major Trading app in N.
America
https://blog.fastthread.io/2020/04/23/troubleshooting-cpu-spike-in-a-major-trading-application/
22
Garbage Collection
23
What is Garbage?
HTTP Request
Objects
Memory
Garbage
24
25
3-4 Decades ago
Developer
Writes code to Manually evict Garbage
JVM
Automatically evicts Garbage
Now
How are objects Garbage Collected?
Evolution: Manual -> Automatic
26
Automatic GC sounds good right?
Yes, but for
GC pauses CPU consumption
Open-source script:
https://github.com/ycrash/yc-data-script
1. GC Log
10. netstat
12. vmstat
2. Thread Dump
9. dmesg
3. Heap Dump
6. ps
8. Disk Usage
5. top 13. iostat
11. ping
14. Kernel Params
15. App Logs
16. metadata
4. Heap Substitute
7. top -H
27
360° Data
How to analyze GC Log?
https://developer.ibm.co
m/javasdk/tools/
IBM GC & Memory visualizer
GCeasy
yCrash
https://gceasy.io/
Google Garbage cat (cms)
https://code.google.com/
archive/a/eclipselabs.org/
p/garbagecat
HP Jmeter
https://h20392.www2.hpe
.com/portal/swdepot/displ
ayProductInfo.do?produc
tNumber=HPJMETER
03
02
01
05
04
https://ycrash.io/
28
29
Case Study
Long GC Pauses in Top Cloud hosting
Provider
https://blog.gceasy.io/2022/03/04/garbage-collection-tuning-success-story-reducing-young-gen-size/
How does 96% GC Throughput sound?
1 day = 1440 Minutes (i.e., 24 hours x 60 minutes)
96% GC Throughput means app pausing for 57.6
minutes/day 30
What is GC Throughput?
Amount of time application spends in processing customer
transactions
vs
Amount of time application spends in processing garbage
collection activity
Concurrency Issues
31
public void synchronized getData() {
doSomething();
}
Thread 1
Thread 2
Thread 1
BLOCKED THREADS
BLOCKED thread state
32
Case Study
Major Leisure Travel Service
Provider
https://blog.fastthread.io/2020/04/23/troubleshooting-cpu-spike-in-a-major-trading-application/
33
34
Environmental Issues
Bonus
Case Study
Intermittent HTTP 502 errors in
AWS EBS Service
35
EBS Architecture
36
Clue: Nginx Error
37
1. GC Log
10. netstat
12. vmstat
2. Thread Dump
9. dmesg
3. Heap Dump
6. ps
8. Disk Usage
5. top 13. iostat
11. ping
14. Kernel Params
15. App Logs
16. metadata
4. Heap Substitute
7. top -H
38
Open-source script:
https://github.com/ycrash/yc-data-script
360° Data
39
Ram Lakshmanan ram@tier1app.com
@tier1app https://www.linkedin.com/company/ycrash
This deck will be published in:
https://blog.ycrash.io
Learn to troubleshoot like a pro with my online training program
40
THANK YOU
FRIENDS

Top-5-production-devconMunich-2023.pptx

  • 1.
    Top 5 Production Performance Problems RamLakshmanan Architect yCrash
  • 2.
    Top 5 Performanceproblems What you will be learning? 2 Real case studies with Real data Most efficient way to troubleshoot these problems
  • 3.
  • 4.
    Application Architecture JDBC SOAP MainFrame REST Server ThreadPool Application Server HTTP(S) request 4
  • 5.
    Application Architecture JDBC SOAP MainFrame REST Server ThreadPool Application Server HTTP(S) request 5
  • 6.
    1. GC Log 10.netstat 12. vmstat 2. Thread Dump 9. dmesg 3. Heap Dump 6. ps 8. Disk Usage 5. top 13. iostat 11. ping 14. Kernel Params 15. App Logs 16. metadata 4. Heap Substitute 7. top -H 6 Open-source script: https://github.com/ycrash/yc-data-script 360° Data
  • 7.
    1 2 3 1 Timestampat which thread dump was triggered 2 JVM Version info 3 Thread Details - <<details in following slides>> 7
  • 8.
    1 2 34 5 6 7 1 Thread Name - InvoiceThread-A996 2 Priority - Can have values from 1 to 10 3 Thread Id - 0x00002b7cfc6fb000 – Unique ID assigned by JVM. It's returned by calling the Thread.getId() method. 4 Native Id - 0x4479 - This ID is highly platform dependent. On Linux, it's the pid of the thread. On Windows, it's simply the OS-level thread ID with a process. On Mac OS X, it is said to be the native pthread_t value. 5 Address space - 0x00002b7d17ab8000 - 6 Thread State - RUNNABLE 7 Stack trace - 8
  • 9.
    How to analyzeThread dump? https://www.ibm.com/support/pages /ibm-thread-and-monitor-dump- analyzer-java-tmda IBM TDMA FastThread https://fastthread.io/ 03 02 https://tinyurl.com/wq95weo Sample thread report yCrash https://ycrash.io/ 01 9
  • 10.
    10 Case Study Backend Slowdownin a Major Financial Institution in N. America
  • 11.
  • 12.
    12 Memory Leak Program OpenSource app to simulate Performance Problems BuggyApp
  • 13.
    MemoryLeakDemo Object1 Object2 MapManager Key1 Large String…1 Key2Large String…2 key3 Large String…3 : : KeyN Large String…N myMap
  • 14.
  • 15.
  • 16.
  • 17.
    1. GC Log 10.netstat 12. vmstat 2. Thread Dump 9. dmesg 3. Heap Dump 6. ps 8. Disk Usage 5. top 13. iostat 11. ping 14. Kernel Params 15. App Logs 16. metadata 4. Heap Substitute 7. top -H 17 Open-source script: https://github.com/ycrash/yc-data-script 360° Data
  • 18.
    How to analyzeHeap dump? jhat (oracle.com) Jhat Eclipse MAT https://www.eclipse.org/mat HeapHero https://heaphero.io/ 04 03 02 https://tinyurl.com/5sxz7dsr Sample heap report yCrash https://ycrash.io/ 01 18
  • 19.
  • 20.
    top –H –p<PROCESS_ID>’ Secrete Option: 20 We all might have used ‘top’
  • 21.
    1. GC Log 10.netstat 12. vmstat 2. Thread Dump 9. dmesg 3. Heap Dump 6. ps 8. Disk Usage 5. top 13. iostat 11. ping 14. Kernel Params 15. App Logs 16. metadata 4. Heap Substitute 7. top -H 21 Open-source script: https://github.com/ycrash/yc-data-script 360° Data
  • 22.
    Case Study Major Tradingapp in N. America https://blog.fastthread.io/2020/04/23/troubleshooting-cpu-spike-in-a-major-trading-application/ 22
  • 23.
  • 24.
    What is Garbage? HTTPRequest Objects Memory Garbage 24
  • 25.
    25 3-4 Decades ago Developer Writescode to Manually evict Garbage JVM Automatically evicts Garbage Now How are objects Garbage Collected? Evolution: Manual -> Automatic
  • 26.
    26 Automatic GC soundsgood right? Yes, but for GC pauses CPU consumption
  • 27.
    Open-source script: https://github.com/ycrash/yc-data-script 1. GCLog 10. netstat 12. vmstat 2. Thread Dump 9. dmesg 3. Heap Dump 6. ps 8. Disk Usage 5. top 13. iostat 11. ping 14. Kernel Params 15. App Logs 16. metadata 4. Heap Substitute 7. top -H 27 360° Data
  • 28.
    How to analyzeGC Log? https://developer.ibm.co m/javasdk/tools/ IBM GC & Memory visualizer GCeasy yCrash https://gceasy.io/ Google Garbage cat (cms) https://code.google.com/ archive/a/eclipselabs.org/ p/garbagecat HP Jmeter https://h20392.www2.hpe .com/portal/swdepot/displ ayProductInfo.do?produc tNumber=HPJMETER 03 02 01 05 04 https://ycrash.io/ 28
  • 29.
    29 Case Study Long GCPauses in Top Cloud hosting Provider https://blog.gceasy.io/2022/03/04/garbage-collection-tuning-success-story-reducing-young-gen-size/
  • 30.
    How does 96%GC Throughput sound? 1 day = 1440 Minutes (i.e., 24 hours x 60 minutes) 96% GC Throughput means app pausing for 57.6 minutes/day 30 What is GC Throughput? Amount of time application spends in processing customer transactions vs Amount of time application spends in processing garbage collection activity
  • 31.
  • 32.
    public void synchronizedgetData() { doSomething(); } Thread 1 Thread 2 Thread 1 BLOCKED THREADS BLOCKED thread state 32
  • 33.
    Case Study Major LeisureTravel Service Provider https://blog.fastthread.io/2020/04/23/troubleshooting-cpu-spike-in-a-major-trading-application/ 33
  • 34.
  • 35.
    Case Study Intermittent HTTP502 errors in AWS EBS Service 35
  • 36.
  • 37.
  • 38.
    1. GC Log 10.netstat 12. vmstat 2. Thread Dump 9. dmesg 3. Heap Dump 6. ps 8. Disk Usage 5. top 13. iostat 11. ping 14. Kernel Params 15. App Logs 16. metadata 4. Heap Substitute 7. top -H 38 Open-source script: https://github.com/ycrash/yc-data-script 360° Data
  • 39.
  • 40.
    Ram Lakshmanan ram@tier1app.com @tier1apphttps://www.linkedin.com/company/ycrash This deck will be published in: https://blog.ycrash.io Learn to troubleshoot like a pro with my online training program 40 THANK YOU FRIENDS

Editor's Notes

  • #11 http://localhost:8080/yc-report.jsp?ou=SAP&de=198.134.23.1&app=yc&ts=2023-06-11T22-56-32
  • #13 http://localhost:8080/yc-report.jsp?ou=SAP&de=198.134.23.1&app=yc&ts=2023-06-11T22-56-32
  • #14 http://localhost:8080/yc-report.jsp?ou=SAP&de=198.134.23.1&app=yc&ts=2023-06-11T22-56-32
  • #18 http://localhost:8080/yc-load-report-hd?isWCReport=true&ou=SAP&de=192.168.17.183&app=yc&ts=2023-10-05T07-38-13
  • #19 http://localhost:8080/yc-load-report-hd?isWCReport=true&ou=SAP&de=192.168.17.183&app=yc&ts=2023-10-05T07-38-13
  • #23 http://localhost:8080/yc-load-report-ft?ou=SAP&de=32.123.89.12&app=yc&ts=2023-06-11T23-54-10
  • #30 http://localhost:8080/yc-load-report-gc?ou=SAP&de=145.23.82.1&app=yc&ts=2023-06-11T23-03-50 http://localhost:8080/yc-load-report-gc?ou=SAP&de=193.45.89.12&app=yc&ts=2023-06-11T23-09-10
  • #34 http://localhost:8080/yc-report.jsp?ou=SAP&de=90.21.123.19&app=yc&ts=2023-12-03T19-11-33
  • #40 https://test.ycrash.io/yc-report-kernel.jsp?ou=czlWbG0rUko0UXAxazlSbjZrSUIwUT09&de=172.31.7.106&app=yc&ts=2023-09-01T10-25-39