This study examined the relationship between a "triple low" state of low mean arterial pressure, low bispectral index, and low minimum alveolar concentration of volatile anesthesia with hospital length of stay and 30-day mortality in 24,120 patients. The study found that the occurrence of a triple low state was associated with significantly increased length of stay and mortality risk compared to patients without a triple low. Mortality risk increased progressively with longer durations spent in the triple low state.
2. A Triple Low of MAP, BIS, and MAC
Conclusions: The occurrence of low MAP during low In our initial analysis, we defined a reference state consist-
MAC fraction was a strong and highly significant predictor ing of patients whose average MAP, BIS, and MAC values
for mortality. When these occurrences were combined with were each within one SD of the population means. The
low BIS, mortality risk was even greater. The values defining remaining patients were classified into nonoverlapping
the triple low state were well within the range that many groups characterized by whether the case average MAP, BIS,
anesthesiologists tolerate routinely. and MAC values were greater or less than the population
average for each variable. Subsequently, we evaluated the
association between cumulative minutes in the triple low
T HERE is increasing evidence that intraoperative anes-
thetic management influences long-term outcomes.
For example, perioperative outcomes are improved by main-
condition, defined by MAP less than 75 mmHg, BIS less
than 45, and MAC less than 0.80, and excess length of stay
taining intraoperative normothermia,1 guided fluid manage- and relative risk of 30-day mortality.
ment,2– 4 minimizing blood transfusion,5,6 and possibly re-
stricting the storage time of transfused blood.7 Two Materials and Methods
additional factors have been independently associated with The Cleveland Clinic Perioperative Health Documentation
postoperative mortality: low mean arterial pressure (MAP) System is a clinical registry that includes the entire electronic
and deep hypnotic level.8 anesthesia record, data from various administrative data-
There are various ways to characterize hypnotic level dur- bases, and portions of the electronic medical record. Periop-
ing general anesthesia, with electroencephalographic analysis erative variables were collected prospectively concurrently
being the most common. The best validated of these ap- with patient care from our electronic anesthesia record and
proaches is the Bispectral Index (BIS). BIS values range from other electronic systems. Mortality status was obtained from
0 to 100, with 100 indicating full alertness and values less the United States Social Security Death Index. Use of the
than 45 indicating deep anesthesia; optimal intraoperative perioperative registry for this retrospective cohort analysis
BIS values are thought to range from 45 to 60.9 Deep hyp- was approved by the Institutional Review Board, Cleveland
nosis, characterized by cumulative time with BIS less than Clinic, Cleveland, Ohio.
45, has been independently associated with poor postopera- We included patients (Ն16 yr old) who had noncardiac
tive outcomes in a number of higher risk populations, in- surgery at the Cleveland Clinic Main Campus between Jan-
cluding the elderly,10 patients with cancer,11 those undergo- uary 6, 2005, and December 31, 2009. Patients were in-
ing cardiac procedures,12 and those at risk for intraoperative cluded in our analysis when they had BIS monitoring and a
awareness.10 single volatile anesthetic identified by nonzero concentra-
Volatile anesthetics reduce myocardial contractility and tions of only one agent from incision to end of case. Total
are vasodilators; thus, they provoke dose-dependent hypo- intravenous anesthesia cases were identified when all three
tension. Intraoperative MAP typically is maintained at ap- volatile agents had zero concentration from incision to end of
proximately 85 mmHg, but values range widely among pa- case and nonzero propofol recorded on the electronic record
tients and procedures. Low intraoperative MAP is associated during the same period. When a given patient had more than
with increased risk of stroke,13,14 myocardial infarction,15 one operation on different days, only data from the most
and 1-year mortality.8,10 recent surgical date was included. We also excluded emer-
The potency of a volatile anesthetic is characterized by its gency surgery and cases lacking essential clinical or endpoint
minimum alveolar concentration (MAC), which is the alve- information.
olar partial pressure at which 50% of patients move in re- General anesthesia for adult noncardiac surgery at the
sponse to skin incision. MAC varies among anesthetics, but Cleveland Clinic usually is induced with a small amount of
the MAC fraction accurately characterizes relative dose for fentanyl (typically 100 –150 g) and propofol (1–3 mg/kg);
any volatile anesthetic. Anesthesia usually is administered to anesthesia usually is then maintained with a volatile anes-
achieve an initial target expired MAC, and is then adjusted thetic in a mixture of air and oxygen with only a small
based on patient hemodynamic responses. amount of additional opioid if needed. However, the Cleve-
The expected response to high MAC fractions of anes- land Clinic is a large teaching institution, so of course there is
thetics is hypotension and lower BIS values (indicating considerable patient-to-patient variability in anesthetic man-
deeper hypnosis and suppression of brain electrical activity). agement based on provider preference.
In contrast, low MAP and/or BIS in patients receiving low
anesthetic MAC fractions is atypical and may help identify Data Extraction and Analysis
patients who are unusually sensitive to anesthesia and at risk Mean arterial pressure, BIS, and end-tidal volatile anesthetic
for complications. Thus, the combination of low MAP, BIS, concentration, propofol use, duration of hospitalization, and
and MAC (a “triple low”) may be associated with especially 30-day all-cause mortality were extracted from the registry.
poor outcomes. We tested the hypothesis that a triple low of We also extracted age, sex, body mass index, American Soci-
MAP, BIS, and MAC is associated with prolonged duration ety of Anesthesiologists Physical Status scores, and Interna-
of hospitalization and increased 30-day all-cause mortality. tional Classification of Diseases, version 9 billing codes.
Anesthesiology 2012; 116:1195–1203 1196 Sessler et al.
3. PERIOPERATIVE MEDICINE
Mean arterial pressure values were recorded at 1-min in- single triple low category when each value was less than the
tervals when an arterial catheter was used, as it was in approx- reference threshold.
imately one half the cases; blood pressures were otherwise Cox proportional hazards regression was used to create a
recorded oscillometrically at intervals of 2–5 min. MAP val- model to predict 30-day postoperative mortality. Similarly,
ues were assumed to be artifactual and were excluded when logistic regression was used to create a model to predict
the recorded value was less than 30 mmHg or more than 250 whether a patient’s postoperative hospital length of stay
mmHg. BIS values were recorded at 1-minute intervals in would be longer (or not) than expected compared with the
more recent cases (41% of the total) or at 15-min intervals in diagnostic related group-adjusted national average length of
older cases. The BIS and MAP values assigned to a given stay for the primary surgery as identified from the stay-based
minute were the most recent values within the past 20 min administrative record (ClinTrac, 3M, Minneapolis, MN).
and were otherwise considered to be missing. Each model included a single state variable based on case-
Minimum alveolar concentration equivalents were calcu- average MAP, BIS, and MAC and also identified significant
lated from end-tidal volatile anesthetic partial pressures using predictors (using forward conditional selection) from among
a 1 MAC-equivalent concentration of desflurane (6.6%), demographic predictors (age, gender, race, body mass index,
sevoflurane (1.8%), and isoflurane (1.17%).16 Nitrous oxide American Society of Anesthesiologists Physical Status); intra-
use is recorded in our registry, but for technical reasons the operative factors (case-average estimates of blood concentra-
concentration is not; thus, nitrous oxide was not included in tion of propofol and fentanyl equivalents, estimated blood
our calculation of MAC fraction. However, in our case-based loss and administered erythrocyte volume, a variable indicat-
modeling, we included a binary variable indicating whether ing maintenance agent type (isoflurane, sevoflurane, desflu-
nitrous oxide was used in the procedure, and we attempted to rane), a binary variable indicating whether nitrous oxide was
account for the MAC-sparing effect of opioids and residual used or not in the procedure, case duration); and compo-
propofol by including case-average estimates of the effect-site nents of the Risk Stratification Indices for 30-day mortality
concentration‡‡ of fentanyl equivalents and propofol in our and LOS (composite risk stratifications from International
models. Classification of Diseases, version 9 diagnosis and procedure
The principal procedure was identified from Interna- codes17) ranked in quintiles. P Ͻ 0.05 was considered statis-
tional Classification of Diseases, version 9 billing codes and tically significant.
classified into the following surgical groups: general, gyne-
cology, urology, neurology, orthopedic, abdominal, head Time-based Analysis
and neck, vascular, thoracic, and other. Body mass index was Averaging values over an entire case can conceal potentially
divided into quintiles. Race was classified as into three tiers: important short periods of concomitant low MAP, BIS, and
Caucasian, African American, or Other. We also classified MAC. Thus, we conducted a second analysis based on cu-
age into 6 decade levels: Յ40, 41–50, 51– 60, 61–70, 71– mulative minutes in the triple low condition for each patient,
80, Ͼ80 yr. The American Society of Anesthesiologists Phys- with no requirement that the minutes be contiguous.
ical Status was grouped into scores of 1 and 2 versus Ն3. In the case-based analysis, thresholds were defined by the
population means. For the cumulative duration analysis, we
constructed three-dimensional plots of mortality as a function
Case-based Analysis
of cumulative minutes at different MAP and BIS thresholds at
For each included patient, we calculated average MAP, BIS,
various MAC fractions. This analysis suggested that triple low
and MAC from the beginning to end of anesthesia. We de-
thresholds of MAP less than 75 mmHg, BIS less than 45, and
fined a reference state consisting of patients whose average
MAC less than 0.8 discriminated well between patients who
MAP, BIS, and MAC values were each within one SD of the
survived 30 postoperative days and those who did not. In choos-
population means (the data were nearly normally distrib-
ing these thresholds, we considered values that might provide a
uted). The remaining patients were classified into nonover-
high potential for reduced mortality without an excessive num-
lapping groups characterized by whether the case average
ber of “false alarms.” Thus, we used these values for our formal
MAP, BIS, and MAC values were greater or less than the
analysis of cumulative minutes under triple low conditions.
population average for each variable.
Cumulative (not necessarily contiguous) minutes in a tri-
State categories were defined relative to the average refer-
ple low state (MAP less than 75 mmHg, BIS less than 45, and
ence threshold for each variable. Single lows were when pa-
MAC fraction less than 0.8) were calculated for each patient.
tients exhibited any one of the three single low case-based
Patients were partitioned into groups based on their cumu-
averages of MAP, BIS, or MAC. Patients were assigned to
lative triple low state duration: 0, 1–15, 16 –30, 31– 45, 46 –
one of three double low categories when two of the three
60, and more than 60 min. Analysis of variance was used to
MAP, BIS, and MAC values were less than their respective
test whether the incidence of mortality and excess length of
reference thresholds. Similarly, patients were assigned to the stay were statistically significantly different between duration
‡‡ STANPUMP program. Available at http:/www/opentci.org/ groups. P Ͻ 0.05 (after Bonferroni correction for multiple
doku.php?idϭstart. Accessed April 13, 2012. comparisons) was considered statistically significant.
Anesthesiology 2012; 116:1195–1203 1197 Sessler et al.
4. A Triple Low of MAP, BIS, and MAC
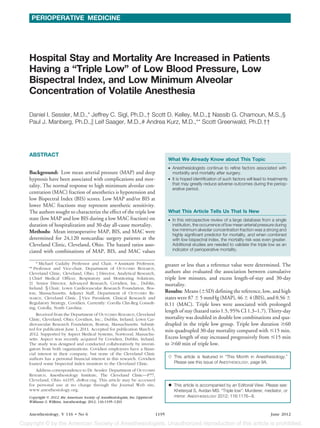
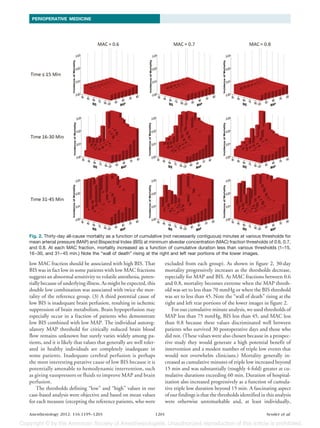
Table 1. Combinations of Low MAP, BIS, and MAC and 30-day Mortality and Length of Hospital Stay
MAP BIS MAC MAP 30-day Excess
State State State N (mmHg) BIS MAC Mortality (%) LOS (%)
REF REF REF 8,034 87 46 0.56 0.5 26.1
High High Low 1,653 96 56 0.38 1.1 27.9
Low High High 2,070 78 54 0.72 0.4 26.1
High Low High 2,985 97 39 0.72 0.2 23.9
Low High Low 2,332 77 56 0.38 1.6 29.7
High Low Low 1,782 97 38 0.39 1.0 28.7
Low Low High 1,798 79 39 0.72 1.0 27.9
High High High 1,971 96 53 0.73 0.5 23.2
Low Low Low 1,495 78 38 0.37 2.9 35.2
Among 24,120 qualifying patients, the authors defined a reference population consisting of patients whose individual MAP, BIS, and
MAC fractions from the beginning to end of anesthesia were within 1 SD of the average. The remaining patients were classified into
nonoverlapping groups characterized by whether average MAP, BIS, and MAC values were greater or less than the average for each
variable. State categories were defined relative to average for each variable. Single lows were any of the three single low case-based
averages of MAP, BIS, or MAC. Patients were assigned to one of three double low categories when two of the three MAP, BIS, and MAC
values were below the lower boundary of the reference group. Similarly, patients were assigned to the single triple low category when
each value was below the lower reference threshold. The averages that define the reference state and low and high values were 87 Ϯ
5.3 mmHg for MAP, 46 Ϯ 3.9 for BIS, and a MAC-fraction of 0.56 Ϯ 0.11. Within each category, MAP, BIS, and MAC are presented
as mean Ϯ SD. Excess LOS is the binary indicator of whether hospital length of stay was in excess of DRG-predicted length of stay.
* P Ͻ 0.05 compared with reference state (typical cases).
BIS ϭ Bispectral Index; DRG ϭ diagnostic related group; LOS ϭ length of stay; MAC ϭ minimum alveolar concentration; MAP ϭ mean
arterial pressure; REF ϭ reference group (mean Ϯ 1 SD for all three variables: MAP, BIS, and MAC).
Results a roughly 2-fold mortality increase, with mortality being sig-
nificantly increased for two of the three combinations. Mor-
Among the 103,324 surgical procedures in our registry at the tality in the triple low group was quadrupled (table 1). The
time of analysis, we excluded 28,231 because only the most relative risks for mortality in each group are shown in figure
recent surgery was considered for each patient; 35,686 be- 1. Age-adjusting MAC fractions did not perceptibly alter
cause BIS monitoring was not used; 6,810 because the pri- relative risks; inclusion of nitrous oxide use in the statistical
mary anesthetic was not a single volatile agent; 123 because model also did not substantively alter the results; and finally,
patients were younger than 16 yr old; and 8,354 because of use of a regional block did not have any important effect of
critical missing data. Consequently, 24,120 patients were relative risks (data not shown). Tables 2 and 3 do not con-
available for the case-based analysis. sistently exhibit increased hazard ratios at higher levels of
Among included patients, isoflurane was the volatile an- RSI; this may be due to risk-transference among the variables
esthetic in 27% of the cases, sevoflurane in 45%, and desflu- in the models.
rane in 28%. Nitrous oxide was used in 38% of patients, but
in many or most cases, only briefly during emergence. Over-
all 30-day postoperative mortality was 0.8%; most deaths Time-based Analysis
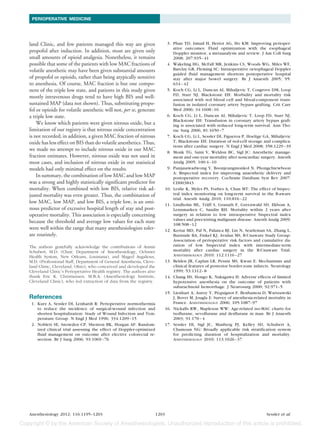
(0.5%) occurred in the hospital. An additional 5,188 pa- We first plotted 30-day all-cause mortality as a function of
tients were omitted from the length-of-stay analyses because cumulative (not necessarily contiguous) minutes at various
they were outpatients. thresholds for MAP and BIS at MAC fraction thresholds of
0.6, 0.7, and 0.8. At each MAC fraction, mortality increased
as a function of cumulative duration at lower MAP and BIS
Case-based Analysis thresholds. At cumulative durations exceeding 15 min, mor-
The averages that define the reference state and low and high tality increased substantially when the MAP threshold was
values were 87 Ϯ 5 mmHg for MAP, 46 Ϯ 4 for BIS, and a less than 70 mmHg and the BIS threshold was less than 45;
MAC fraction of 0.56 Ϯ 0.11 (table 1). Approximately 6% the combination of the two was especially associated with
of the patients were categorized as exhibiting a case average increased mortality (fig. 2).
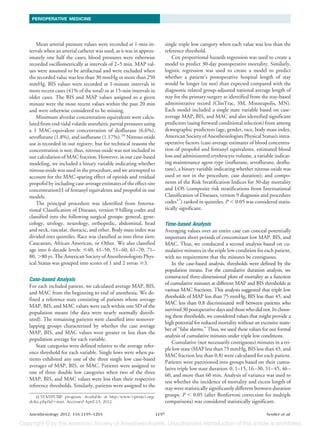
triple low condition. The numbers of patients spending 0, 1–15, 16 –30, 31–
The triple low combination was associated with the larg- 45, 46 – 60, and more than 60 min in the triple low state
est risk of a significantly prolonged length of stay (relative (MAP less than 75 mmHg, BIS less than 45, and MAC
risk [hazard ratio] 1.5, 95% CI 1.3–1.7; table 2). Triple high fraction less than 0.80) were 8,691, 7,858, 3,536, 1,573,
values were not associated with a significant increase in 30- 907, and 1,555, respectively. Thirty-day all-cause mortality
day mortality (table 3). The only single low value that was was significantly increased from baseline (no triple low min-
associated with increased mortality was low MAC. In con- utes) when cumulative triple low duration was 31– 45 min
trast, all three double low combinations were associated with and when it exceeded 60 min (fig. 3).
Anesthesiology 2012; 116:1195–1203 1198 Sessler et al.
5. PERIOPERATIVE MEDICINE
Table 2. Model of Excess Length of Stay
Model Variable Hazard Ratio (95% CI) Significance
MAP/BIS/MAC state Ͻ0.001
REF 1.0
High/High/Low 1.110 (0.950–1.296) 0.188
Low/High/High 0.969 (0.850–1.104) 0.632
High/Low/High 0.950 (0.849–1.063) 0.370
Low/High/Low 1.139 (1.001–1.297) 0.050
High/Low/Low 1.208 (1.047–1.394) 0.009
Low/Low/High 1.078 (0.941–1.236) 0.278
High/High/High 0.903 (0.791–1.030) 0.129
Low/Low/Low 1.470 (1.268–1.704) Ͻ0.001
Age Ͻ0.001
Յ40 yr (reference) 1.0
41–50 yr 1.006 (0.888–1.141) 0.922
51–60 yr 1.044 (0.928–1.174) 0.476
61–70 yr 1.106 (0.980–1.248) 0.101
71–80 yr 1.326 (1.160–1.516) Ͻ0.001
Ն81 yr 1.512 (1.276–1.792) Ͻ0.001
Gender
Male (reference) 1.0
Female 1.147 (1.069–1.230) Ͻ0.001
Race Ͻ0.001
White (reference) 1.0
African-American 1.381 (1.244–1.533) Ͻ0.001
Other 1.211 (1.013–1.448) 0.035
BMI (kg/m2) 1.011 (1.007–1.015) Ͻ0.001
ASA Physical Status
1 and 2 (reference) 1.0
3, 4, and 5 1.237 (1.142–1.340) Ͻ0.001
N2O administered?
No (reference) 1.0
Yes 1.171 (1.087–1.262) 0.001
Mean propofol rate (g/h) 0.977 (0.964–0.990) Ͻ0.001
Case duration (min) 1.099 (1.079–1.120) Ͻ0.001
Maintenance agent 0.007
Isoflurane (reference) 1.0
Sevoflurane 1.090 (1.002–1.186) 0.044
Desflurane 0.955 (0.871–1.048) 0.332
RSI (length of stay); total procedure risk Ͻ0.001
Lowest quintile (reference) 1.0
Second quintile 0.731 (0.666–0.803) Ͻ0.001
Third quintile 0.631 (0.568–0.702) Ͻ0.001
Fourth quintile 0.487 (0.435–0.544) Ͻ0.001
Highest quintile 0.512 (0.440–0.596) Ͻ0.001
RSI (length of stay); total cancer risk Ͻ0.001
Lowest quintile (reference) 1.0
Second through fourth quintiles* 1.274 (1.168–1.391) Ͻ0.001
Highest quintile 2.135 (1.585–2.877) Ͻ0.001
RSI (length of stay); total noncancer risk Ͻ0.001
Lowest quintile (reference) 1.0
Second quintile 0.443 (0.402–0.489) Ͻ0.001
Third quintile 0.384 (0.345–0.427) Ͻ0.001
Fourth quintile 0.378 (0.337–0.424) Ͻ0.001
Highest quintile 0.484 (0.430–0.543) Ͻ0.001
* Quintiles containing identical values were pooled.
ASA ϭ American Society of Anesthesiologists; BIS ϭ Bispectral Index; BMI ϭ body mass index; MAC ϭ minimum alveolar
concentration; MAP ϭ mean arterial pressure; N2O ϭ nitrous oxide; REF ϭ reference group; RSI ϭ risk stratification index.
The fraction of patients requiring hospitalization for cantly greater than baseline (no triple low minutes) at
longer than the national average for a given procedure all times exceeding 30 min (fig. 4). Inclusion of nitrous
(i.e., excess length of stay) increased significantly as the oxide use in the statistical model did not substantively
duration of triple low minutes increased and was signifi- alter the results.
Anesthesiology 2012; 116:1195–1203 1199 Sessler et al.
6. A Triple Low of MAP, BIS, and MAC
Table 3. Model of 30-day Mortality
Hazard Ratio
Model Variable (95% CI) Significance
MAP/BIS/MAC State Ͻ0.001
REF 1.0
High/High/Low 2.131 (1.217–3.731) 0.008
Low/High/High 0.729 (0.342–1.558) 0.415
High/Low/High 0.397 (0.169–0.933) 0.034
Low/High/Low 2.534 (1.617–3.970) Ͻ0.001
High/Low/Low 1.902 (1.080–3.351) 0.026
Low/Low/High 1.492 (0.852–2.611) 0.161
High/High/High 1.034 (0.503–2.125) 0.927
Low/Low/Low 3.957 (2.567–6.098) Ͻ0.001
ASA Physical Status
1 and 2 (reference) 1.0
3, 4, and 5 2.757 (1.570–4.843) Ͻ0.001
N2O administered?
No (reference) 1.0
Yes 0.545 (0.375–0.793) Ͻ0.001
Mean propofol rate (g/h) 0.814 (0.745–0.890) 0.001 Fig. 1. The authors defined a reference population consisting
RBC administered (l) 1.519 (1.314–1.743) Ͻ0.001 of patients whose individual mean arterial pressure (MAP),
Case duration (min) 0.900 (0.837–0.968) 0.005
Bispectral Index (BIS), and minimum alveolar concentration
RSI (30-day mortality); Ͻ0.001
(MAC) fractions from the beginning to end of anesthesia were
total procedure risk
within one SD of the average. The remaining patients were
Lowest quintile 1.0
classified into nonoverlapping groups characterized by
(reference)
whether average MAP, BIS, and MAC values were greater or
Second quintile 1.599 (0.809–3.159) 0.177
less than the average for each variable. State categories were
Third and fourth 1.154 (0.689–1.934) 0.586
defined relative to average for each variable. The relative risks
quintiles*
and 95% confidence intervals for all-cause 30-day mortality
Highest quintile 2.839 (1.801–4.475) Ͻ0.001
RSI (30-day mortality); are shown for the remaining eight categories of individual low
and high combinations.
total cancer risk
Lowest through 1.0
fourth quintiles* there was no overall association with either mortality or du-
(reference) ration of hospitalization.
Highest quintile 3.103 (2.330–4.133) Ͻ0.001 In contrast to the minimal relationship between mortality
RSI (30-day mortality); Ͻ0.001
and isolated low values of MAP, BIS, and MAC fraction,
total noncancer risk
Lowest quintile 1.0 case-based double lows taken as a group were associated with
(reference) a roughly 2-fold increase in 30-day postoperative mortality.
Second quintile 0.547 (0.165–1.819) 0.325 Mortality was more than quadrupled in patients who dem-
Third quintile 0.287 (0.061–1.359) 0.116 onstrated case-based triple lows. Thus, the combination of
Fourth quintile 1.725 (0.679–4.388) 0.252 low MAP, BIS, and MAC fraction, which occurred in ap-
Highest quintile 8.138 (3.932–16.845) Ͻ0.001
proximately 6% of the study population, was an ominous
* Quintiles containing identical values were pooled. predictor of postoperative mortality.
ASA ϭ American Society of Anesthesiologists; BIS ϭ Bispectral The overall limited association of isolated case average low
Index; MAC ϭ minimum alveolar concentration; MAP ϭ mean MAP, BIS, and MAC fraction suggests that no single mea-
arterial pressure; N2O ϭ nitrous oxide; RBC ϭ erythrocytes;
REF ϭ reference group; RSI ϭ risk stratification index.
sure, with the possible exception of low MAC, is sufficiently
robust to adequately account for patient variability and clin-
ical complexity. For example, consider three potential causes
Discussion
of low BIS: (1) Low BIS is the normal response to generous
Although previous work in certain at-risk populations sug- doses of volatile anesthetics. When high concentrations of
gests that low MAP8,10,13–15 and BIS8,10 –12 are associated volatile anesthetics are given to healthy patients who hemo-
independently with various poor postoperative outcomes, dynamically tolerate large doses, BIS should be low and
including mortality, we did not find that either alone was would not be expected to be associated with poor prognosis.
associated with 30-day mortality in our general population. Our results are consistent with this theory in that isolated low
In fact, isolated low BIS was associated with a (nonsignifi- BIS was associated with a (nonsignificant) reduction in mor-
cant) reduction in mortality. Isolated low MAC fraction, tality. (2) An alternative cause of low BIS is anesthetic sensi-
which is much less studied, was associated with increased tivity. This group is identified by the combination of low BIS
mortality. Considering the three single low groups together, and low MAC fraction. This is an atypical response because
Anesthesiology 2012; 116:1195–1203 1200 Sessler et al.
7. PERIOPERATIVE MEDICINE
Fig. 2. Thirty-day all-cause mortality as a function of cumulative (not necessarily contiguous) minutes at various thresholds for
mean arterial pressure (MAP) and Bispectral Index (BIS) at minimum alveolar concentration (MAC) fraction thresholds of 0.6, 0.7,
and 0.8. At each MAC fraction, mortality increased as a function of cumulative duration less than various thresholds (1–15,
16 –30, and 31– 45 min.) Note the “wall of death” rising at the right and left rear portions of the lower images.
low MAC fraction should be associated with high BIS. That excluded from each group). As shown in figure 2, 30-day
BIS was in fact low in some patients with low MAC fractions mortality progressively increases as the thresholds decrease,
suggests an abnormal sensitivity to volatile anesthesia, poten- especially for MAP and BIS. At MAC fractions between 0.6
tially because of underlying illness. As might be expected, this and 0.8, mortality becomes extreme when the MAP thresh-
double low combination was associated with twice the mor- old was set to less than 70 mmHg or when the BIS threshold
tality of the reference group. (3) A third potential cause of was set to less than 45. Note the “wall of death” rising at the
low BIS is inadequate brain perfusion, resulting in ischemic right and left rear portions of the lower images in figure 2.
suppression of brain metabolism. Brain hypoperfusion may For our cumulative minute analysis, we used thresholds of
especially occur in a fraction of patients who demonstrate MAP less than 75 mmHg, BIS less than 45, and MAC less
low BIS combined with low MAP. The individual autoreg- than 0.8 because these values discriminated well between
ulatory MAP threshold for critically reduced brain blood patients who survived 30 postoperative days and those who
flow remains unknown but surely varies widely among pa- did not. (These values were also chosen because in a prospec-
tients, and it is likely that values that generally are well toler- tive study they would generate a high potential benefit of
ated in healthy individuals are completely inadequate in intervention and a modest number of triple low events that
some patients. Inadequate cerebral perfusion is perhaps would not overwhelm clinicians.) Mortality generally in-
the most interesting putative cause of low BIS because it is creased as cumulative minutes of triple low increased beyond
potentially amenable to hemodynamic intervention, such 15 min and was substantially (roughly 4-fold) greater at cu-
as giving vasopressors or fluids to improve MAP and brain mulative durations exceeding 60 min. Duration of hospital-
perfusion. ization also increased progressively as a function of cumula-
The thresholds defining “low” and “high” values in our tive triple low duration beyond 15 min. A fascinating aspect
case-based analysis were objective and based on mean values of our findings is that the thresholds identified in this analysis
for each measure (excepting the reference patients, who were were otherwise unremarkable and, at least individually,
Anesthesiology 2012; 116:1195–1203 1201 Sessler et al.
8. A Triple Low of MAP, BIS, and MAC
cordance between these two outcomes is not necessarily
inconsistent because patients who die early may have
shorter hospitalizations than comparable patients who re-
cover normally.
One strength of our analysis is that we included more
than 24,000 patients. Thus, we had more than 1,500 pa-
tients in seven of our eight categorical groups of “low” and
“high” combinations and more than 8,000 in the reference
group. It is apparent that starting with a much smaller num-
ber of patients, say 1,000 –2,000, would be inadequate and
result in type 2 statistical errors.
Our approach differs somewhat from previous analyses in
that we extracted a reference group that was within one SD of
the mean for MAP, BIS, and MAC fraction. Our “low” and
Fig. 3. Thirty-day all-cause mortality as a function of cumu- “high” groups thus exclude the most typical patients. The
lative (not necessarily contiguous) minutes in a triple low state extent to which our various low and high groups differ from
(mean arterial pressure [MAP]rsqb] less than 75 mmHg, a simple split at the mean or an arbitrary value depends
Bispectral Index less than 45, and minimum alveolar concen-
critically on the size of the reference group. A larger window,
tration [MAC] fraction less than 0.8). Mortality was signifi-
cantly increased from baseline (no triple low minutes) when say 1.5 SD, would result in smaller low and high groups, but
cumulative triple low duration was 31– 45 min and when it augment differences between low and high pairs for each
exceeded 60 min. measure; conversely, a smaller window would reduce differ-
ences. Using our definition, we identified a high-risk triple
would not concern most anesthesiologists. However, com- low population, based solely on patient response to anesthe-
bined they were strong predictors of prolonged hospitaliza- sia, which represents 6% of the patients undergoing surgery
tion and mortality. at our institution.
Excess duration of hospitalization normally would be Our results indicate that two double low combinations
considered an “intermediate outcome” compared with mor- and a triple low of MAP, BIS, and MAC strongly predict
tality. However, duration of hospitalization was prolonged postoperative mortality. However, as in all registry analyses,
only in the triple low patients and even then not by much. In it is impossible to make causal conclusions from these obser-
contrast, there were substantial and highly clinically impor- vations. Our statistical models were adjusted for baseline
tant mortality differences in patients demonstrating case- comorbidity and procedural intensity using the Risk Strati-
based double and triple lows. However, we note that dis- fication Index.17 Nonetheless, prolonged hospitalization and
increased mortality with double and triple lows to a large
extent surely reflects selection of patients whose underlying
illness makes them susceptible to anesthesia. If comorbidity
is the full explanation, intervention is unlikely to improve
outcome.
However, it is worth considering that components of the
triple low state usually can be controlled with common an-
esthetic interventions. For example, BIS can be increased by
reducing volatile anesthetic administration, and MAP can be
increased by giving vasopressors or fluids. Our time-based
analysis demonstrating a significant association between cu-
mulative duration in the triple low state and increased mor-
tality suggests a target for therapeutic intervention. To the
extent that remaining in a triple low state worsens outcomes,
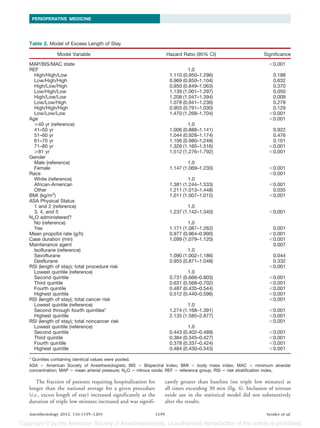
Fig. 4. The fraction of patients requiring excess hospital rather than just predicts bad outcomes, clinician intervention
length of stay (LOS), relative to the national average LOS for in response to triple low events might reduce mortality. This
a type of case, as a function of cumulative (not necessarily theory is being tested in a randomized trial in which clini-
contiguous) minutes in a triple low state (mean arterial pres- cians are alerted (or not) to triple low events (clinical trial
sure [MAP] less than 75 mmHg, Bispectral Index less than 45, NCT00998894). The thresholds for this study are identical
and minimum alveolar concentration [MAC] fraction less than
0.8). The fraction of patients requiring excess LOS increased
to those in the second, time-based, analysis.
significantly as the duration of triple low minutes increased Limitations of our study include that our findings apply
and was significantly greater than baseline (no triple low only to patients who were given volatile anesthesia. Volatile
minutes) at all times exceeding 30 min. anesthesia is by far the most common approach at the Cleve-
Anesthesiology 2012; 116:1195–1203 1202 Sessler et al.
9. PERIOPERATIVE MEDICINE
land Clinic, and few patients managed this way are given 3. Phan TD, Ismail H, Heriot AG, Ho KM: Improving perioper-
ative outcomes: Fluid optimization with the esophageal
propofol after induction. In addition, most are given only Doppler monitor, a metaanalysis and review. J Am Coll Surg
small amounts of opioid analgesia. Nonetheless, it remains 2008; 207:935– 41
possible that some of the patients with low MAC fractions of 4. Wakeling HG, McFall MR, Jenkins CS, Woods WG, Miles WF,
volatile anesthetic may have been given substantial amounts Barclay GR, Fleming SC: Intraoperative oesophageal Doppler
guided fluid management shortens postoperative hospital
of propofol or opioids, rather than being atypically sensitive stay after major bowel surgery. Br J Anaesth 2005; 95:
to anesthesia. Of course, MAC fraction is but one compo- 634 – 42
nent of the triple low state, and patients in this study given 5. Koch CG, Li L, Duncan AI, Mihaljevic T, Cosgrove DM, Loop
mostly intravenous drugs tend to have high BIS and well- FD, Starr NJ, Blackstone EH: Morbidity and mortality risk
associated with red blood cell and blood-component trans-
sustained MAP (data not shown). Thus, substituting propo- fusion in isolated coronary artery bypass grafting. Crit Care
fol or opioids for volatile anesthetic will not, per se, generate Med 2006; 34:1608 –16
a triple low state. 6. Koch CG, Li L, Duncan AI, Mihaljevic T, Loop FD, Starr NJ,
Blackstone EH: Transfusion in coronary artery bypass graft-
We know which patients were given nitrous oxide, but a ing is associated with reduced long-term survival. Ann Tho-
limitation of our registry is that nitrous oxide concentration rac Surg 2006; 81:1650 –7
is not recorded; in addition, a given MAC fraction of nitrous 7. Koch CG, Li L, Sessler DI, Figueroa P, Hoeltge GA, Mihaljevic
oxide has less effect on BIS than do volatile anesthetics. Thus, T, Blackstone EH: Duration of red-cell storage and complica-
tions after cardiac surgery. N Engl J Med 2008; 358:1229 –39
we made no attempt to include nitrous oxide in our MAC
8. Monk TG, Saini V, Weldon BC, Sigl JC: Anesthetic manage-
fraction estimates. However, nitrous oxide was not used in ment and one-year mortality after noncardiac surgery. Anesth
most cases, and inclusion of nitrous oxide in our statistical Analg 2005; 100:4 –10
models had only minimal effect on the results. 9. Punjasawadwong Y, Boonjeungmonkol N, Phongchiewboon
A: Bispectral index for improving anaesthetic delivery and
In summary, the combination of low MAC and low MAP postoperative recovery. Cochrane Database Syst Rev 2007:
was a strong and highly statistically significant predictor for CD003843
mortality. When combined with low BIS, relative risk ad- 10. Leslie K, Myles PS, Forbes A, Chan MT: The effect of bispec-
justed mortality was even greater. Thus, the combination of tral index monitoring on long-term survival in the B-aware
trial. Anesth Analg 2010; 110:816 –22
low MAC, low MAP, and low BIS, a triple low, is an omi-
11. Lindholm ML, Traff S, Granath F, Greenwald SD, Ekbom A,
¨
nous predictor of excessive hospital length of stay and post- Lennmarken C, Sandin RH: Mortality within 2 years after
operative mortality. This association is especially concerning surgery in relation to low intraoperative bispectral index
because the threshold and average low values for each state values and preexisting malignant disease. Anesth Analg 2009;
108:508 –12
were well within the range that many anesthesiologists toler- 12. Kertai MD, Pal N, Palanca BJ, Lin N, Searleman SA, Zhang L,
ate routinely. Burnside BA, Finkel KJ, Avidan MS, B-Unaware Study Group:
Association of perioperative risk factors and cumulative du-
The authors gratefully acknowledge the contributions of Armin ration of low bispectral index with intermediate-term
Schubert, M.D. (Chair, Department of Anesthesiology, Ochsner mortality after cardiac surgery in the B-Unaware Trial.
Health System, New Orleans, Louisiana), and Maged Argalious, ANESTHESIOLOGY 2010; 112:1116 –27
M.D. (Professional Staff, Department of General Anesthesia, Cleve- 13. Belden JR, Caplan LR, Pessin MS, Kwan E: Mechanisms and
land Clinic, Cleveland, Ohio), who conceived and developed the clinical features of posterior border-zone infarcts. Neurology
Cleveland Clinic’s Perioperative Health registry. The authors also 1999; 53:1312– 8
thank Eric K. Christiansen, M.B.A. (Anesthesiology Institute, 14. Chang HS, Hongo K, Nakagawa H: Adverse effects of limited
Cleveland Clinic), who led extraction of data from the registry. hypotensive anesthesia on the outcome of patients with
subarachnoid hemorrhage. J Neurosurg 2000; 92:971–5
15. Lienhart A, Auroy Y, Pequignot F, Benhamou D, Warszawski
´
References J, Bovet M, Jougla E: Survey of anesthesia-related mortality in
1. Kurz A, Sessler DI, Lenhardt R: Perioperative normothermia France. ANESTHESIOLOGY 2006; 105:1087–97
to reduce the incidence of surgical-wound infection and 16. Nickalls RW, Mapleson WW: Age-related iso-MAC charts for
shorten hospitalization: Study of Wound Infection and Tem- isoflurane, sevoflurane and desflurane in man. Br J Anaesth
perature Group. N Engl J Med 1996; 334:1209 –15 2003; 91:170 – 4
2. Noblett SE, Snowden CP, Shenton BK, Horgan AF: Random- 17. Sessler DI, Sigl JC, Manberg PJ, Kelley SD, Schubert A,
ized clinical trial assessing the effect of Doppler-optimized Chamoun NG: Broadly applicable risk stratification system
fluid management on outcome after elective colorectal re- for predicting duration of hospitalization and mortality.
section. Br J Surg 2006; 93:1069 –76 ANESTHESIOLOGY 2010; 113:1026 –37
Anesthesiology 2012; 116:1195–1203 1203 Sessler et al.