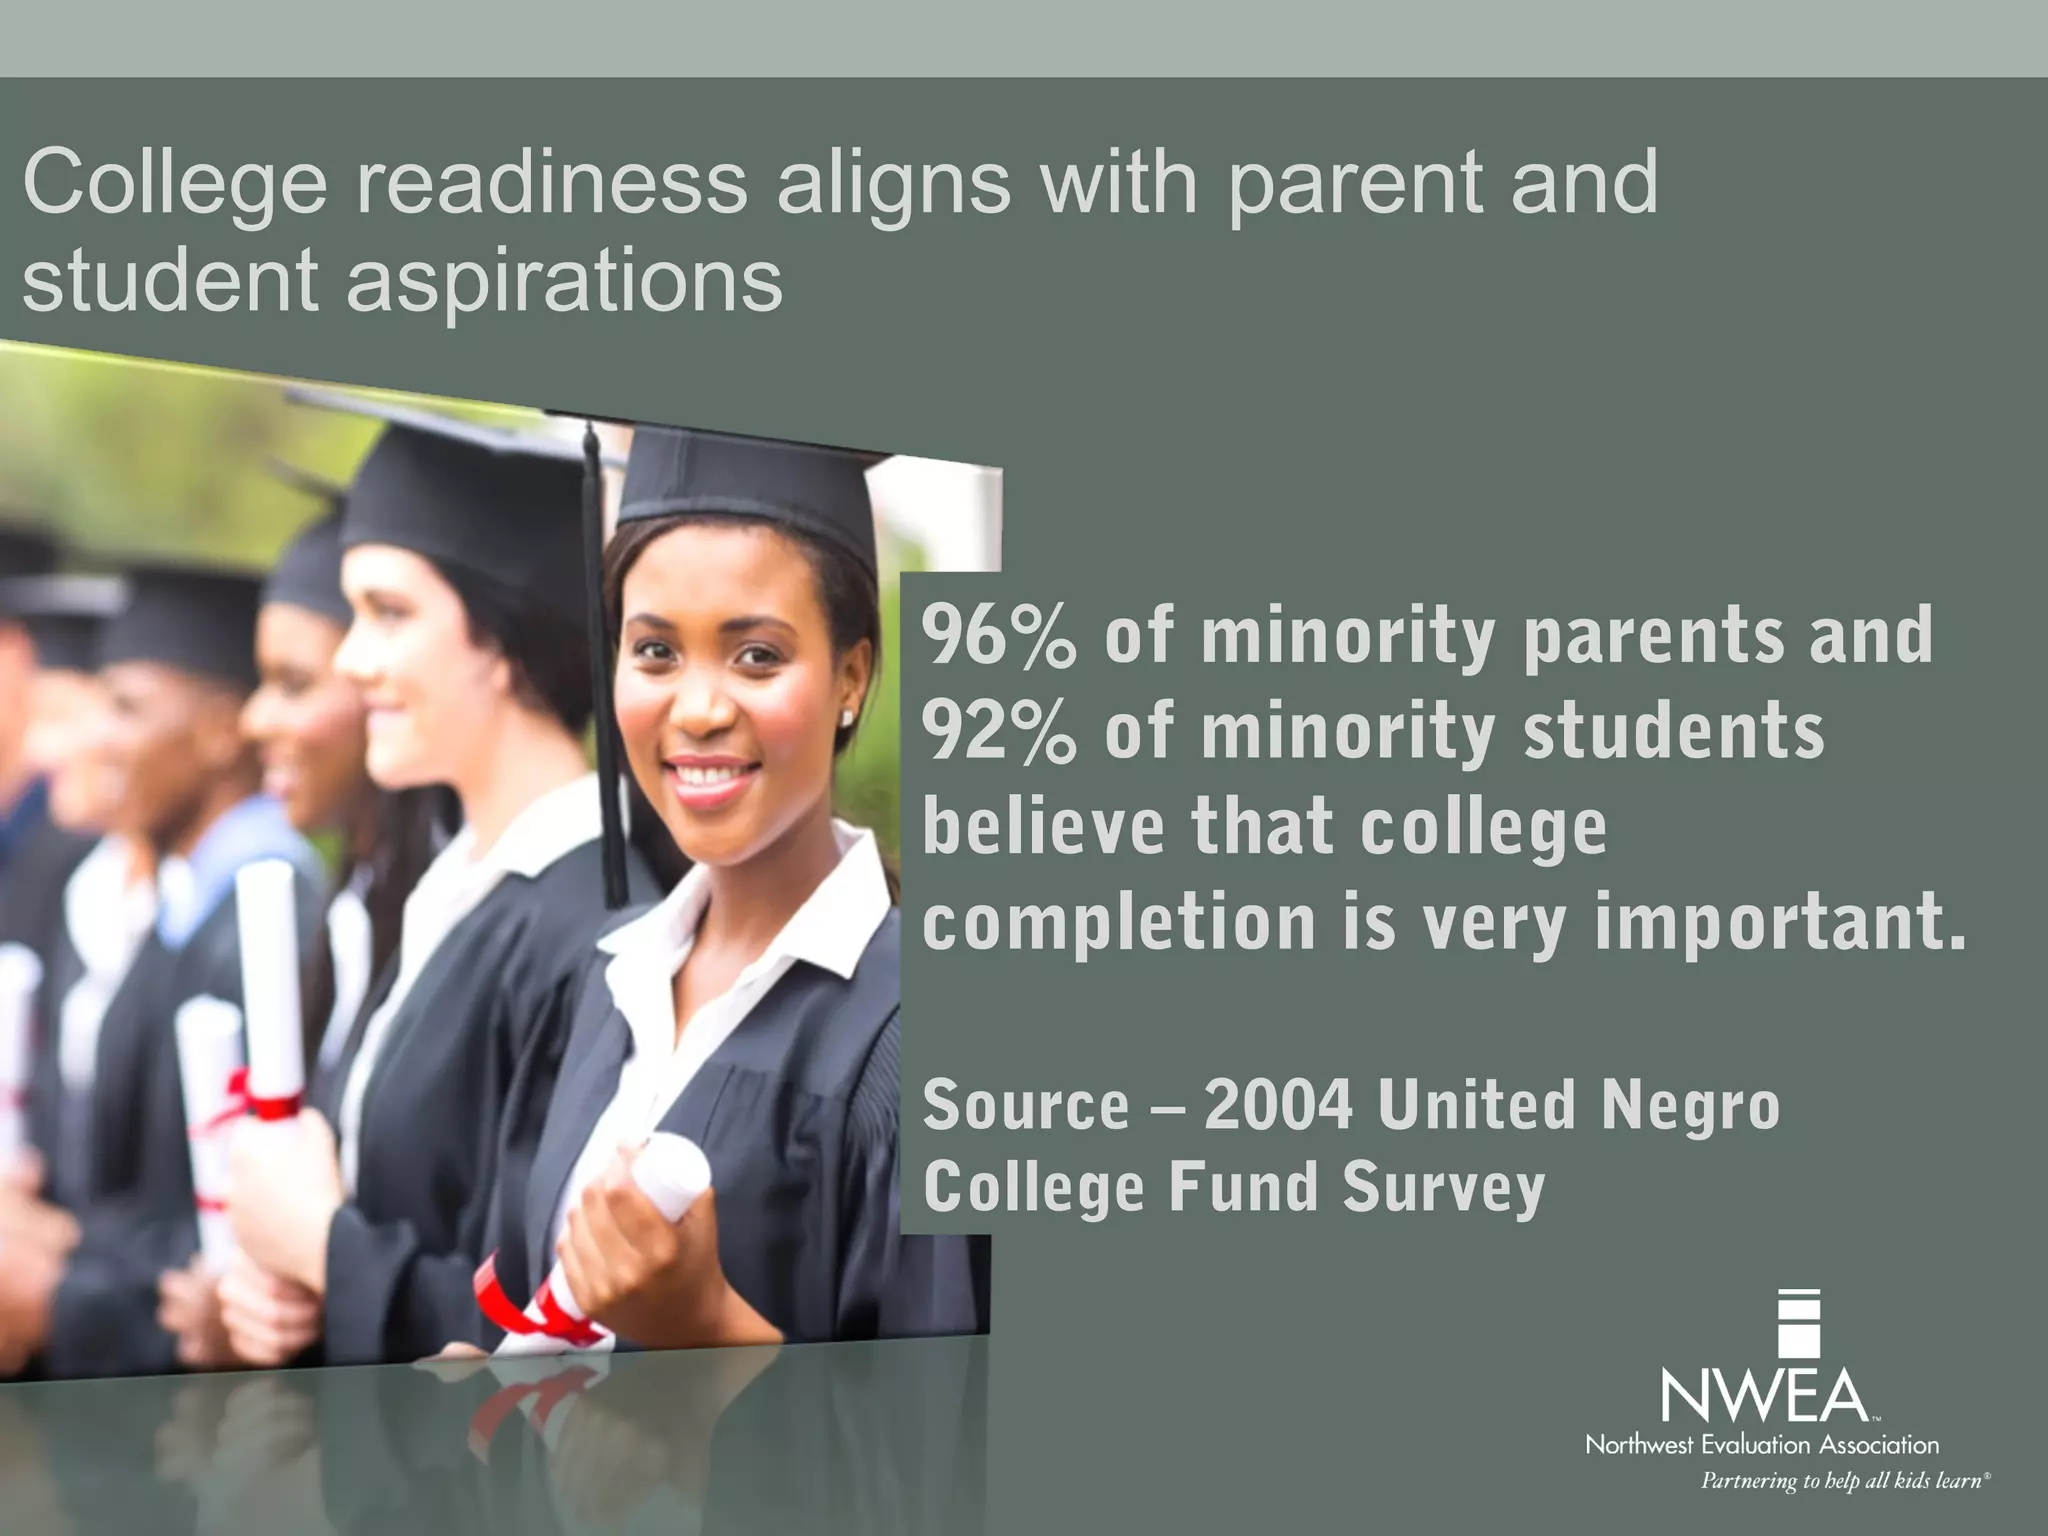
Download to read offline


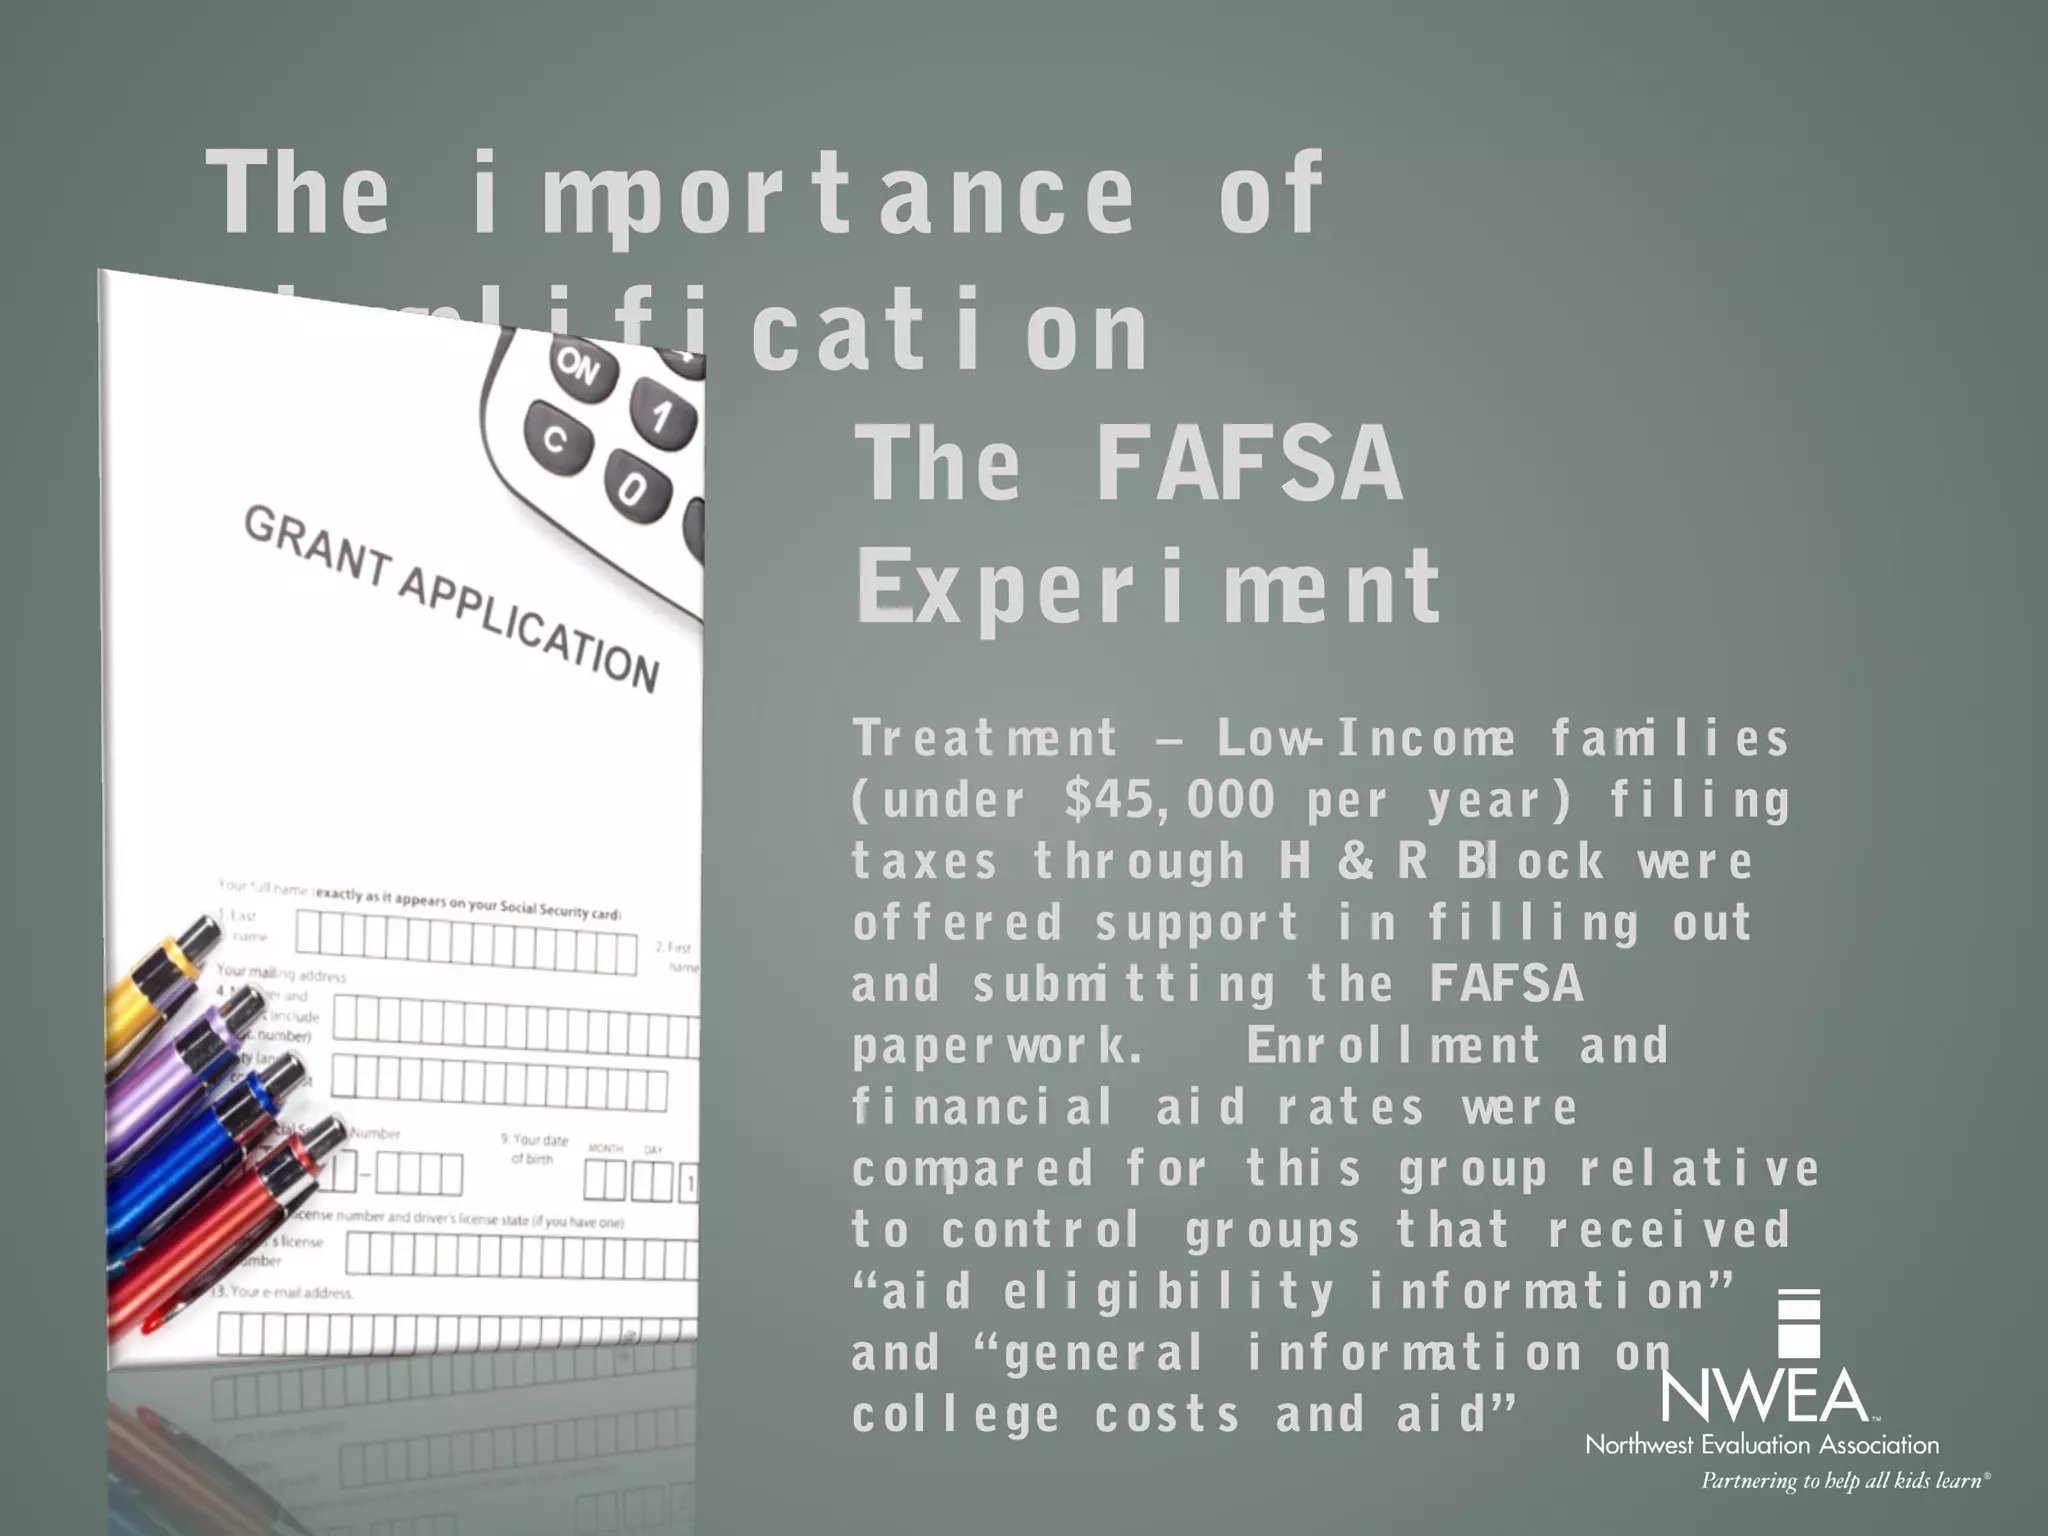


This document discusses factors that can propel low-income students into college and careers. It finds that most minority students and parents see college completion as important. While college attainment has increased overall, traditionally disadvantaged groups have seen the largest gains. The document also examines predictors of college readiness and the importance of non-academic supports like assistance completing financial aid forms. It argues college readiness encompasses multiple dimensions beyond test scores and that simplifying processes like financial aid applications can significantly increase college enrollment and aid receipt among low-income students.


