Download to read offline


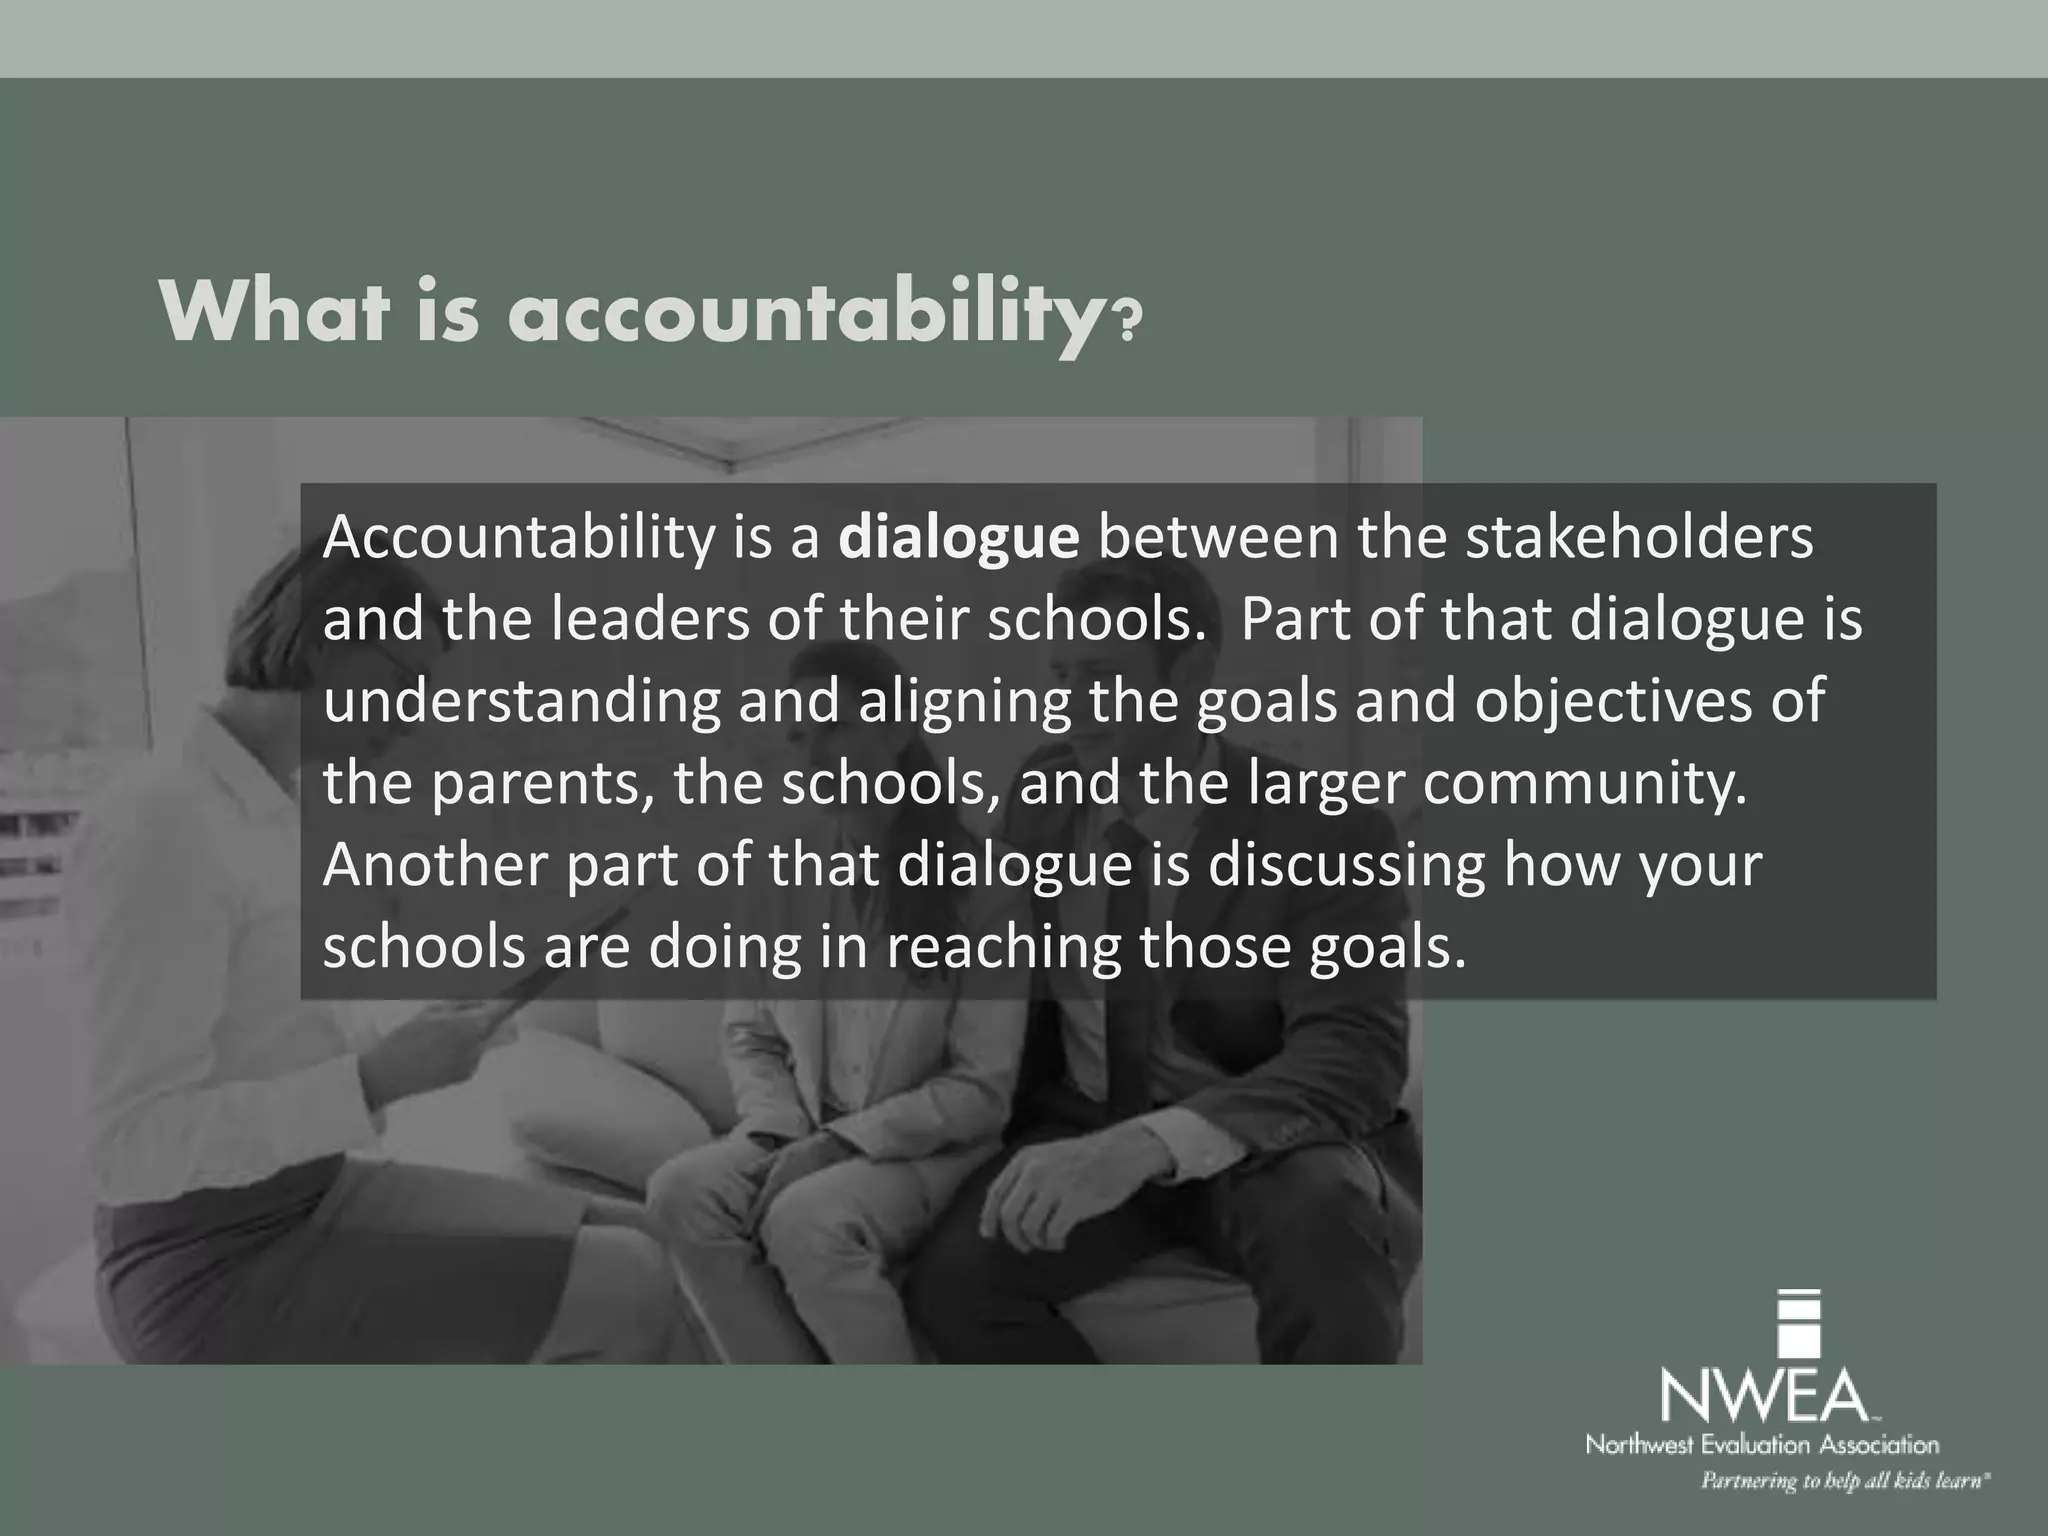


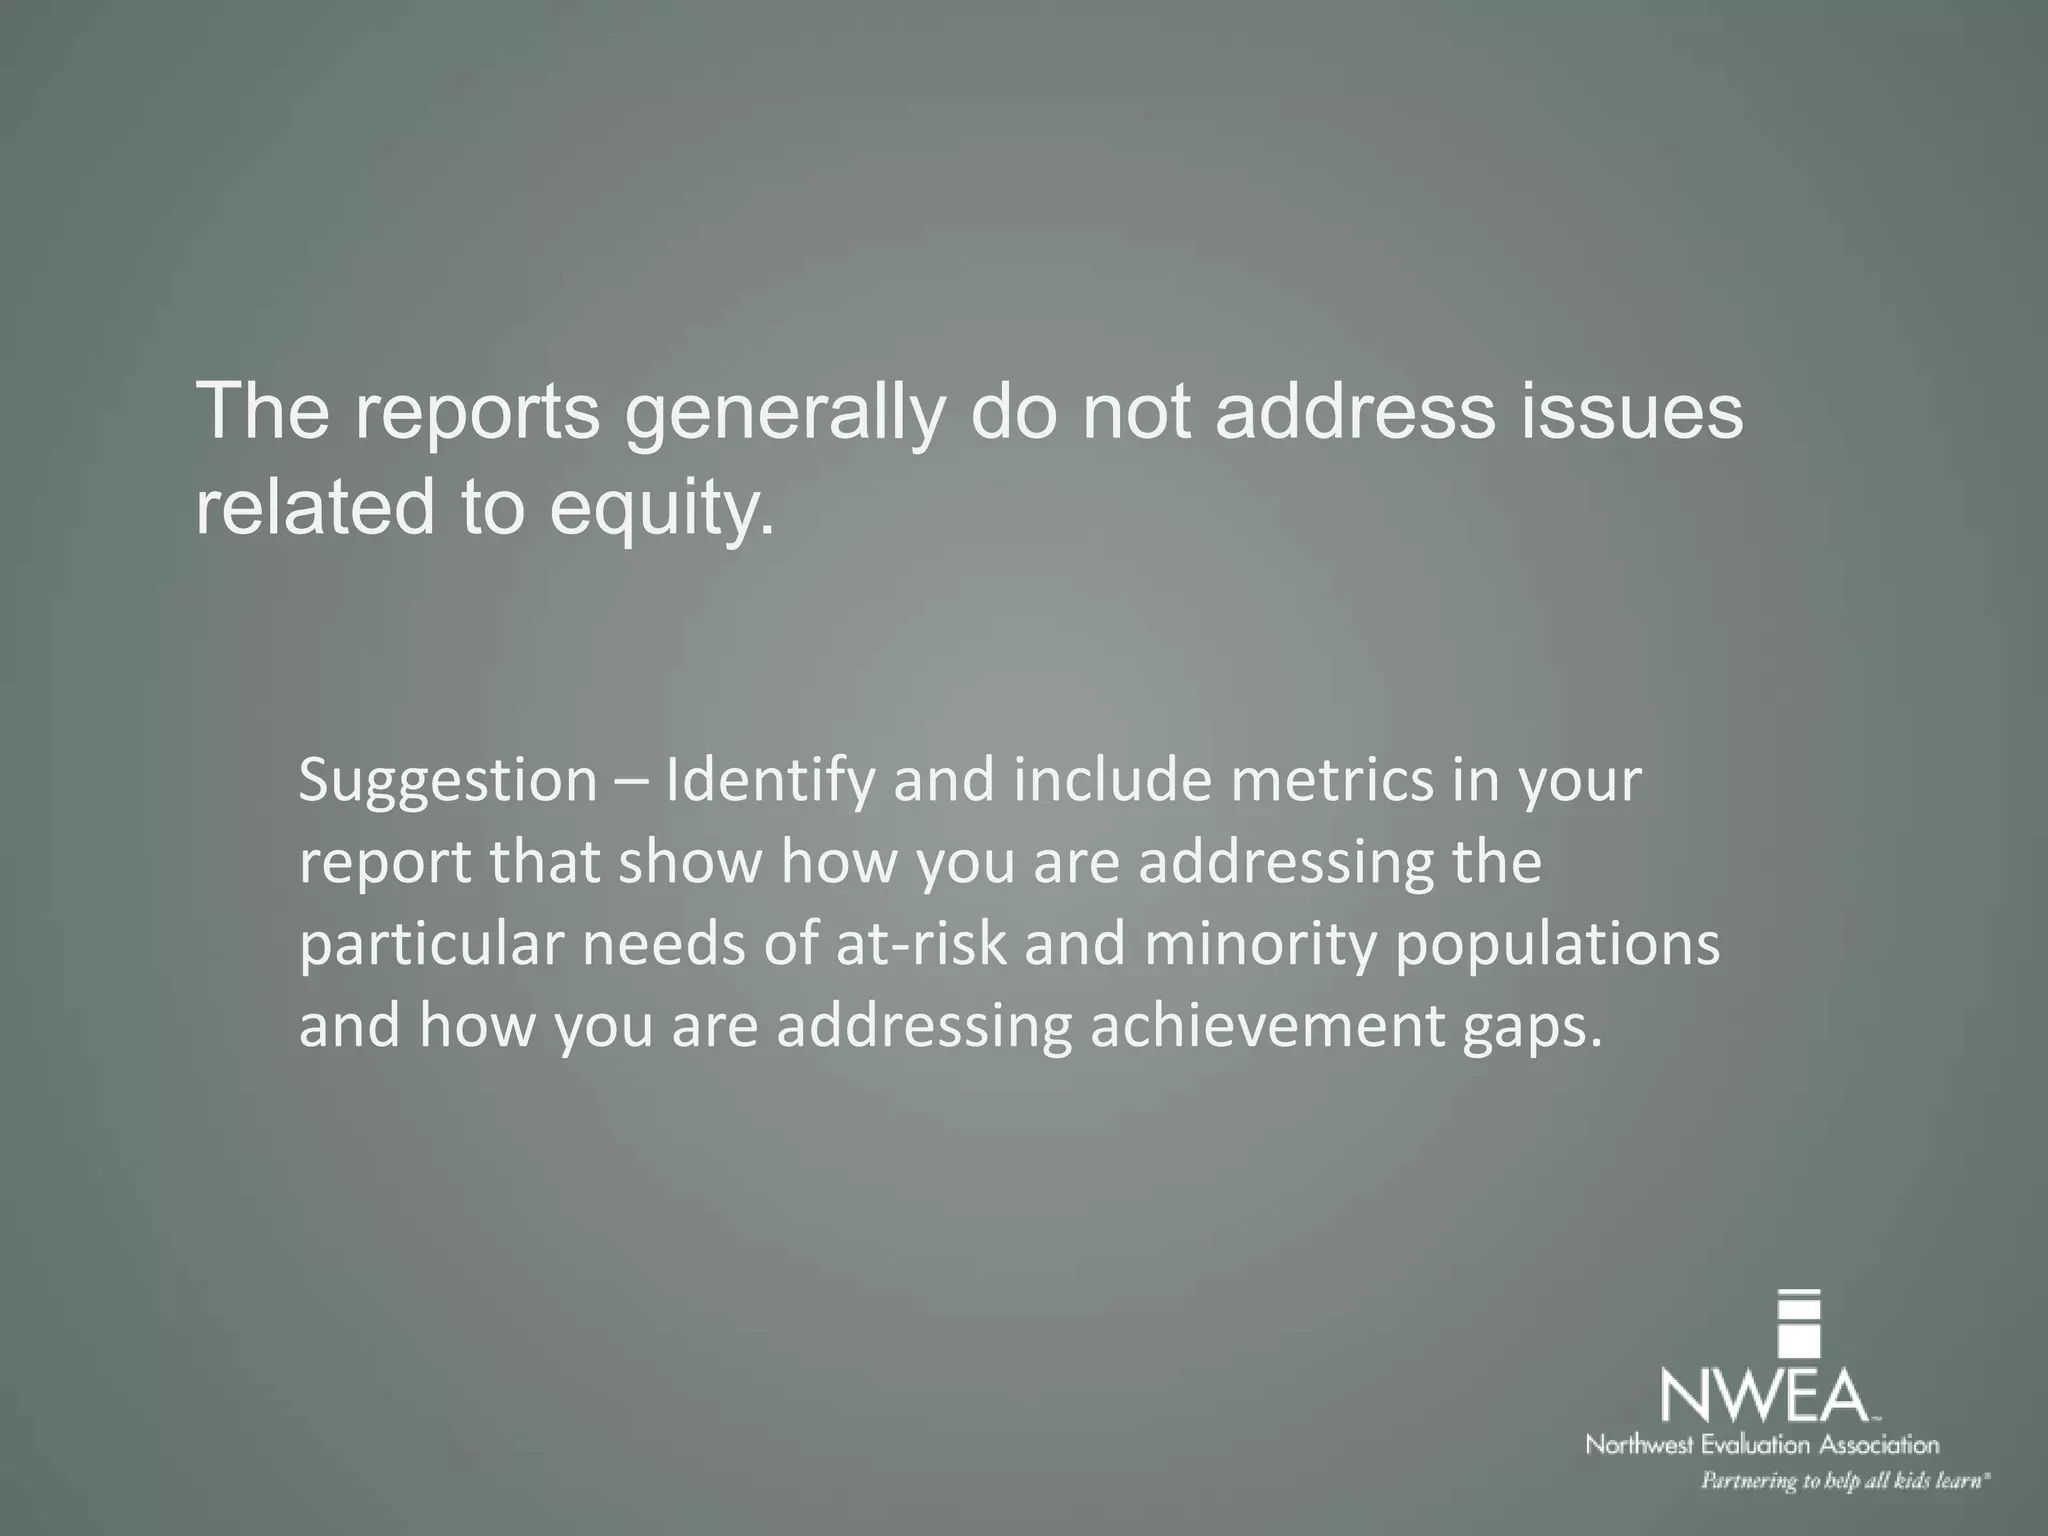


This presentation discusses accountability in education. It defines accountability as a dialogue between stakeholders and school leaders to understand goals and discuss performance. The presentation notes that accountability is not just about meeting targets, and emphasizes transparency in performance. It discusses using data to improve rather than punish schools. Examples from community accountability reports are reviewed, noting opportunities to focus more on informing stakeholders and addressing equity issues.


