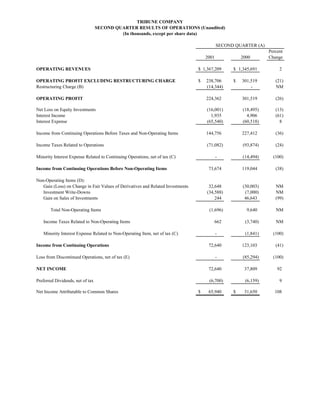
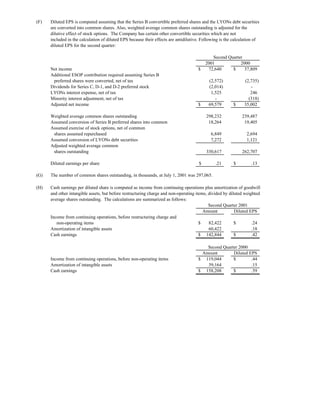
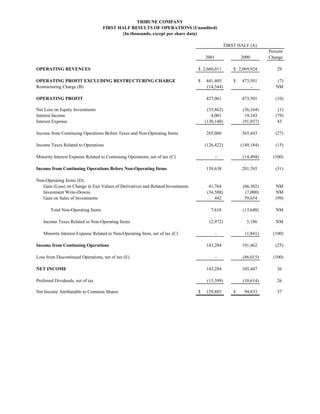
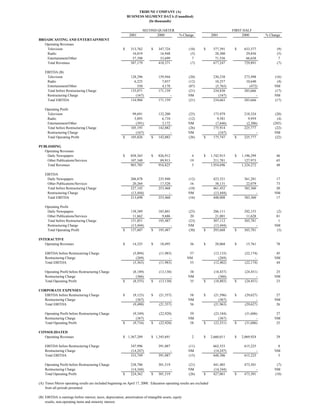
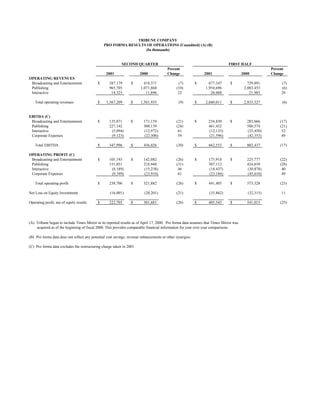
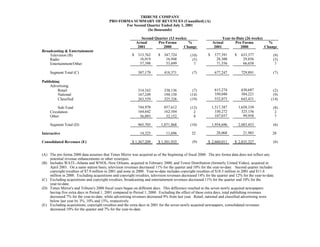
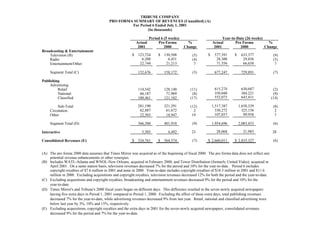
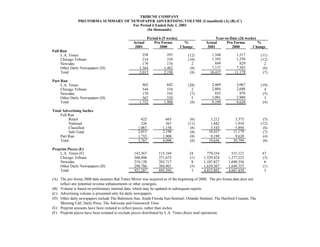
- Tribune Company reported its second quarter and first half 2001 results, with operating revenues increasing 2% and 29% respectively compared to the same periods in 2000.
- Operating profit declined 21% and 10% for the quarter and first half respectively due to a restructuring charge of $14.3 million.
- Net income increased 92% and 36% for the quarter and first half respectively due to non-operating gains, but income from continuing operations declined 41% and 25% due to the restructuring charge and higher interest expenses.
La presentazione di Aurkene Alzua Sorzabal, direttrice di CICtourGUNE, sui nuovi modelli di business turistici - WEF è internazionalizzazione e cosmopolitismo (23 marzo 2014)
Spectroscopic reflectance is a powerful method for thickness and n&k measurement of the translucent film. MProbe system makes this measurement easy and reliable
http://www.semiconsoft.com/wp/mprobe20desktop/
Empowering the Unbanked: The Vital Role of NBFCs in Promoting Financial Inclu...Vighnesh Shashtri
In India, financial inclusion remains a critical challenge, with a significant portion of the population still unbanked. Non-Banking Financial Companies (NBFCs) have emerged as key players in bridging this gap by providing financial services to those often overlooked by traditional banking institutions. This article delves into how NBFCs are fostering financial inclusion and empowering the unbanked.
when will pi network coin be available on crypto exchange.DOT TECH
There is no set date for when Pi coins will enter the market.
However, the developers are working hard to get them released as soon as possible.
Once they are available, users will be able to exchange other cryptocurrencies for Pi coins on designated exchanges.
But for now the only way to sell your pi coins is through verified pi vendor.
Here is the telegram contact of my personal pi vendor
@Pi_vendor_247
Poonawalla Fincorp and IndusInd Bank Introduce New Co-Branded Credit Cardnickysharmasucks
The unveiling of the IndusInd Bank Poonawalla Fincorp eLITE RuPay Platinum Credit Card marks a notable milestone in the Indian financial landscape, showcasing a successful partnership between two leading institutions, Poonawalla Fincorp and IndusInd Bank. This co-branded credit card not only offers users a plethora of benefits but also reflects a commitment to innovation and adaptation. With a focus on providing value-driven and customer-centric solutions, this launch represents more than just a new product—it signifies a step towards redefining the banking experience for millions. Promising convenience, rewards, and a touch of luxury in everyday financial transactions, this collaboration aims to cater to the evolving needs of customers and set new standards in the industry.
how to swap pi coins to foreign currency withdrawable.DOT TECH
As of my last update, Pi is still in the testing phase and is not tradable on any exchanges.
However, Pi Network has announced plans to launch its Testnet and Mainnet in the future, which may include listing Pi on exchanges.
The current method for selling pi coins involves exchanging them with a pi vendor who purchases pi coins for investment reasons.
If you want to sell your pi coins, reach out to a pi vendor and sell them to anyone looking to sell pi coins from any country around the globe.
Below is the contact information for my personal pi vendor.
Telegram: @Pi_vendor_247
What price will pi network be listed on exchangesDOT TECH
The rate at which pi will be listed is practically unknown. But due to speculations surrounding it the predicted rate is tends to be from 30$ — 50$.
So if you are interested in selling your pi network coins at a high rate tho. Or you can't wait till the mainnet launch in 2026. You can easily trade your pi coins with a merchant.
A merchant is someone who buys pi coins from miners and resell them to Investors looking forward to hold massive quantities till mainnet launch.
I will leave the telegram contact of my personal pi vendor to trade with.
@Pi_vendor_247
what is the future of Pi Network currency.DOT TECH
The future of the Pi cryptocurrency is uncertain, and its success will depend on several factors. Pi is a relatively new cryptocurrency that aims to be user-friendly and accessible to a wide audience. Here are a few key considerations for its future:
Message: @Pi_vendor_247 on telegram if u want to sell PI COINS.
1. Mainnet Launch: As of my last knowledge update in January 2022, Pi was still in the testnet phase. Its success will depend on a successful transition to a mainnet, where actual transactions can take place.
2. User Adoption: Pi's success will be closely tied to user adoption. The more users who join the network and actively participate, the stronger the ecosystem can become.
3. Utility and Use Cases: For a cryptocurrency to thrive, it must offer utility and practical use cases. The Pi team has talked about various applications, including peer-to-peer transactions, smart contracts, and more. The development and implementation of these features will be essential.
4. Regulatory Environment: The regulatory environment for cryptocurrencies is evolving globally. How Pi navigates and complies with regulations in various jurisdictions will significantly impact its future.
5. Technology Development: The Pi network must continue to develop and improve its technology, security, and scalability to compete with established cryptocurrencies.
6. Community Engagement: The Pi community plays a critical role in its future. Engaged users can help build trust and grow the network.
7. Monetization and Sustainability: The Pi team's monetization strategy, such as fees, partnerships, or other revenue sources, will affect its long-term sustainability.
It's essential to approach Pi or any new cryptocurrency with caution and conduct due diligence. Cryptocurrency investments involve risks, and potential rewards can be uncertain. The success and future of Pi will depend on the collective efforts of its team, community, and the broader cryptocurrency market dynamics. It's advisable to stay updated on Pi's development and follow any updates from the official Pi Network website or announcements from the team.
If you are looking for a pi coin investor. Then look no further because I have the right one he is a pi vendor (he buy and resell to whales in China). I met him on a crypto conference and ever since I and my friends have sold more than 10k pi coins to him And he bought all and still want more. I will drop his telegram handle below just send him a message.
@Pi_vendor_247
US Economic Outlook - Being Decided - M Capital Group August 2021.pdfpchutichetpong
The U.S. economy is continuing its impressive recovery from the COVID-19 pandemic and not slowing down despite re-occurring bumps. The U.S. savings rate reached its highest ever recorded level at 34% in April 2020 and Americans seem ready to spend. The sectors that had been hurt the most by the pandemic specifically reduced consumer spending, like retail, leisure, hospitality, and travel, are now experiencing massive growth in revenue and job openings.
Could this growth lead to a “Roaring Twenties”? As quickly as the U.S. economy contracted, experiencing a 9.1% drop in economic output relative to the business cycle in Q2 2020, the largest in recorded history, it has rebounded beyond expectations. This surprising growth seems to be fueled by the U.S. government’s aggressive fiscal and monetary policies, and an increase in consumer spending as mobility restrictions are lifted. Unemployment rates between June 2020 and June 2021 decreased by 5.2%, while the demand for labor is increasing, coupled with increasing wages to incentivize Americans to rejoin the labor force. Schools and businesses are expected to fully reopen soon. In parallel, vaccination rates across the country and the world continue to rise, with full vaccination rates of 50% and 14.8% respectively.
However, it is not completely smooth sailing from here. According to M Capital Group, the main risks that threaten the continued growth of the U.S. economy are inflation, unsettled trade relations, and another wave of Covid-19 mutations that could shut down the world again. Have we learned from the past year of COVID-19 and adapted our economy accordingly?
“In order for the U.S. economy to continue growing, whether there is another wave or not, the U.S. needs to focus on diversifying supply chains, supporting business investment, and maintaining consumer spending,” says Grace Feeley, a research analyst at M Capital Group.
While the economic indicators are positive, the risks are coming closer to manifesting and threatening such growth. The new variants spreading throughout the world, Delta, Lambda, and Gamma, are vaccine-resistant and muddy the predictions made about the economy and health of the country. These variants bring back the feeling of uncertainty that has wreaked havoc not only on the stock market but the mindset of people around the world. MCG provides unique insight on how to mitigate these risks to possibly ensure a bright economic future.
what is the best method to sell pi coins in 2024DOT TECH
The best way to sell your pi coins safely is trading with an exchange..but since pi is not launched in any exchange, and second option is through a VERIFIED pi merchant.
Who is a pi merchant?
A pi merchant is someone who buys pi coins from miners and pioneers and resell them to Investors looking forward to hold massive amounts before mainnet launch in 2026.
I will leave the telegram contact of my personal pi merchant to trade pi coins with.
@Pi_vendor_247
Latino Buying Power - May 2024 Presentation for Latino CaucusDanay Escanaverino
Unlock the potential of Latino Buying Power with this in-depth SlideShare presentation. Explore how the Latino consumer market is transforming the American economy, driven by their significant buying power, entrepreneurial contributions, and growing influence across various sectors.
**Key Sections Covered:**
1. **Economic Impact:** Understand the profound economic impact of Latino consumers on the U.S. economy. Discover how their increasing purchasing power is fueling growth in key industries and contributing to national economic prosperity.
2. **Buying Power:** Dive into detailed analyses of Latino buying power, including its growth trends, key drivers, and projections for the future. Learn how this influential group’s spending habits are shaping market dynamics and creating opportunities for businesses.
3. **Entrepreneurial Contributions:** Explore the entrepreneurial spirit within the Latino community. Examine how Latino-owned businesses are thriving and contributing to job creation, innovation, and economic diversification.
4. **Workforce Statistics:** Gain insights into the role of Latino workers in the American labor market. Review statistics on employment rates, occupational distribution, and the economic contributions of Latino professionals across various industries.
5. **Media Consumption:** Understand the media consumption habits of Latino audiences. Discover their preferences for digital platforms, television, radio, and social media. Learn how these consumption patterns are influencing advertising strategies and media content.
6. **Education:** Examine the educational achievements and challenges within the Latino community. Review statistics on enrollment, graduation rates, and fields of study. Understand the implications of education on economic mobility and workforce readiness.
7. **Home Ownership:** Explore trends in Latino home ownership. Understand the factors driving home buying decisions, the challenges faced by Latino homeowners, and the impact of home ownership on community stability and economic growth.
This SlideShare provides valuable insights for marketers, business owners, policymakers, and anyone interested in the economic influence of the Latino community. By understanding the various facets of Latino buying power, you can effectively engage with this dynamic and growing market segment.
Equip yourself with the knowledge to leverage Latino buying power, tap into their entrepreneurial spirit, and connect with their unique cultural and consumer preferences. Drive your business success by embracing the economic potential of Latino consumers.
**Keywords:** Latino buying power, economic impact, entrepreneurial contributions, workforce statistics, media consumption, education, home ownership, Latino market, Hispanic buying power, Latino purchasing power.
how can i use my minded pi coins I need some funds.DOT TECH
If you are interested in selling your pi coins, i have a verified pi merchant, who buys pi coins and resell them to exchanges looking forward to hold till mainnet launch.
Because the core team has announced that pi network will not be doing any pre-sale. The only way exchanges like huobi, bitmart and hotbit can get pi is by buying from miners.
Now a merchant stands in between these exchanges and the miners. As a link to make transactions smooth. Because right now in the enclosed mainnet you can't sell pi coins your self. You need the help of a merchant,
i will leave the telegram contact of my personal pi merchant below. 👇 I and my friends has traded more than 3000pi coins with him successfully.
@Pi_vendor_247
The secret way to sell pi coins effortlessly.DOT TECH
Well as we all know pi isn't launched yet. But you can still sell your pi coins effortlessly because some whales in China are interested in holding massive pi coins. And they are willing to pay good money for it. If you are interested in selling I will leave a contact for you. Just telegram this number below. I sold about 3000 pi coins to him and he paid me immediately.
Telegram: @Pi_vendor_247
The European Unemployment Puzzle: implications from population agingGRAPE
We study the link between the evolving age structure of the working population and unemployment. We build a large new Keynesian OLG model with a realistic age structure, labor market frictions, sticky prices, and aggregate shocks. Once calibrated to the European economy, we quantify the extent to which demographic changes over the last three decades have contributed to the decline of the unemployment rate. Our findings yield important implications for the future evolution of unemployment given the anticipated further aging of the working population in Europe. We also quantify the implications for optimal monetary policy: lowering inflation volatility becomes less costly in terms of GDP and unemployment volatility, which hints that optimal monetary policy may be more hawkish in an aging society. Finally, our results also propose a partial reversal of the European-US unemployment puzzle due to the fact that the share of young workers is expected to remain robust in the US.
Falcon stands out as a top-tier P2P Invoice Discounting platform in India, bridging esteemed blue-chip companies and eager investors. Our goal is to transform the investment landscape in India by establishing a comprehensive destination for borrowers and investors with diverse profiles and needs, all while minimizing risk. What sets Falcon apart is the elimination of intermediaries such as commercial banks and depository institutions, allowing investors to enjoy higher yields.
1. TRIBUNE COMPANY
SECOND QUARTER RESULTS OF OPERATIONS (Unaudited)
(In thousands, except per share data)
SECOND QUARTER (A)
Percent
2001 2000 Change
OPERATING REVENUES $ 1,367,209 $ 1,345,691 2
OPERATING PROFIT EXCLUDING RESTRUCTURING CHARGE $ 238,706 $ 301,519 (21)
Restructuring Charge (B) (14,344) - NM
OPERATING PROFIT 224,362 301,519 (26)
Net Loss on Equity Investments (16,001) (18,495) (13)
Interest Income 1,935 4,906 (61)
Interest Expense (65,540) (60,518) 8
Income from Continuing Operations Before Taxes and Non-Operating Items 144,756 227,412 (36)
Income Taxes Related to Operations (71,082) (93,874) (24)
Minority Interest Expense Related to Continuing Operations, net of tax (C) - (14,494) (100)
Income from Continuing Operations Before Non-Operating Items 73,674 119,044 (38)
Non-Operating Items (D):
Gain (Loss) on Change in Fair Values of Derivatives and Related Investments 32,648 (30,003) NM
Investment Write-Downs (34,588) (7,000) NM
Gain on Sales of Investments 244 46,643 (99)
Total Non-Operating Items (1,696) 9,640 NM
Income Taxes Related to Non-Operating Items 662 (3,740) NM
Minority Interest Expense Related to Non-Operating Item, net of tax (C) - (1,841) (100)
Income from Continuing Operations 72,640 123,103 (41)
Loss from Discontinued Operations, net of tax (E) - (85,294) (100)
NET INCOME 72,640 37,809 92
Preferred Dividends, net of tax (6,700) (6,159) 9
Net Income Attributable to Common Shares $ 65,940 $ 31,650 108
2. EARNINGS PER SHARE
Basic:
From continuing operations
Before restructuring charge and non-operating items $ .25 $ .47 (47)
Including restructuring charge and non-operating items $ .22 $ .49 (55)
Discontinued operations - (.36) (100)
Total $ .22 $ .13 69
Diluted:
From continuing operations
Before restructuring charge and non-operating items $ .24 $ .44 (45)
Including restructuring charge and non-operating items $ .21 $ .46 (54)
Discontinued operations - (.33) (100)
Total (F) $ .21 $ .13 62
DIVIDENDS PER COMMON SHARE $ .11 $ .10 10
Weighted Average Common Shares Outstanding (G) 298,232 239,487 25
Cash Earnings from Continuing Operations Before Restructuring Charge
and Non-Operating Items (H)
Amount $ 142,844 $ 158,208 (10)
Per diluted share $ .42 $ .59 (29)
3. (A) 2001 quarter: April 2, 2001 to July 1, 2001. (13 weeks)
2000 quarter: March 27, 2000 to June 25, 2000. (13 weeks)
Times Mirror operating results are included beginning on April 17, 2000.
(B) During the second quarter of 2001, the Company announced a voluntary retirement program (VRP) which is being
offered to approximately 1,400 employees who meet certain eligibility requirements. In addition, various other
workforce reduction initiatives are being implemented throughout the organization. In the second quarter of 2001,
the Company recorded a restructuring charge of $14.3 million, or $.03 per share, for these initiatives.
(C) Minority interest expense was recorded for the 60.6% of Times Mirror not owned by Tribune from
April 17 through June 11, 2000.
(D) The second quarter of 2001 included the following non-operating items:
Pretax Diluted
Gain (Loss) EPS
Net change in fair values of PHONES and DECS derivatives and related
AOL Time Warner (quot;AOLquot;) and Mattel shares $ 32,648 $ .07
Investment write-downs (34,588) (.07)
Sale of investments 244 -
Total non-operating items $ (1,696) $ -
The second quarter of 2000 included the following non-operating items:
Pretax Diluted
Gain (Loss) EPS
Net change in fair values of PHONES, DECS, PEPS and AOL collar
derivatives and related AOL and Mattel shares $ (30,003) $ (.07)
Investment write-downs (7,000) (.02)
Sale of Digital City investment 46,643 .11
Total non-operating items $ 9,640 $ .02
(E) Tribune Education was sold to The McGraw-Hill Companies on Sept. 5, 2000 for approximately $686 million,
including the related tax benefit of $22 million. The accompanying financial statements reflect the Education
segment as discontinued operations, which are summarized as follows:
Second Quarter
2001 2000
Income from operations, net of tax $ - $ 10,464
Loss on disposal, net of tax and income during the holding period - (95,758)
Loss from discontinued operations, net of tax $ - $ (85,294)
4. (F) Diluted EPS is computed assuming that the Series B convertible preferred shares and the LYONs debt securities
are converted into common shares. Also, weighted average common shares outstanding is adjusted for the
dilutive effect of stock options. The Company has certain other convertible securities which are not
included in the calculation of diluted EPS because their effects are antidilutive. Following is the calculation of
diluted EPS for the second quarter:
Second Quarter
2001 2000
Net income $ 72,640 $ 37,809
Additional ESOP contribution required assuming Series B
preferred shares were converted, net of tax (2,572) (2,735)
Dividends for Series C, D-1, and D-2 preferred stock (2,014) -
LYONs interest expense, net of tax 1,525 246
Minority interest adjustment, net of tax - (318)
Adjusted net income $ 69,579 $ 35,002
Weighted average common shares outstanding 298,232 239,487
Assumed conversion of Series B preferred shares into common 18,264 19,405
Assumed exercise of stock options, net of common
shares assumed repurchased 6,849 2,694
Assumed conversion of LYONs debt securities 7,272 1,121
Adjusted weighted average common
shares outstanding 330,617 262,707
Diluted earnings per share $ .21 $ .13
(G) The number of common shares outstanding, in thousands, at July 1, 2001 was 297,065.
(H) Cash earnings per diluted share is computed as income from continuing operations plus amortization of goodwill
and other intangible assets, but before restructuring charge and non-operating items, divided by diluted weighted
average shares outstanding. The calculations are summarized as follows:
Second Quarter 2001
Amount Diluted EPS
Income from continuing operations, before restructuring charge and
non-operating items $ 82,422 $ .24
Amortization of intangible assets 60,422 .18
Cash earnings $ 142,844 $ .42
Second Quarter 2000
Amount Diluted EPS
Income from continuing operations, before non-operating items $ 119,044 $ .44
Amortization of intangible assets 39,164 .15
Cash earnings $ 158,208 $ .59
5. TRIBUNE COMPANY
FIRST HALF RESULTS OF OPERATIONS (Unaudited)
(In thousands, except per share data)
FIRST HALF (A)
Percent
2001 2000 Change
OPERATING REVENUES $ 2,660,011 $ 2,069,924 29
OPERATING PROFIT EXCLUDING RESTRUCTURING CHARGE $ 441,405 $ 473,501 (7)
Restructuring Charge (B) (14,344) - NM
OPERATING PROFIT 427,061 473,501 (10)
Net Loss on Equity Investments (35,862) (36,164) (1)
Interest Income 4,001 19,143 (79)
Interest Expense (130,140) (91,037) 43
Income from Continuing Operations Before Taxes and Non-Operating Items 265,060 365,443 (27)
Income Taxes Related to Operations (126,422) (149,184) (15)
Minority Interest Expense Related to Continuing Operations, net of tax (C) - (14,494) (100)
Income from Continuing Operations Before Non-Operating Items 138,638 201,765 (31)
Non-Operating Items (D):
Gain (Loss) on Change in Fair Values of Derivatives and Related Investments 41,764 (66,302) NM
Investment Write-Downs (34,588) (7,000) NM
Gain on Sales of Investments 442 59,654 (99)
Total Non-Operating Items 7,618 (13,648) NM
Income Taxes Related to Non-Operating Items (2,972) 5,186 NM
Minority Interest Expense Related to Non-Operating Item, net of tax (C) - (1,841) (100)
Income from Continuing Operations 143,284 191,462 (25)
Loss from Discontinued Operations, net of tax (E) - (86,015) (100)
NET INCOME 143,284 105,447 36
Preferred Dividends, net of tax (13,399) (10,614) 26
Net Income Attributable to Common Shares $ 129,885 $ 94,833 37
6. EARNINGS PER SHARE
Basic:
From continuing operations
Before restructuring charge and non-operating items $ .45 $ .80 (44)
Including restructuring charge and non-operating items $ .44 $ .76 (42)
Discontinued operations - (.36) (100)
Total $ .44 $ .40 10
Diluted:
From continuing operations
Before restructuring charge and non-operating items $ .43 $ .75 (43)
Including restructuring charge and non-operating items $ .41 $ .71 (42)
Discontinued operations - (.33) (100)
Total (F) $ .41 $ .38 8
DIVIDENDS PER COMMON SHARE $ .22 $ .20 10
Weighted Average Common Shares Outstanding (G) 298,944 237,845 26
Cash Earnings from Continuing Operations Before Restructuring Charge
and Non-Operating Items (H)
Amount $ 266,730 $ 260,709 2
Per diluted share $ .79 $ .98 (19)
7. (A) 2001 first half: January 1, 2001 to July 1, 2001. (26 weeks)
2000 first half: December 27, 1999 to June 25, 2000. (26 weeks)
Times Mirror operating results are included beginning on April 17, 2000.
(B) During the second quarter of 2001, the Company announced a voluntary retirement program (VRP) which is being
offered to approximately 1,400 employees who meet certain eligibility requirements. In addition, various other
workforce reduction initiatives are being implemented throughout the organization. In the first half of 2001,
the Company recorded a restructuring charge of $14.3 million, or $.03 per share, for these initiatives.
(C) Minority interest expense was recorded for the 60.6% of Times Mirror not owned by Tribune from
April 17 through June 11, 2000.
(D) The first half of 2001 included the following non-operating items:
Pretax Diluted
Gain (Loss) EPS
Net change in fair values of PHONES, DECS, and PEPS derivatives and
related AOL Time Warner (quot;AOLquot;) and Mattel shares (1Q & 2Q) $ 41,764 $ .08
Investment write-downs (2Q) (34,588) (.07)
Sale of investments (1Q & 2Q) 442 -
Total non-operating items $ 7,618 $ .01
The first half of 2000 included the following non-operating items:
Pretax Diluted
Gain (Loss) EPS
Net change in fair values of PHONES, DECS, PEPS and AOL collar
derivatives and related AOL and Mattel shares (1Q & 2Q) $ (66,302) $ (.16)
Investment write-downs (2Q) (7,000) (.02)
Sale of AOL common stock (1Q) 13,011 .03
Sale of Digital City investment (2Q) 46,643 .11
Total non-operating items $ (13,648) $ (.04)
(E) Tribune Education was sold to The McGraw-Hill Companies on Sept. 5, 2000 for approximately $686 million,
including the related tax benefit of $22 million. The accompanying financial statements reflect the Education
segment as discontinued operations, which are summarized as follows:
First Half
2001 2000
Income from operations, net of tax $ - $ 9,743
Loss on disposal, net of tax and income during the holding period - (95,758)
Loss from discontinued operations, net of tax $ - $ (86,015)
8. (F) Diluted EPS is computed assuming that the Series B convertible preferred shares and the LYONs debt securities
are converted into common shares. Also, weighted average common shares outstanding is adjusted for the
dilutive effect of stock options. The Company has certain other convertible securities which are not
included in the calculation of diluted EPS because their effects are antidilutive. Following is the calculation of
diluted EPS for the first half:
First Half
2001 2000
Net income $ 143,284 $ 105,447
Additional ESOP contribution required assuming Series B
preferred shares were converted, net of tax (5,231) (5,550)
Dividends for Series C, D-1, and D-2 preferred stock (4,028) -
LYONs interest expense, net of tax 3,040 246
Minority interest adjustment, net of tax - (318)
Adjusted net income $ 137,065 $ 99,825
Weighted average common shares outstanding 298,944 237,845
Assumed conversion of Series B preferred shares into common 18,264 19,405
Assumed exercise of stock options, net of common
shares assumed repurchased 6,662 2,984
Assumed conversion of LYONs debt securities 7,272 560
Adjusted weighted average common
shares outstanding 331,142 260,794
Diluted earnings per share $ .41 $ .38
(G) The number of common shares outstanding, in thousands, at July 1, 2001 was 297,065.
(H) Cash earnings per diluted share is computed as income from continuing operations plus amortization of goodwill
and other intangible assets, but before restructuring charge and non-operating items, divided by diluted weighted
average shares outstanding. The calculations are summarized as follows:
First Half 2001
Amount Diluted EPS
Income from continuing operations, before restructuring charge and
non-operating items $ 147,386 $ .43
Amortization of intangible assets 119,344 .36
Cash earnings $ 266,730 $ .79
First Half 2000
Amount Diluted EPS
Income from continuing operations, before non-operating items $ 201,765 $ .75
Amortization of intangible assets 58,944 .23
Cash earnings $ 260,709 $ .98
9. TRIBUNE COMPANY (A)
BUSINESS SEGMENT DATA (Unaudited)
(In thousands)
SECOND QUARTER FIRST HALF
2001 2000 % Change 2001 2000 % Change
BROADCASTING AND ENTERTAINMENT
Operating Revenues
Television $ 313,762 $ 347,724 (10) $ 577,391 $ 633,377 (9)
Radio 16,019 16,948 (5) 28,300 29,856 (5)
Entertainment/Other 57,398 53,699 7 71,556 66,658 7
Total Revenues 387,179 418,371 (7) 677,247 729,891 (7)
EBITDA (B)
Television 128,296 159,944 (20) 230,338 273,498 (16)
Radio 6,225 7,037 (12) 10,257 10,640 (4)
Entertainment/Other 550 4,178 (87) (5,765) (472) NM
Total before Restructuring Charge 135,071 171,159 (21) 234,830 283,666 (17)
Restructuring Charge (167) - NM (167) - NM
Total EBITDA 134,904 171,159 (21) 234,663 283,666 (17)
Operating Profit
Television 99,691 132,200 (25) 173,979 218,324 (20)
Radio 5,893 6,710 (12) 9,581 9,959 (4)
Entertainment/Other (391) 3,172 NM (7,646) (2,506) (205)
Total before Restructuring Charge 105,193 142,082 (26) 175,914 225,777 (22)
Restructuring Charge (167) - NM (167) - NM
Total Operating Profit $ 105,026 $ 142,082 (26) $ 175,747 $ 225,777 (22)
PUBLISHING
Operating Revenues
Daily Newspapers $ 858,365 $ 826,912 4 $ 1,742,915 $ 1,196,299 46
Other Publications/Services 107,340 89,913 19 211,781 127,973 65
Total Revenues 965,705 916,825 5 1,954,696 1,324,272 48
EBITDA
Daily Newspapers 206,878 235,940 (12) 423,321 361,281 17
Other Publications/Services 20,264 17,528 16 38,131 22,079 73
Total before Restructuring Charge 227,142 253,468 (10) 461,452 383,360 20
Restructuring Charge (13,444) - NM (13,444) - NM
Total EBITDA 213,698 253,468 (16) 448,008 383,360 17
Operating Profit
Daily Newspapers 139,389 185,801 (25) 286,111 292,153 (2)
Other Publications/Services 11,662 9,686 20 21,001 11,628 81
Total before Restructuring Charge 151,051 195,487 (23) 307,112 303,781 1
Restructuring Charge (13,444) - NM (13,444) - NM
Total Operating Profit $ 137,607 $ 195,487 (30) $ 293,668 $ 303,781 (3)
INTERACTIVE
Operating Revenues $ 14,325 $ 10,495 36 $ 28,068 $ 15,761 78
EBITDA before Restructuring Charge (5,094) (11,983) 57 (12,133) (22,174) 45
Restructuring Charge (269) - NM (269) - NM
Total EBITDA (5,363) (11,983) 55 (12,402) (22,174) 44
Operating Profit before Restructuring Charge (8,189) (13,130) 38 (18,437) (24,451) 25
Restructuring Charge (366) - NM (366) - NM
Total Operating Profit $ (8,555) $ (13,130) 35 $ (18,803) $ (24,451) 23
CORPORATE EXPENSES
EBITDA before Restructuring Charge $ (9,123) $ (21,557) 58 $ (21,596) $ (29,627) 27
Restructuring Charge (367) - NM (367) - NM
Total EBITDA (9,490) (21,557) 56 (21,963) (29,627) 26
Operating Profit before Restructuring Charge (9,349) (22,920) 59 (23,184) (31,606) 27
Restructuring Charge (367) - NM (367) - NM
Total Operating Profit $ (9,716) $ (22,920) 58 $ (23,551) $ (31,606) 25
CONSOLIDATED
Operating Revenues $ 1,367,209 $ 1,345,691 2 $ 2,660,011 $ 2,069,924 29
EBITDA before Restructuring Charge 347,996 391,087 (11) 662,553 615,225 8
Restructuring Charge (14,247) - NM (14,247) - NM
Total EBITDA 333,749 391,087 (15) 648,306 615,225 5
Operating Profit before Restructuring Charge 238,706 301,519 (21) 441,405 473,501 (7)
Restructuring Charge (14,344) - NM (14,344) - NM
Total Operating Profit $ 224,362 $ 301,519 (26) $ 427,061 $ 473,501 (10)
(A) Times Mirror operating results are included beginning on April 17, 2000. Education operating results are excluded
from all periods presented.
(B) EBITDA is earnings before interest, taxes, depreciation, amortization of intangible assets, equity
results, non-operating items and minority interest.
10. TRIBUNE COMPANY
PRO FORMA RESULTS OF OPERATIONS (Unaudited) (A) (B)
(In thousands)
SECOND QUARTER FIRST HALF
Percent Percent
2001 2000 Change 2001 2000 Change
OPERATING REVENUES
Broadcasting and Entertainment $ 387,179 $ 418,371 (7) $ 677,247 $ 729,891 (7)
Publishing 965,705 1,071,868 (10) 1,954,696 2,083,453 (6)
Interactive 14,325 11,696 22 28,068 21,983 28
Total operating revenues $ 1,367,209 $ 1,501,935 (9) $ 2,660,011 $ 2,835,327 (6)
EBITDA (C)
Broadcasting and Entertainment $ 135,071 $ 171,159 (21) $ 234,830 $ 283,666 (17)
Publishing 227,142 300,139 (24) 461,452 586,574 (21)
Interactive (5,094) (12,972) 61 (12,133) (25,450) 52
Corporate Expenses (9,123) (22,300) 59 (21,596) (42,353) 49
Total EBITDA $ 347,996 $ 436,026 (20) $ 662,553 $ 802,437 (17)
OPERATING PROFIT (C)
Broadcasting and Entertainment $ 105,193 $ 142,082 (26) $ 175,914 $ 225,777 (22)
Publishing 151,051 218,948 (31) 307,112 424,039 (28)
Interactive (8,189) (15,238) 46 (18,437) (30,878) 40
Corporate Expenses (9,349) (23,910) 61 (23,184) (45,610) 49
Total operating profit $ 238,706 $ 321,882 (26) $ 441,405 $ 573,328 (23)
Net Loss on Equity Investments (16,001) (20,201) (21) (35,862) (32,315) 11
Operating profit, net of equity results $ 222,705 $ 301,681 (26) $ 405,543 $ 541,013 (25)
(A) Tribune began to include Times Mirror in its reported results as of April 17, 2000. Pro forma data assumes that Times Mirror was
acquired as of the beginning of fiscal 2000. This provides comparable financial information for year over year comparisons.
(B) Pro forma data does not reflect any potential cost savings, revenue enhancements or other synergies.
(C) Pro forma data excludes the restructuring charge taken in 2001.
11. TRIBUNE COMPANY
PRO FORMA SUMMARY OF REVENUES (Unaudited) (A)
For Second Quarter Ended July 1, 2001
(In thousands)
Second Quarter (13 weeks) Year-to-Date (26 weeks)
Actual Pro Forma % Actual Pro Forma %
2001 2000 Change 2001 2000 Change
Broadcasting & Entertainment
$ 313,762 $ 347,724 $ 577,391 $ 633,377
Television (B) (10) (9)
16,019 16,948 28,300 29,856
Radio (5) (5)
57,398 53,699 71,556 66,658
Entertainment/Other 7 7
Segment Total (C) 387,179 418,371 (7) 677,247 729,891 (7)
Publishing
Advertising
615,274 630,687
Retail 314,162 338,136 (7) (2)
350,040 384,221
National 167,249 194,150 (14) (9)
552,073 643,431
Classified 263,559 325,326 (19) (14)
744,970 857,612 1,517,387 1,658,339
Sub-Total (13) (8)
164,642 162,104 330,272 325,156
Circulation 2 2
107,037 99,958
Other 56,093 52,152 8 7
Segment Total (D) 965,705 1,071,868 (10) 1,954,696 2,083,453 (6)
28,068 21,983
14,325 11,696 22 28
Interactive
$ 1,367,209 $ 1,501,935 (9) $ 2,660,011 $ 2,835,327 (6)
Consolidated Revenues (E)
(A) The pro forma 2000 data assumes that Times Mirror was acquired as of the beginning of fiscal 2000. The pro forma data does not reflect any
potential revenue enhancements or other synergies.
(B) Includes WATL-Atlanta and WNOL-New Orleans, acquired in February 2000, and Tower Distribution (formerly United Video), acquired in
April 2001. On a same station basis, television revenues decreased 11% for the quarter and 10% for the year-to-date. Second quarter includes
copyright royalties of $7.9 million in 2001 and none in 2000. Year-to-date includes copyright royalties of $18.3 million in 2001 and $11.6
million in 2000. Excluding acquisitions and copyright royalties, television revenues decreased 14% for the quarter and 12% for the year-to-date.
(C) Excluding acquisitions and copyright royalties, broadcasting and entertainment revenues decreased 11% for the quarter and 10% for the
year-to-date.
(D) Times Mirror's and Tribune's 2000 fiscal years began on different days. This difference resulted in the seven newly acquired newspapers
having five extra days in Period 1, 2001 compared to Period 1, 2000. Excluding the effect of these extra days, total publishing revenues
decreased 7% for the year-to-date, while advertising revenues decreased 9% from last year. Retail, national and classified advertising were
below last year by 3%, 10% and 15%, respectively.
(E) Excluding acquisitions, copyright royalties and the extra days in 2001 for the seven newly acquired newspapers, consolidated revenues
decreased 10% for the quarter and 7% for the year-to-date.
12. TRIBUNE COMPANY
PRO FORMA SUMMARY OF NEWSPAPER ADVERTISING VOLUME (Unaudited) (A) (B) (C)
For Second Quarter Ended July 1, 2001
(In thousands)
Second Quarter (13 weeks) Year-to-Date (26 weeks)
Actual Pro Forma % Actual Pro Forma %
2001 2000 Change 2001 2000 Change
Full Run
669 772 1,348 1,517
L.A. Times (13) (11)
1,103 1,250
Chicago Tribune 547 640 (15) (12)
849 829
Newsday 465 454 2 2
7,137 7,583
Other Daily Newspapers (D) 3,601 3,913 (8) (6)
Total 5,282 5,779 (9) 10,437 11,179 (7)
Part Run
1,229 1,523 2,469 3,067
L.A. Times (19) (19)
2,804 2,688
Chicago Tribune 1,449 1,396 4 4
835 876
Newsday 458 481 (5) (5)
3,091 2,989
Other Daily Newspapers (D) 1,601 1,537 4 3
Total 4,737 4,937 (4) 9,199 9,620 (4)
Total Advertising Inches
Full Run
Retail 1,689 1,772 (5) 3,212 3,375 (5)
National 809 975 (17) 1,682 1,910 (12)
Classified 2,784 3,032 (8) 5,543 5,894 (6)
5,282 5,779 10,437 11,179
Sub-Total (9) (7)
Part Run 4,737 4,937 (4) 9,199 9,620 (4)
Total 10,019 10,716 (7) 19,636 20,799 (6)
Preprint Pieces (E)
L.A. Times (F) 366,286 286,371 28 779,334 531,121 47
Chicago Tribune 676,041 737,191 (8) 1,329,424 1,377,225 (3)
Newsday 583,722 557,486 5 1,107,827 1,049,356 6
Other Daily Newspapers (D) 807,269 849,913 (5) 1,639,307 1,649,757 (1)
Total 2,433,318 2,430,961 - 4,855,892 4,607,459 5
(A) The pro forma 2000 data assumes that Times Mirror was acquired as of the beginning of 2000. The pro forma data does not
reflect any potential revenue enhancements or other synergies.
(B) Volume is based on preliminary internal data, which may be updated in subsequent reports.
(C) Advertising volume is presented only for daily newspapers.
(D) Other daily newspapers include The Baltimore Sun, South Florida Sun-Sentinel, Orlando Sentinel, The Hartford Courant, The
Morning Call, Daily Press, The Advocate and Greenwich Time.
(E) Preprint amounts have been restated to reflect pieces, rather than inches.
(F) Preprint pieces have been restated to exclude pieces distributed by L.A. Times direct mail operations.
13. TRIBUNE COMPANY
PRO FORMA SUMMARY OF REVENUES (Unaudited) (A)
For Period 6 Ended July 1, 2001
(In thousands)
Period 6 (5 weeks) Year-to-Date (26 weeks)
Actual Pro Forma % Actual Pro Forma %
2001 2000 Change 2001 2000 Change
Broadcasting & Entertainment
$ 123,724 $ 130,508 $ 577,391 $ 633,377
Television (B) (5) (9)
6,208 6,451 28,300 29,856
Radio (4) (5)
22,744 21,213 71,556 66,658
Entertainment/Other 7 7
Segment Total (C) 152,676 158,172 (3) 677,247 729,891 (7)
Publishing
Advertising
615,274 630,687
Retail 114,542 128,140 (11) (2)
350,040 384,221
National 66,187 71,969 (8) (9)
552,073 643,431
Classified 100,461 121,182 (17) (14)
281,190 321,291 1,517,387 1,658,339
Sub-Total (12) (8)
62,887 61,672 330,272 325,156
Circulation 2 2
107,037 99,958
Other 22,503 18,947 19 7
Segment Total (D) 366,580 401,910 (9) 1,954,696 2,083,453 (6)
28,068 21,983
5,505 4,492 23 28
Interactive
$ 524,761 $ 564,574 (7) $ 2,660,011 $ 2,835,327 (6)
Consolidated Revenues (E)
(A) The pro forma 2000 data assumes that Times Mirror was acquired as of the beginning of fiscal 2000. The pro forma data does not reflect any
potential revenue enhancements or other synergies.
(B) Includes WATL-Atlanta and WNOL-New Orleans, acquired in February 2000, and Tower Distribution (formerly United Video), acquired in
April 2001. On a same station basis, television revenues decreased 7% for the period and 10% for the year-to-date. Period 6 includes
copyright royalties of $7.6 million in 2001 and none in 2000. Year-to-date includes copyright royalties of $18.3 million in 2001 and $11.6
million in 2000. Excluding acquisitions and copyright royalties, television revenues decreased 12% for both the period and the year-to-date.
(C) Excluding acquisitions and copyright royalties, broadcasting and entertainment revenues decreased 9% for the period and 10% for the
year-to-date.
(D) Times Mirror's and Tribune's 2000 fiscal years began on different days. This difference resulted in the seven newly acquired newspapers
having five extra days in Period 1, 2001 compared to Period 1, 2000. Excluding the effect of these extra days, total publishing revenues
decreased 7% for the year-to-date, while advertising revenues decreased 9% from last year. Retail, national and classified advertising were
below last year by 3%, 10% and 15%, respectively.
(E) Excluding acquisitions, copyright royalties and the extra days in 2001 for the seven newly acquired newspapers, consolidated revenues
decreased 9% for the period and 7% for the year-to-date.
14. TRIBUNE COMPANY
PRO FORMA SUMMARY OF NEWSPAPER ADVERTISING VOLUME (Unaudited) (A) (B) (C)
For Period 6 Ended July 1, 2001
(In thousands)
Period 6 (5 weeks) Year-to-Date (26 weeks)
Actual Pro Forma % Actual Pro Forma %
2001 2000 Change 2001 2000 Change
Full Run
258 293 1,348 1,517
L.A. Times (12) (11)
1,103 1,250
Chicago Tribune 214 239 (10) (12)
849 829
Newsday 179 176 2 2
7,137 7,583
Other Daily Newspapers (D) 1,364 1,482 (8) (6)
Total 2,015 2,190 (8) 10,437 11,179 (7)
Part Run
462 642 2,469 3,067
L.A. Times (28) (19)
2,804 2,688
Chicago Tribune 544 534 2 4
835 876
Newsday 179 193 (7) (5)
3,091 2,989
Other Daily Newspapers (D) 567 539 5 3
Total 1,752 1,908 (8) 9,199 9,620 (4)
Total Advertising Inches
Full Run
Retail 622 665 (6) 3,212 3,375 (5)
National 326 367 (11) 1,682 1,910 (12)
Classified 1,067 1,158 (8) 5,543 5,894 (6)
2,015 2,190 10,437 11,179
Sub-Total (8) (7)
Part Run 1,752 1,908 (8) 9,199 9,620 (4)
Total 3,767 4,098 (8) 19,636 20,799 (6)
Preprint Pieces (E)
L.A. Times (F) 142,567 115,104 24 779,334 531,121 47
Chicago Tribune 268,806 271,673 (1) 1,329,424 1,377,225 (3)
Newsday 219,128 203,717 8 1,107,827 1,049,356 6
Other Daily Newspapers (D) 290,786 304,901 (5) 1,639,307 1,649,757 (1)
Total 921,287 895,395 3 4,855,892 4,607,459 5
(A) The pro forma 2000 data assumes that Times Mirror was acquired as of the beginning of 2000. The pro forma data does not
reflect any potential revenue enhancements or other synergies.
(B) Volume is based on preliminary internal data, which may be updated in subsequent reports.
(C) Advertising volume is presented only for daily newspapers.
(D) Other daily newspapers include The Baltimore Sun, South Florida Sun-Sentinel, Orlando Sentinel, The Hartford Courant, The
Morning Call, Daily Press, The Advocate and Greenwich Time.
(E) Preprint amounts have been restated to reflect pieces, rather than inches.
(F) Preprint pieces have been restated to exclude pieces distributed by L.A. Times direct mail operations.