Download to read offline

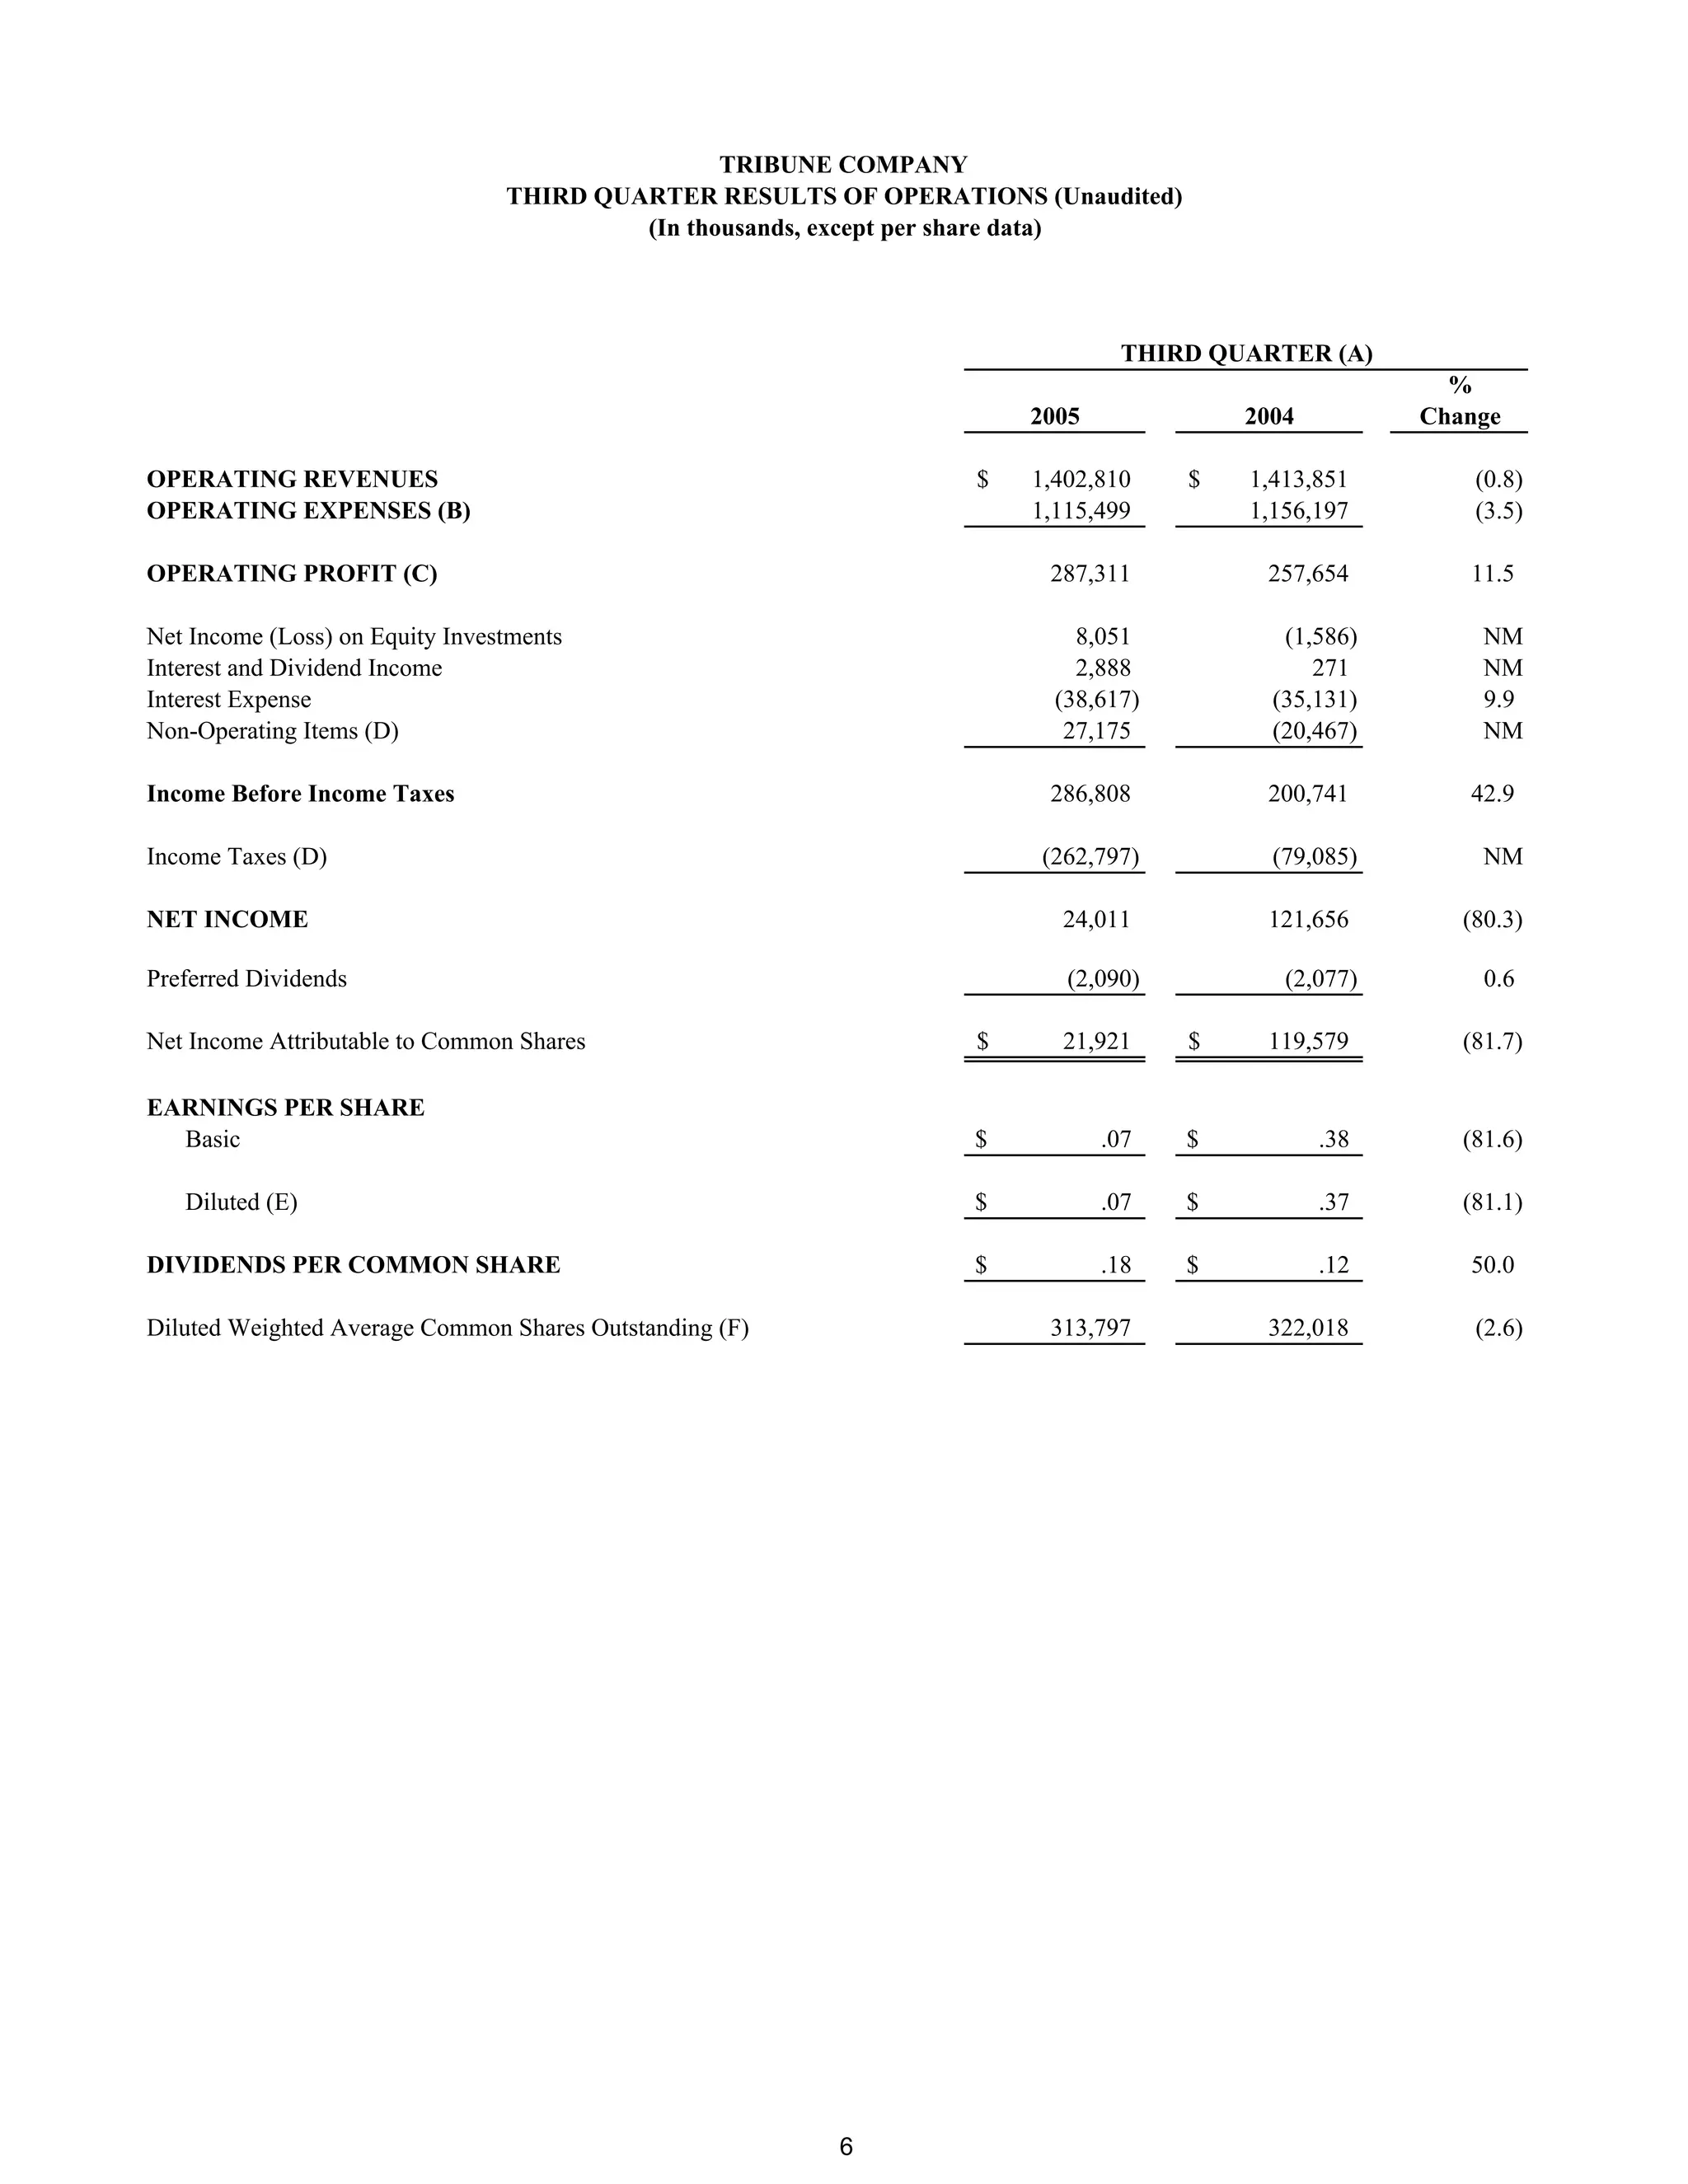
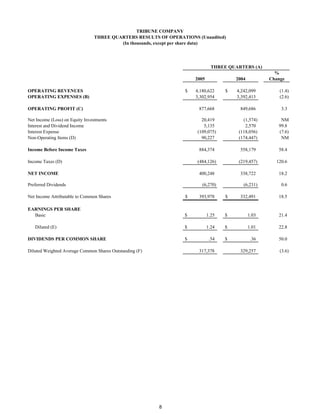
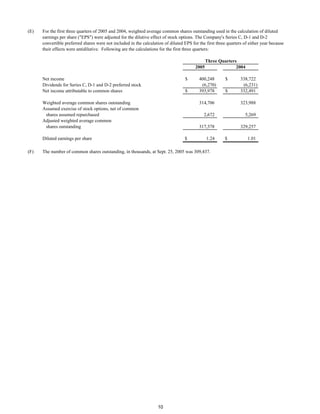
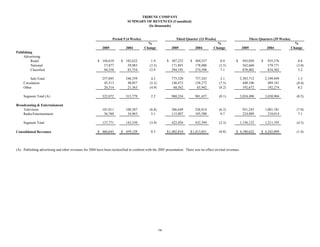
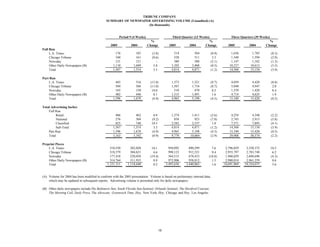
The document summarizes Tribune Company's financial results for the third quarter and first three quarters of 2005 compared to the same periods in 2004. Key points: - Operating revenues and operating profit increased in the third quarter of 2005 but decreased for the first three quarters compared to the prior year. - Net income decreased significantly for the third quarter but increased for the first three quarters of 2005 versus 2004. - Earnings per share decreased substantially for the third quarter but increased for the first three quarters compared to the previous year.


