Download to read offline
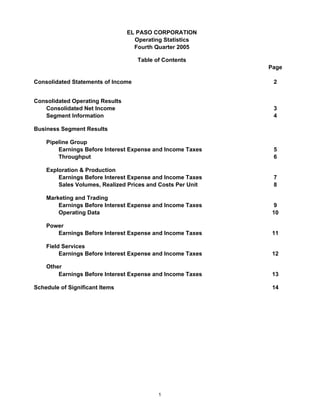


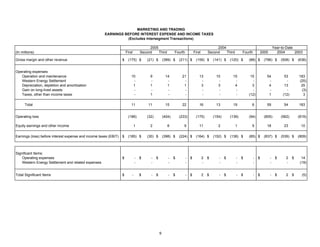


The document provides operating statistics and financial results for El Paso Corporation for the fourth quarter and full year of 2005. Some key details include: - For the fourth quarter of 2005, El Paso reported a net loss of $162 million and a loss from continuing operations of $283 million. - For the full year 2005, El Paso reported a net loss of $606 million and a loss from continuing operations of $702 million. - El Paso reported earnings before interest and taxes of -$106 million for the fourth quarter and $398 million for the full year from its various business segments including pipelines, exploration and production, marketing and trading, power and field services.


